Outcome
Intention
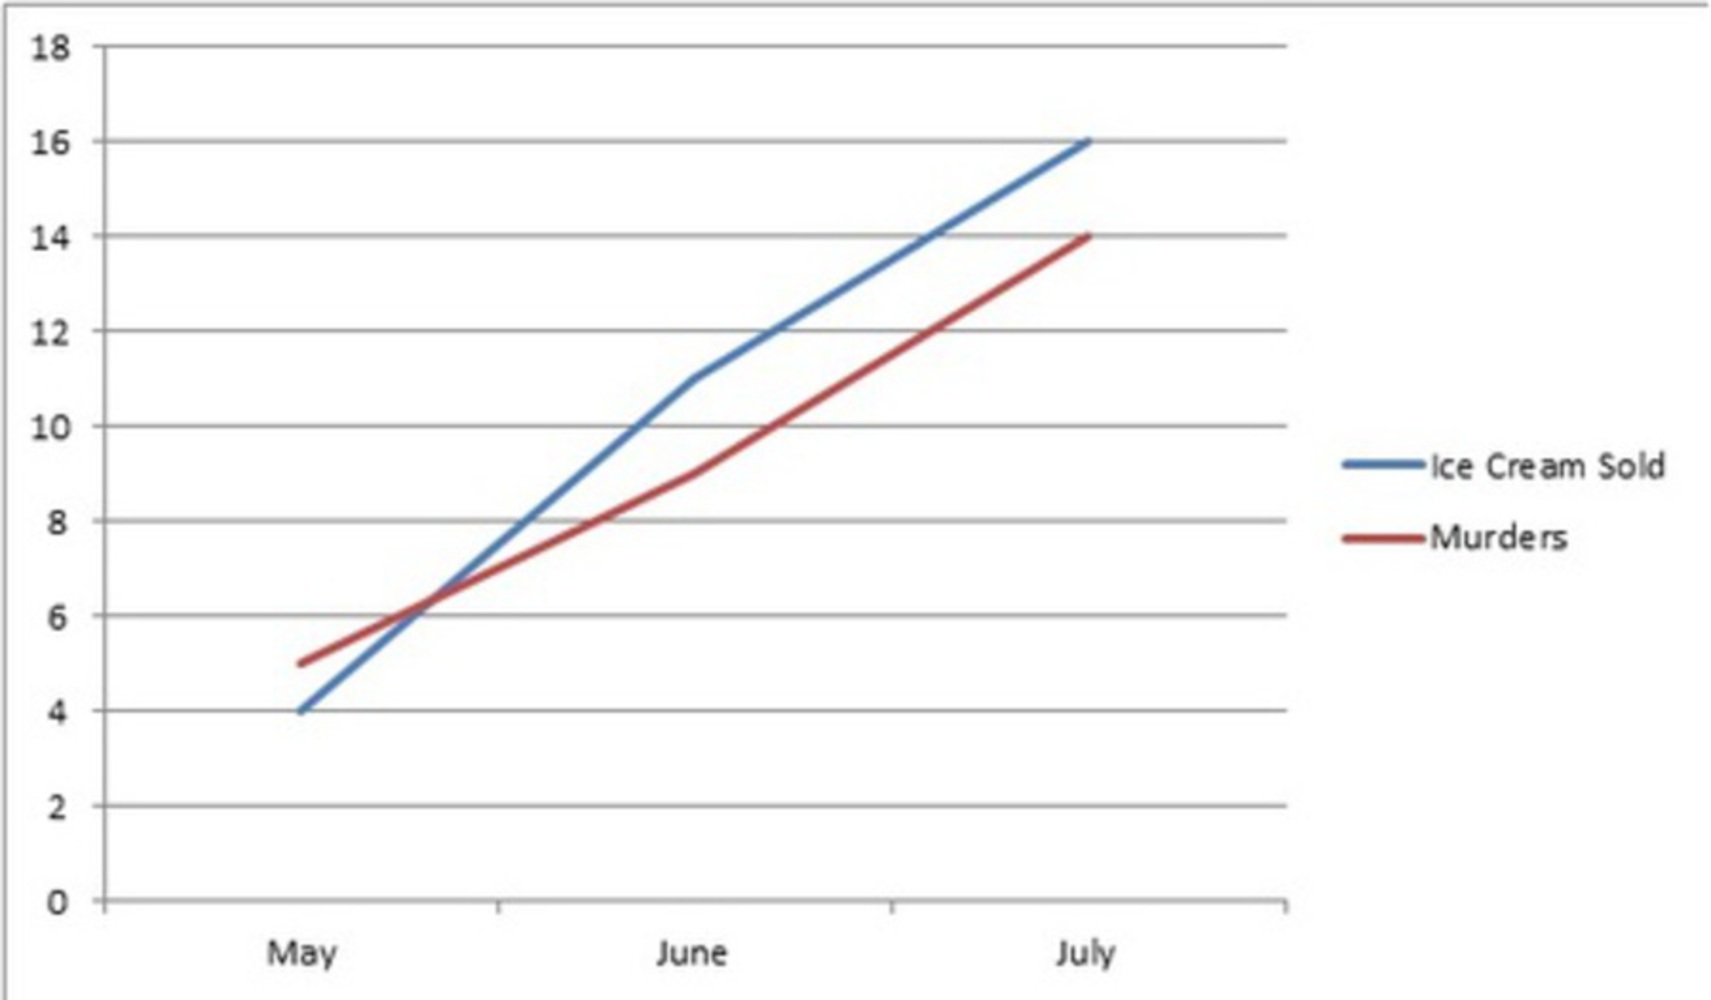
I remember seeing a graph correlating the number of murders to the consumption of ice cream, and that when more ice cream was consumed, more murders occurred. This is an example of how correlations are not the same as causations, but if done properly, can be used to argue that one causes the other.
The most difficult part was coming up with a correlation that might seem like it would also be a causation, but not actually be a causation. I wanted to create an argument about the recent surge of technology use and how it has had a negative impact on society, but it was not easy to think of a way to show that the use of technology was negatively affecting society. There are, of course, many benefits to using technology, but at the same time, I realized that people are becoming less active because of how much they use technology, myself included. So I decided to look into obesity statistics and correlate them to smartphone usage.
Context
There have been many studies on the relation between the use of technology and most of them argue that technology does have a negative effect on the obesity rate. In fact, it makes sense for this to happen because when we use technology, we are often not active while using it, and less physical activity leads to more obesity.Process
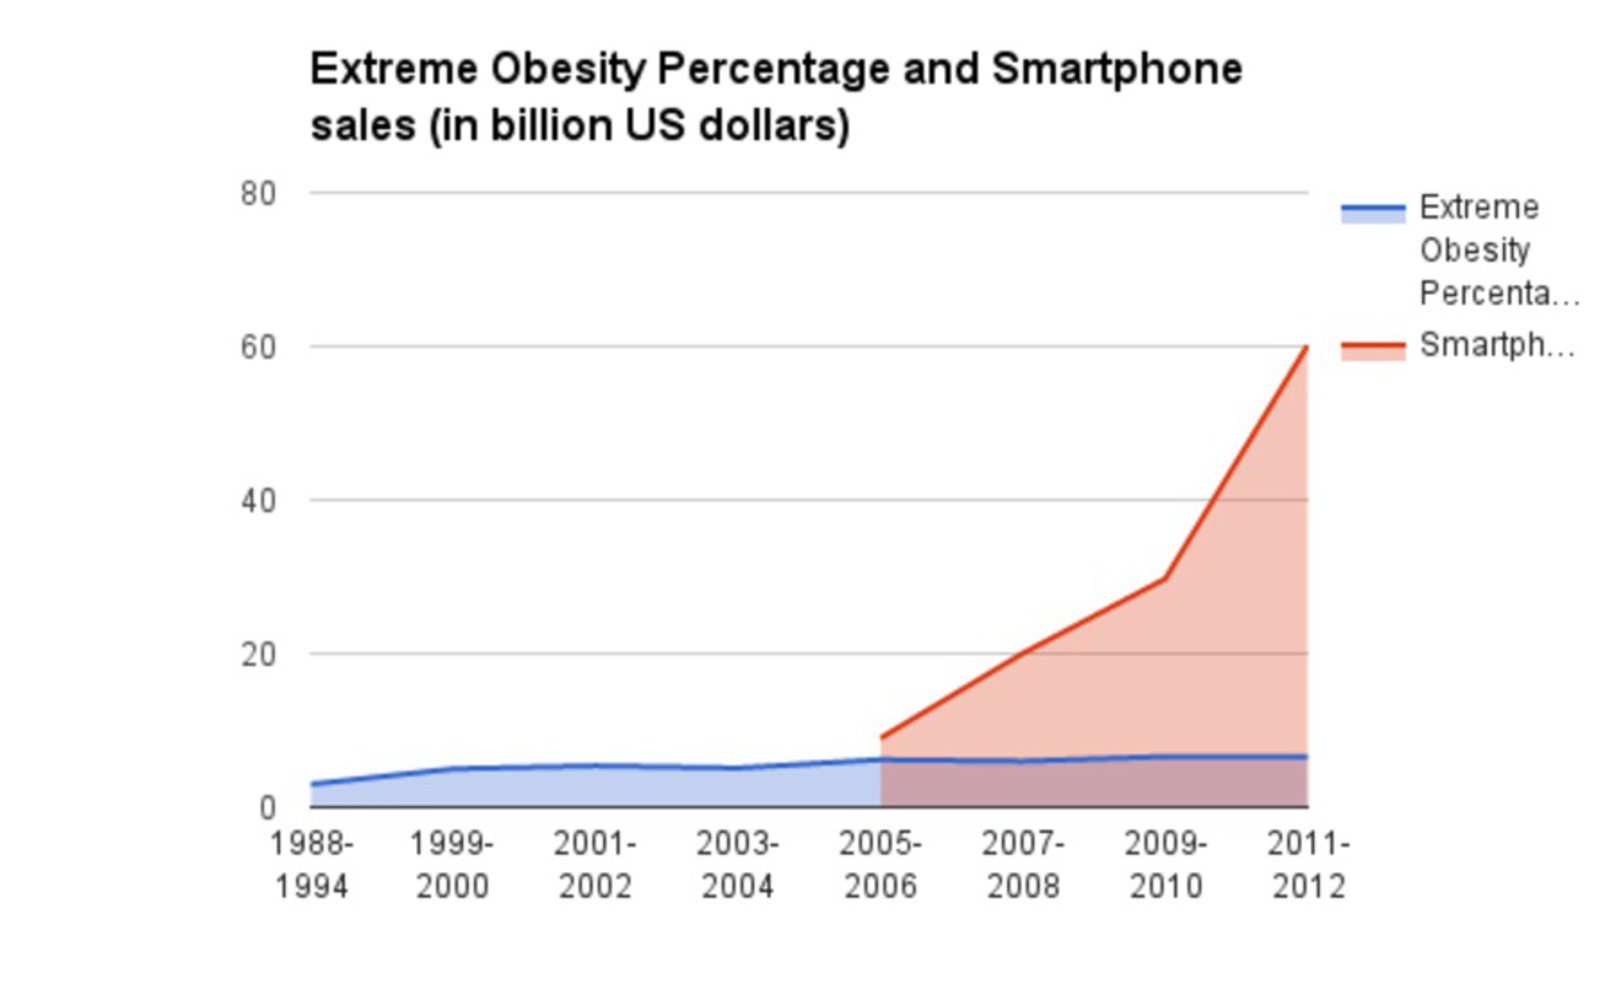
I looked up statistics of obesity rates since 2005, because that is when smartphones started to become popular. I also looked up the sales of smartphones starting from 2005. When I graphed the obesity rates, however, I noticed that there wasn’t much of a change in the trend even when smartphones were introduced in 2005. In fact, the graph for the obesity rate looks almost like a straight line, as if it isn't changing at all. I then realized it would be more interesting to argue that the use of technology does not affect obesity rates and therefore are not making us less active, which is counterintuitive, because it was what I believed in the first place. I disproved my own argument.Reflection
I was able to lie to myself using this project, since the result I got when I graphed the data was not what I had believed it would be. Looking at my graph, it seems to say that technology doesn't affect obesity rates, but in fact, the studies say otherwise.If I could do something differently, I would choose another correlation that would make more of a convincing argument when using the proper data.
You can upload files of up to 20MB using this form.