Outcome
Intention
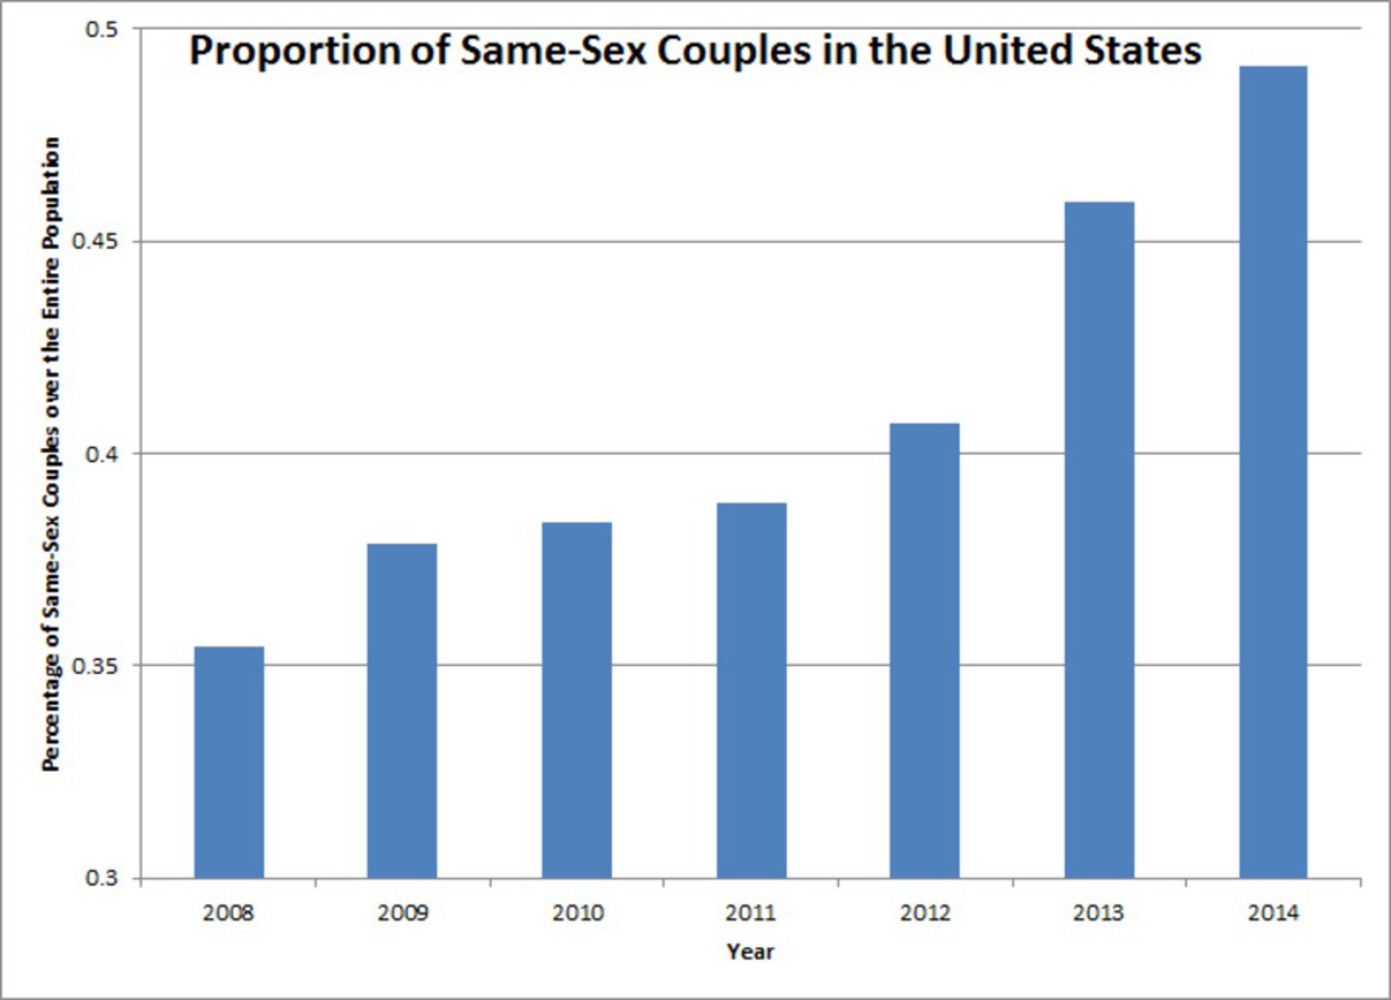
With the relatively recent legalization of same-sex marriage, I decided I would make a chart illustrating what some radical people believe to be happening to the United States -- the takeover of the LGBT community. It's not as if everyone will become gay and the human population cease to reproduce, and yet this is an idea that pervasive idea among some communities. I wanted to make something that made their ideas seem right on the surface, but upon closer inspection is completely and utterly trash.Context
Since we saw some examples from Fox News, I thought about doing something in that vein. As a right-wing news outlet, Fox News opposes same-sex marriage, so I decided to make something dealing with the LGBTQIA+ community. I settled with same-sex couples, since it's a little bit more topical than simply just the LGBTQIA+ community.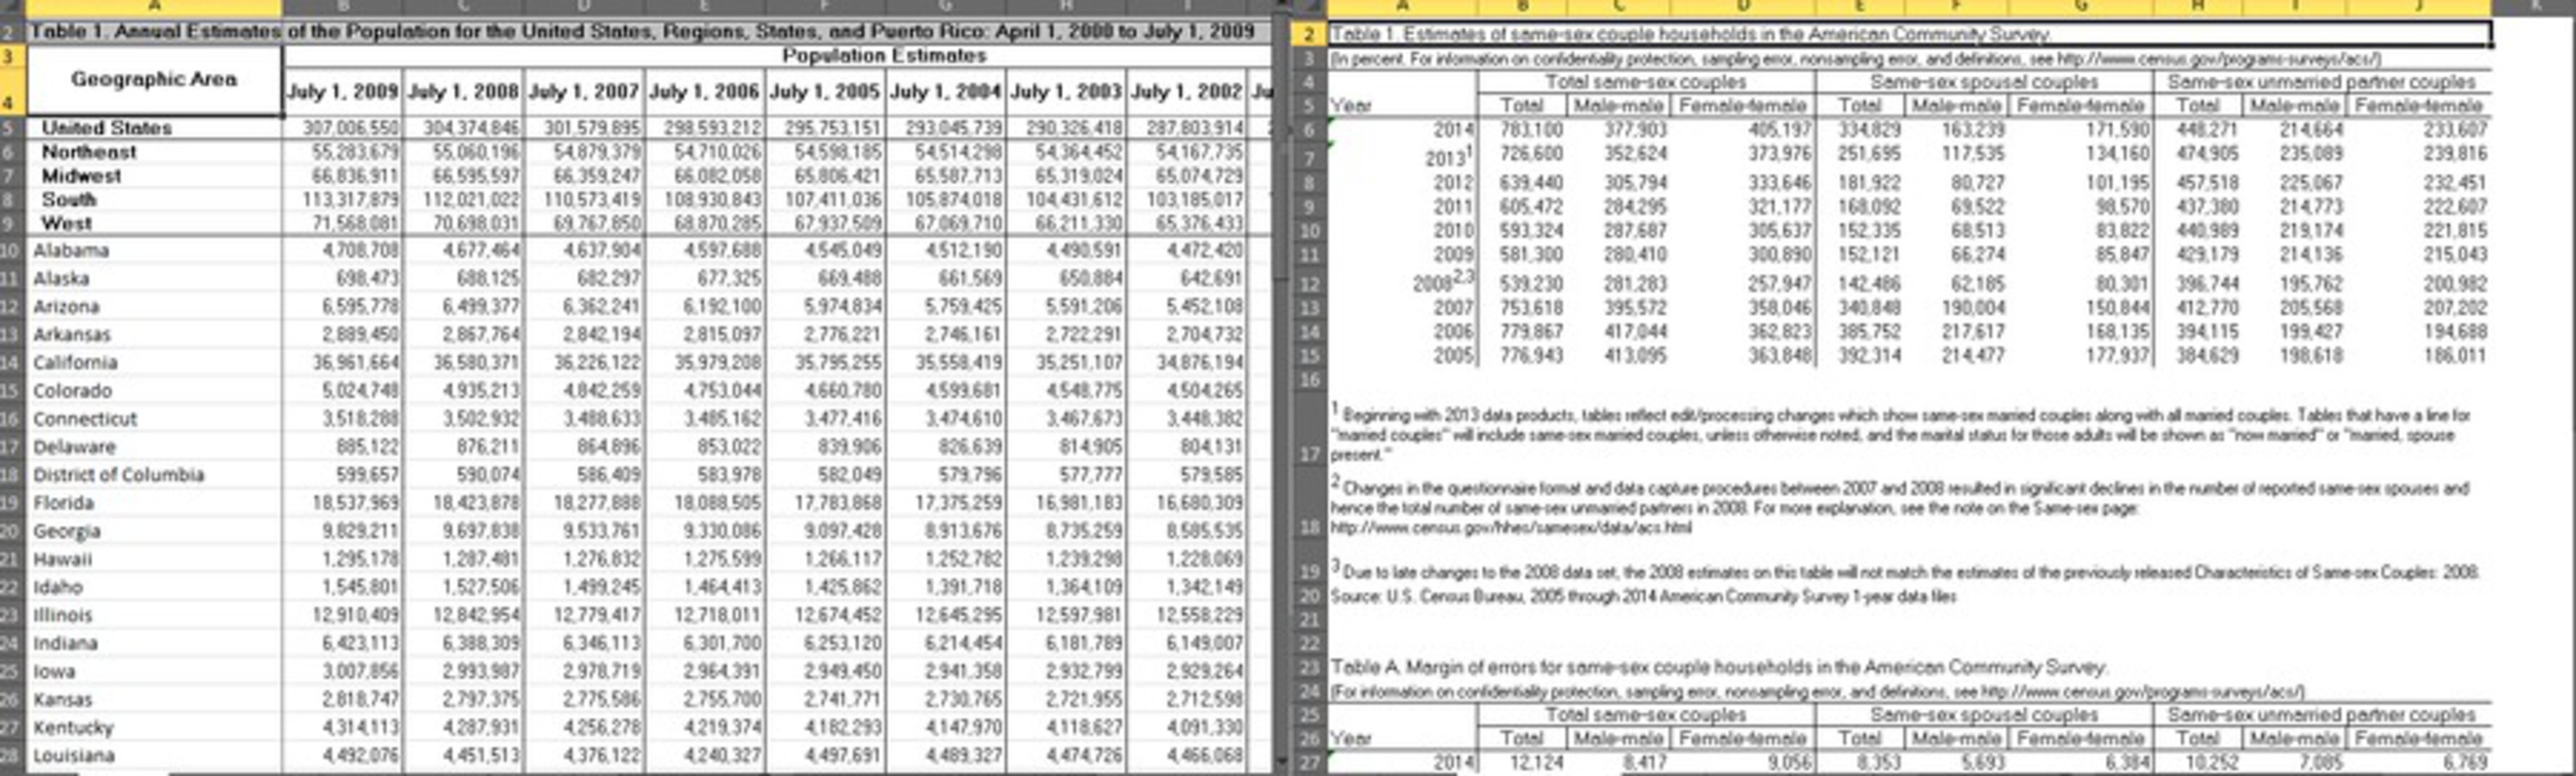
Process
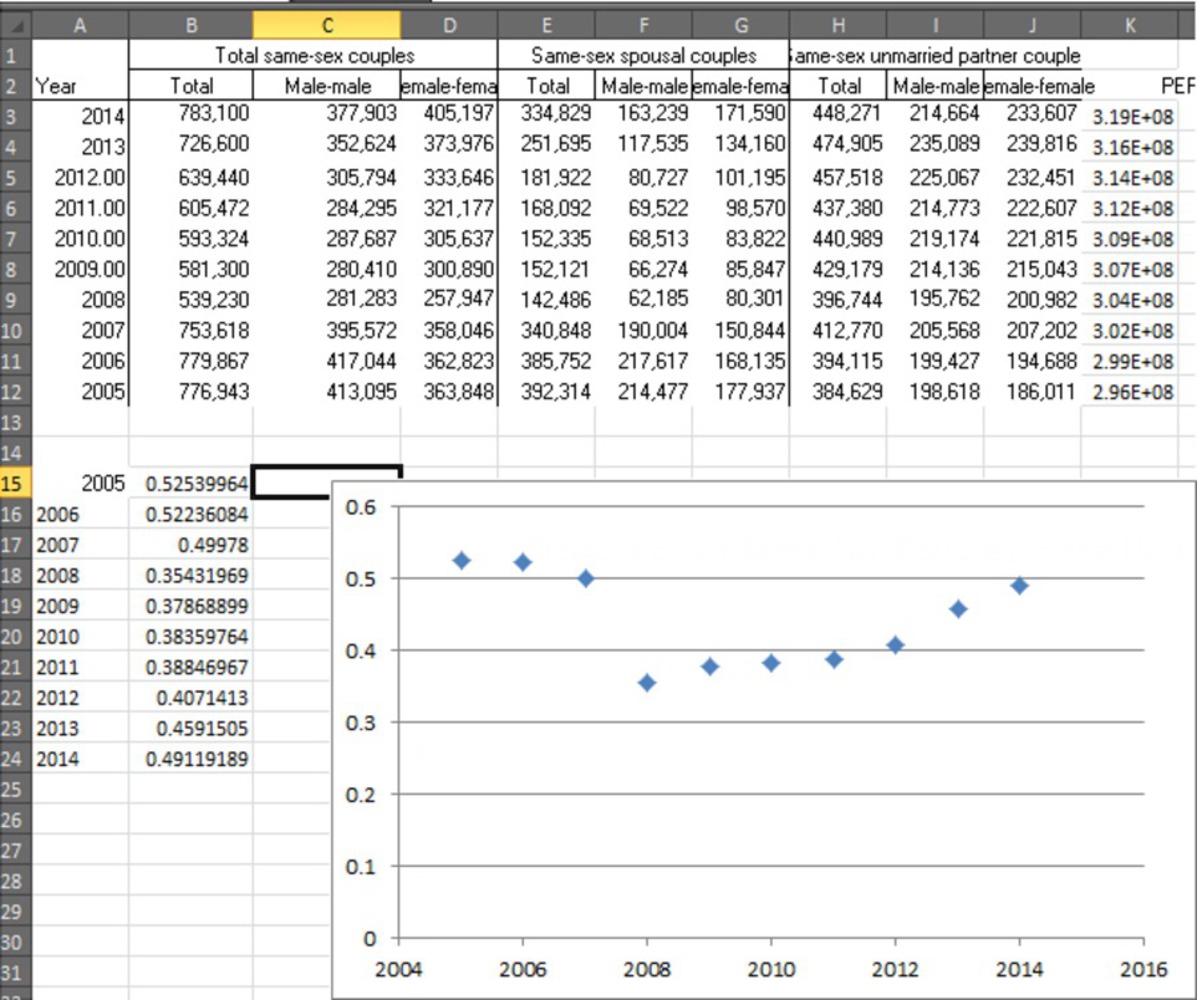
After I decided on the topic that I was going to lie about, I went and looked through the suggested databases, but couldn't find anything I could use. So I turned to Google and stumbled upon the US census site. Unfortunately, though I wanted to compare same-sex couples along with the number of couples nationally, or just the number of people identifying as other than heterosexual, the census site did not provide information about couples or LGBTQIA+ folk in general. I went through a couple chart types before settling on the classic bar chart. Although the data is as correct as it can be coming from a census, the visualization is misleading since the chart is truncated, making it seem as though the number of same-sex couples is rising at a nearly exponential rate. Additionally, in 2008, the way the census question was worded changed, resulting a drop in the number of reported same-sex couples. The data prior to 2008 was omitted to create the illusion of a constant increase in the number of same-sex couples.
Reflection
In the future, I would like to search a little deeper for the data, maybe explore some alternative sites. The chart is sufficiently misleading, in my opinion, but next time, I would perhaps color it differently and make it stand out a little more. I believe right wing news outlets would use this chart to illustrate their conspiracy theories about same-sex marriage, so I suppose in that regard, it is a success.You can upload files of up to 20MB using this form.