Prompt: To design and build a prototype for a cross-campus energy usage display system. Using live and historical data to develop a system that will change the behavior of building occupants by making them aware of their energy consumption and encouraging them to act responsibly.
Outcome
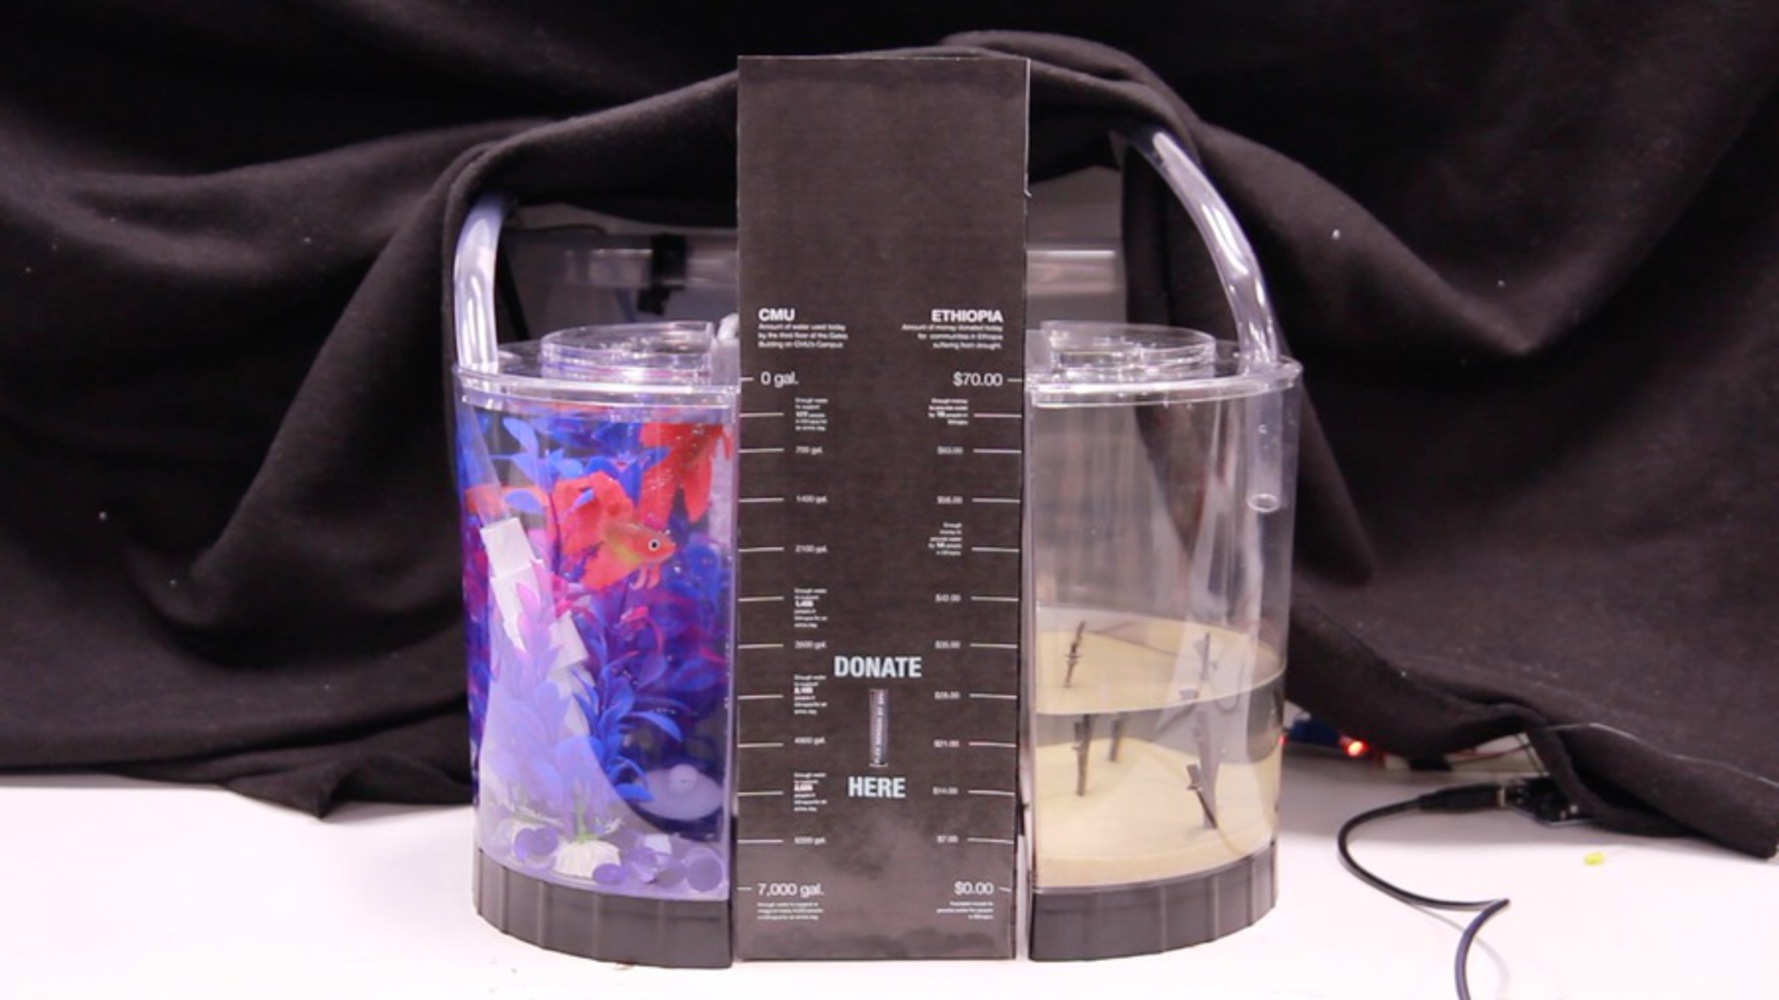
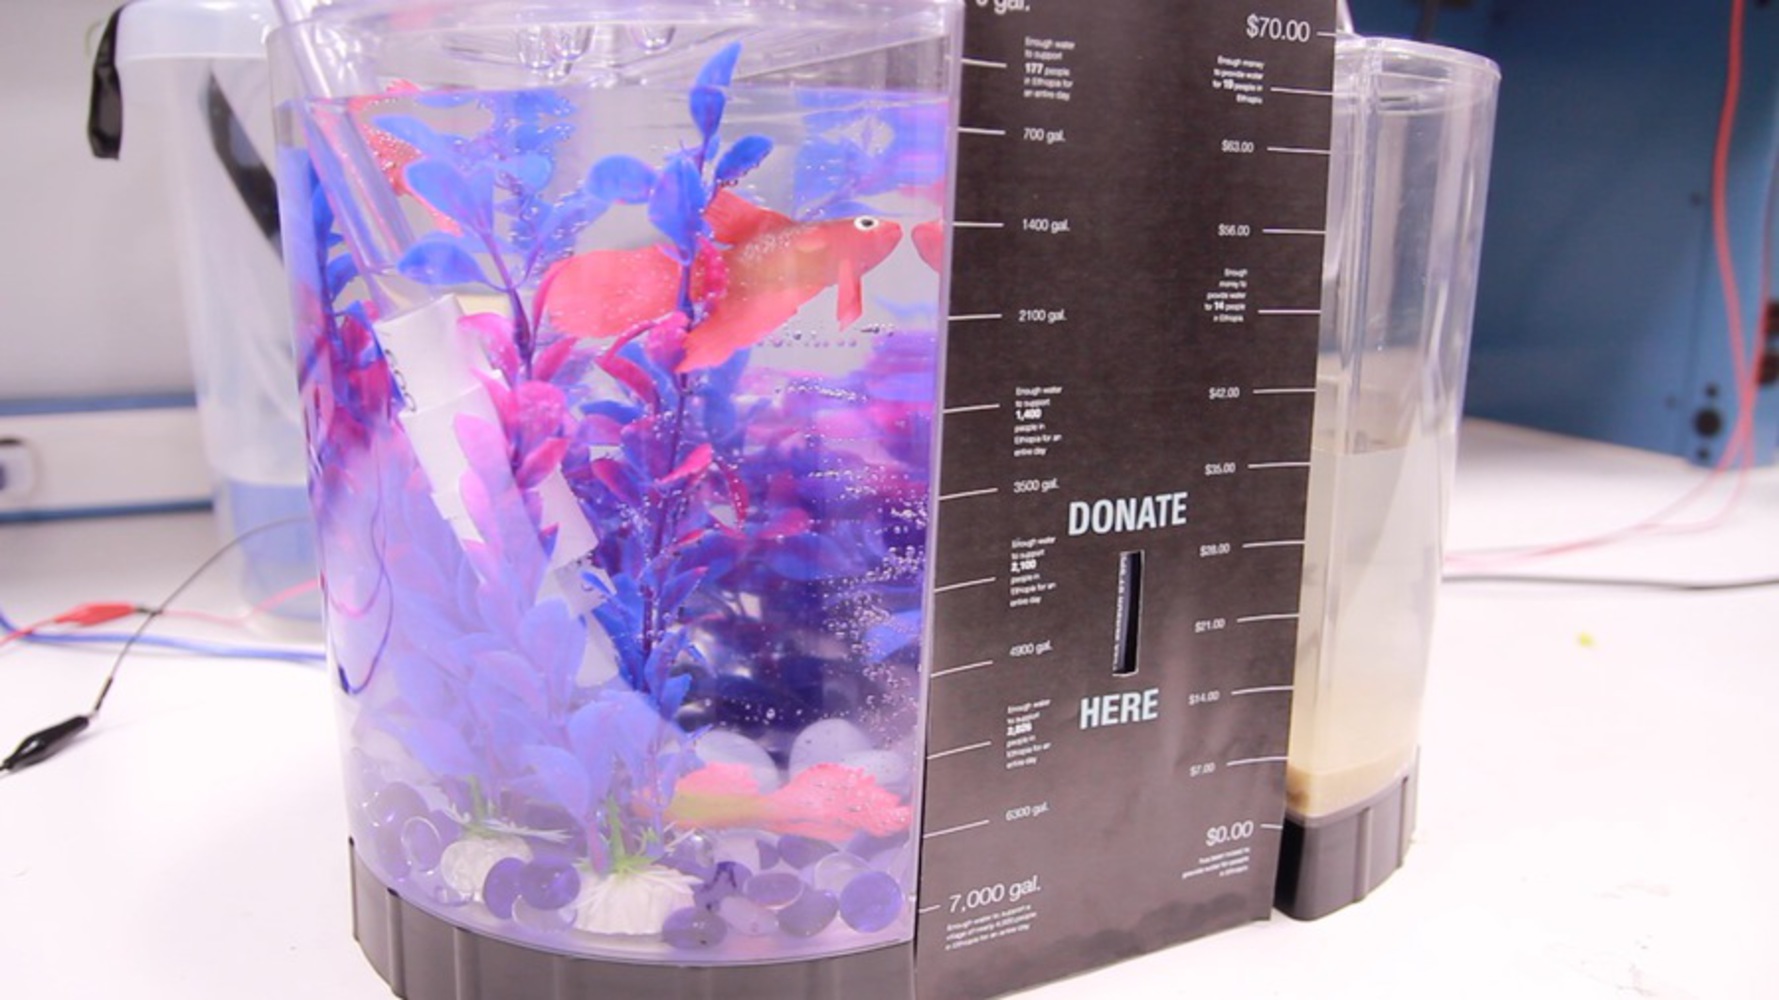
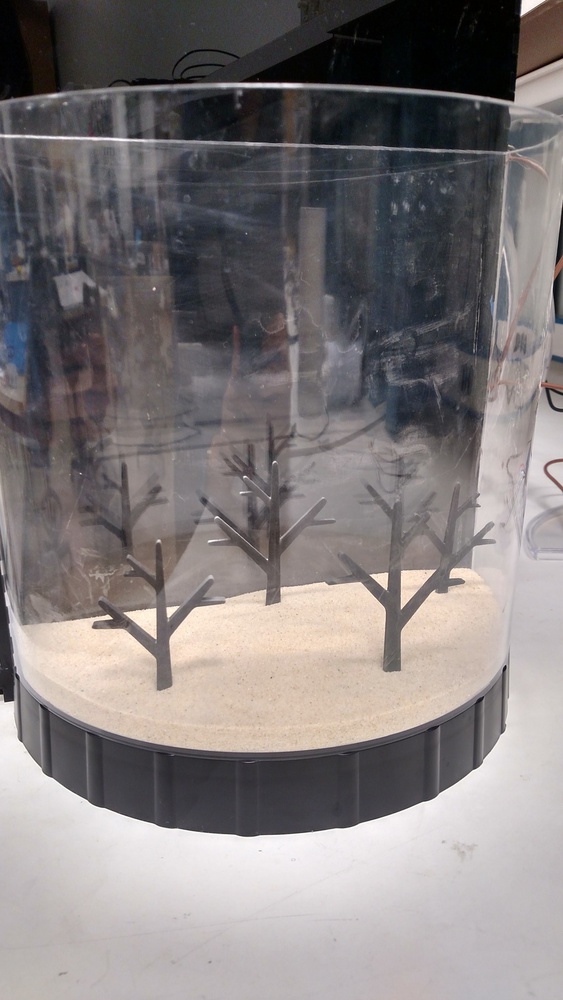
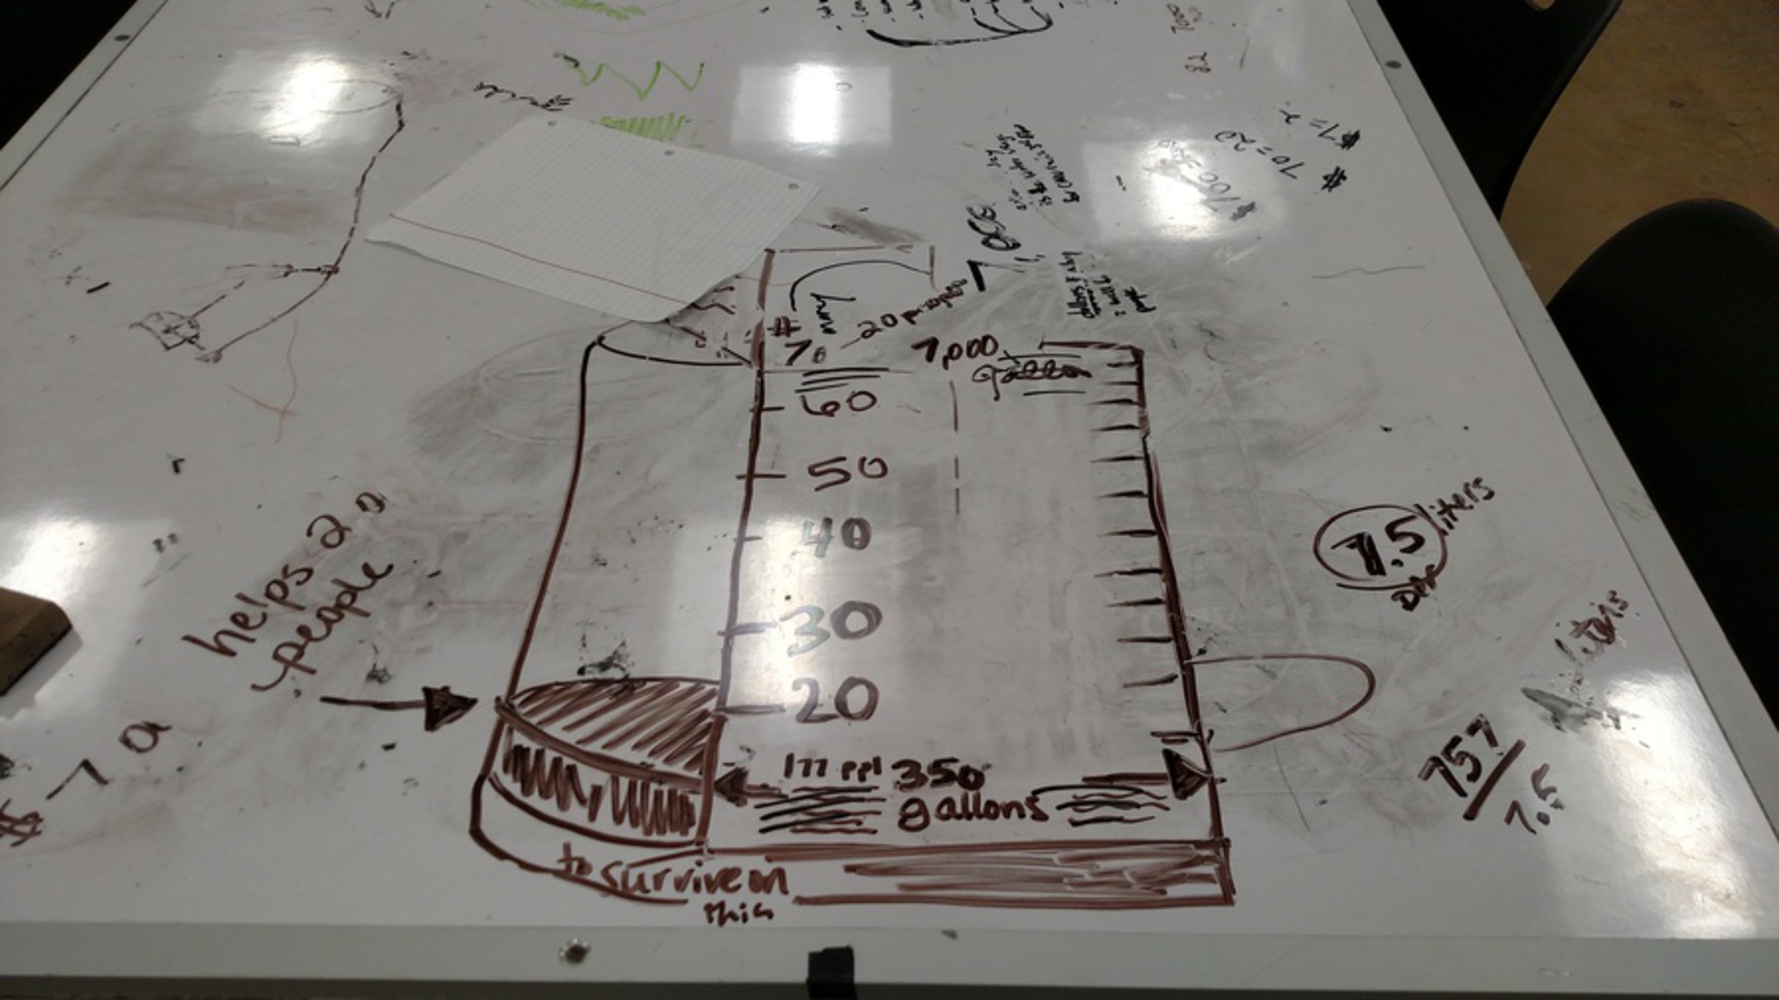
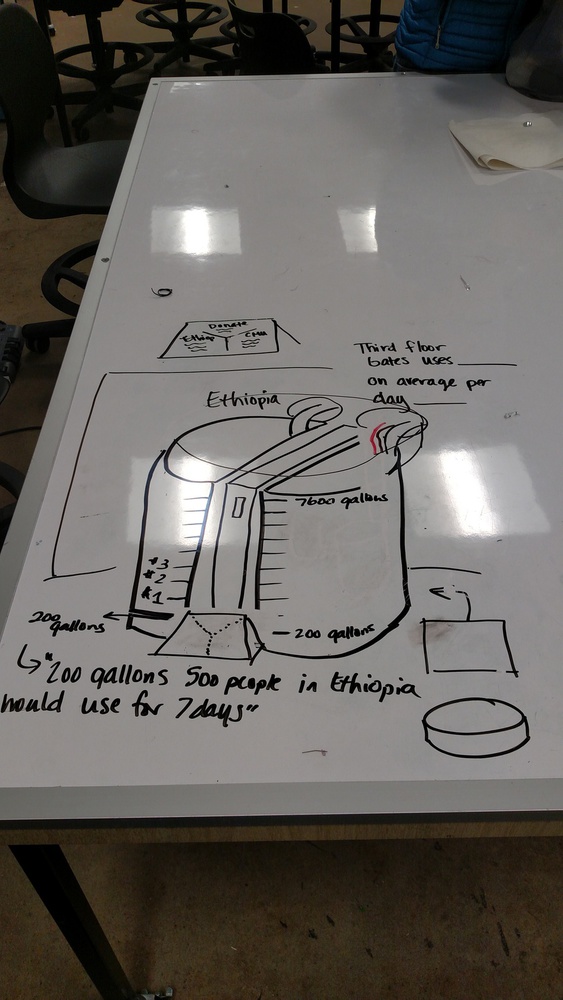
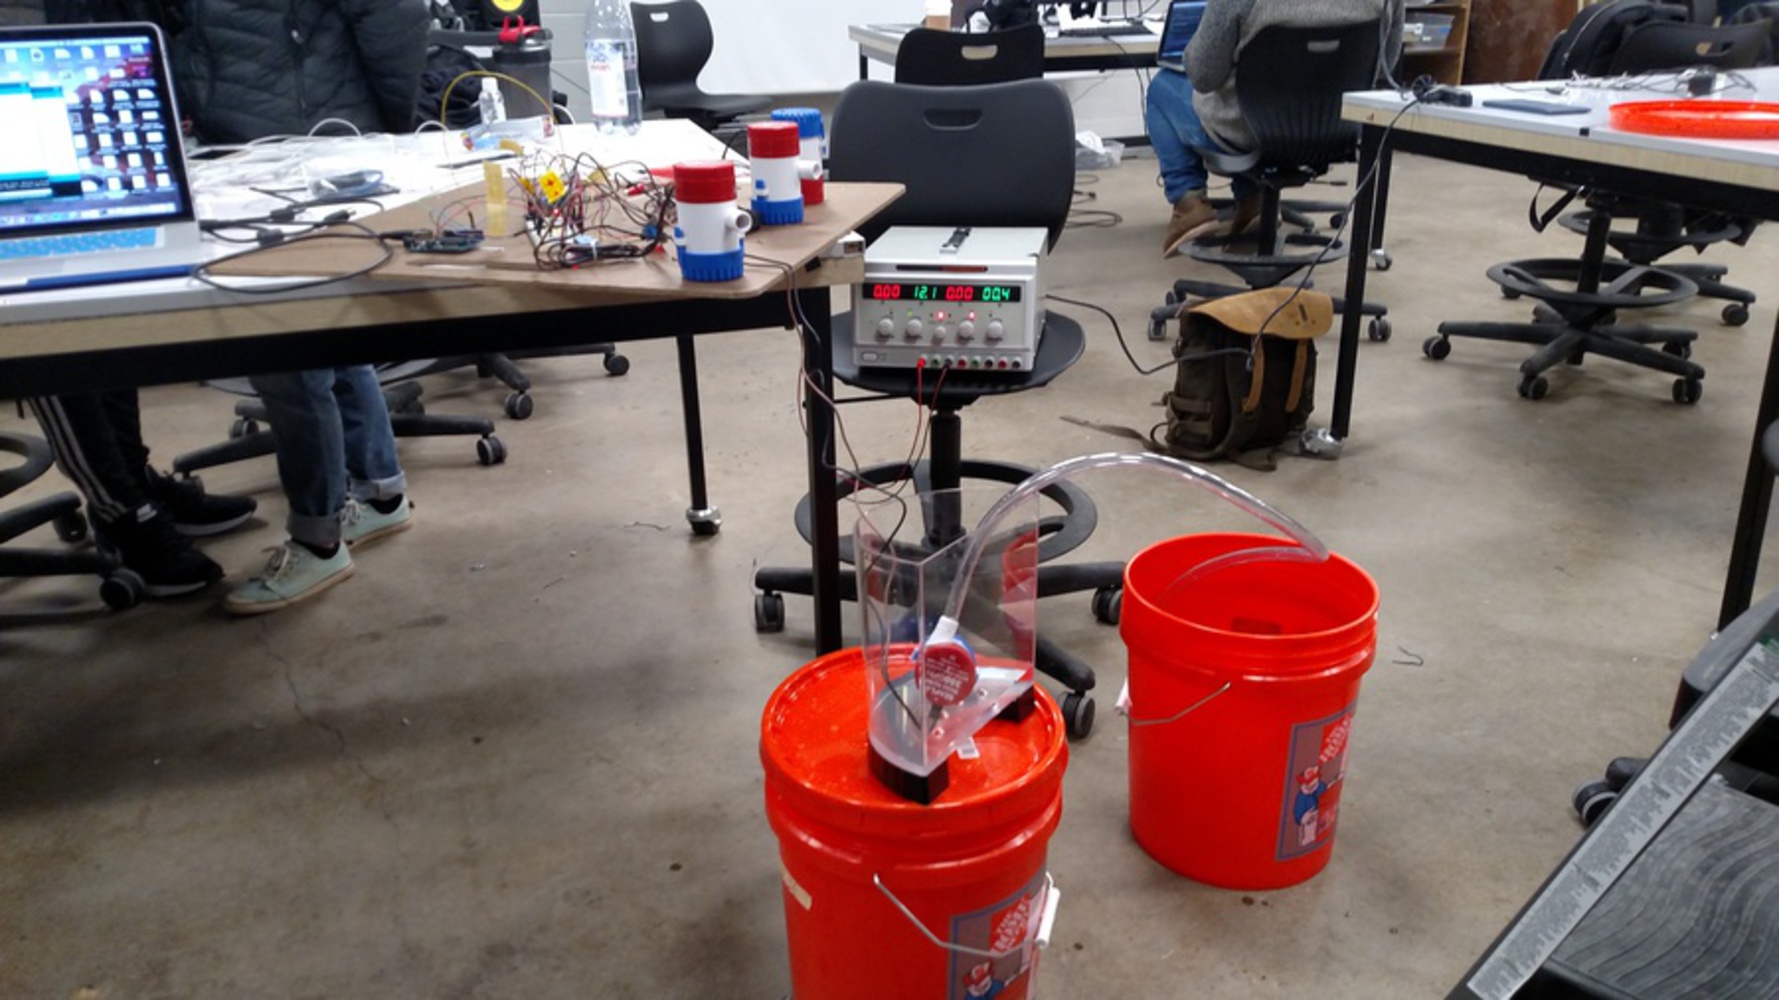
We made a miniature version of what would replace the column in Gates. The two tanks represent water reservoirs that feed two different communities. The CMU tank represent the water reservoir that is being drained to power CMU. The other side is a drought tank, that shows the amount of accessible water in a country undergoing a drought. The drought tank is show as a stark contrast to the amount of water that is available. This tank encourages awareness of other communities and activism. While we are currently using the information from Ethiopia, which only has 7.5 liters of water per person, we are using Conflict Kitchen as inspiration where the Drought tank work rotate to different countries undergoing a drought to bring awareness to CMU.
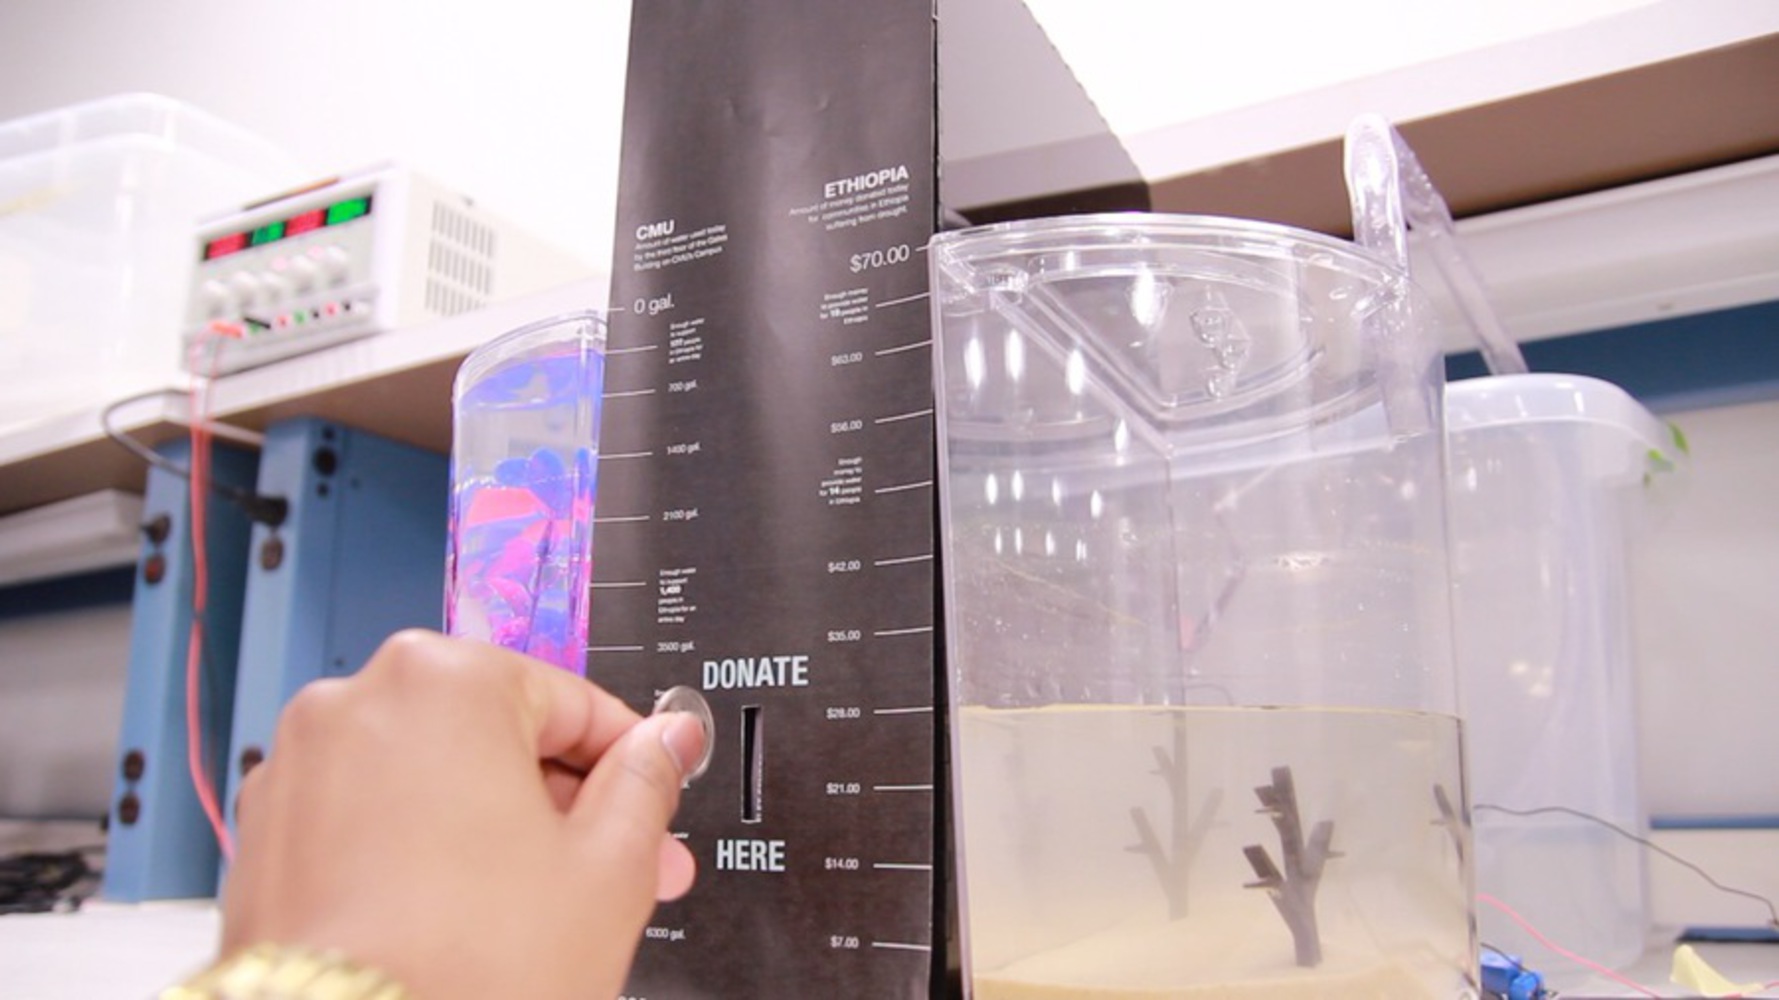
Drought Tank - This tank is more dynamic and used as a comparison point to the CMU water usage. This tank’s purpose is to educate CMU students about the world at large and get students involved in helping out another community. Each money is added to the donation box, some water will be added to the tank, bringing the tank to life. The money will be donated to help that community.
Issues: Since there was very limited API data that we had access to, we could only use the API data from 3rd floor Gates. We would have preferred water usage data from the dorms or somewhere where the water usage is less automated. Therefore, we took the 3rd floor gates water usage data as a contrast point to the water available in a community undergoing a drought. We show the water consumption of 3rd floor gates, where the inhabitants are very transient, to the only amount of water a community in Ethiopia has to use per day. This illustration is to highlight the differences in water consumption and encourage awareness. This will also encourage people to give money which will be donated to the community undergoing the drought.
Precedent Research:
In our precedent research we found people are more likely to do something when given the ability to say no. Therefore, the giving portion of this is not mandatory. But we are placing the donation box in a public place which allows there to be a social aspect to the donation box. In motivational apps, they found the ones that were the most successful had a social aspect where people would hold each other accountable and give each other praise. By having the donation box where everyone could see a person putting money into the donation box and seeing the actual impact of putting money into that environment, it would cause people to give more often.
Additionally we used BJ Fogg’s Model where we change behavior through motivation, ability and triggers. We make it easy for people to do an activity, give them the motivation through the information our display is showing and give them the trigger through the public affirmation. Therefore, people who just bought their coffee could easily give their left over change to the drought stricken community.
Tools used:
- 2 Arduinos
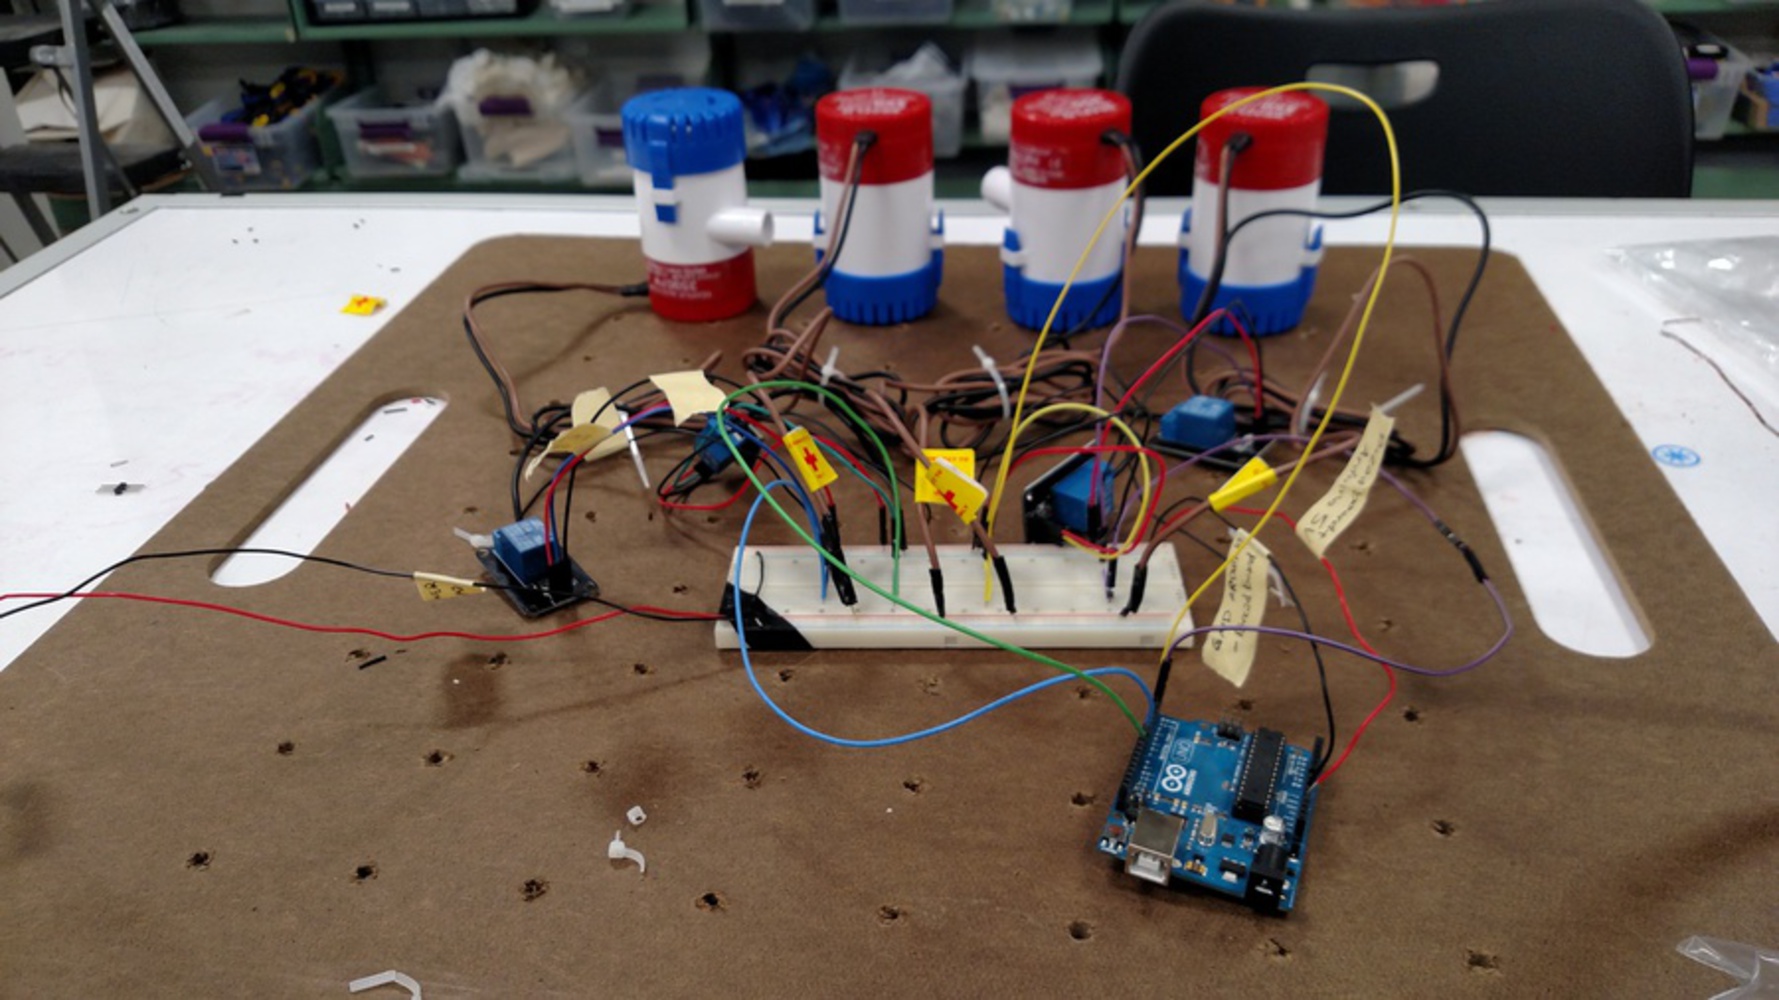
- 4 pumps (but for the demo 2)
- 2 Tanks
- Wire
- Bend sensor
- Valves
- Tubing
- Aquarium plants
- fish
- sand
- 3d printed trees
- pebbles
- spray paint
- acrylic
- 2 DC power
- buckets
- switches
- soldered male headers
- tape
- bread boards
Software Used:
- Pi Web Api
- Processing
- Arduino
Process:
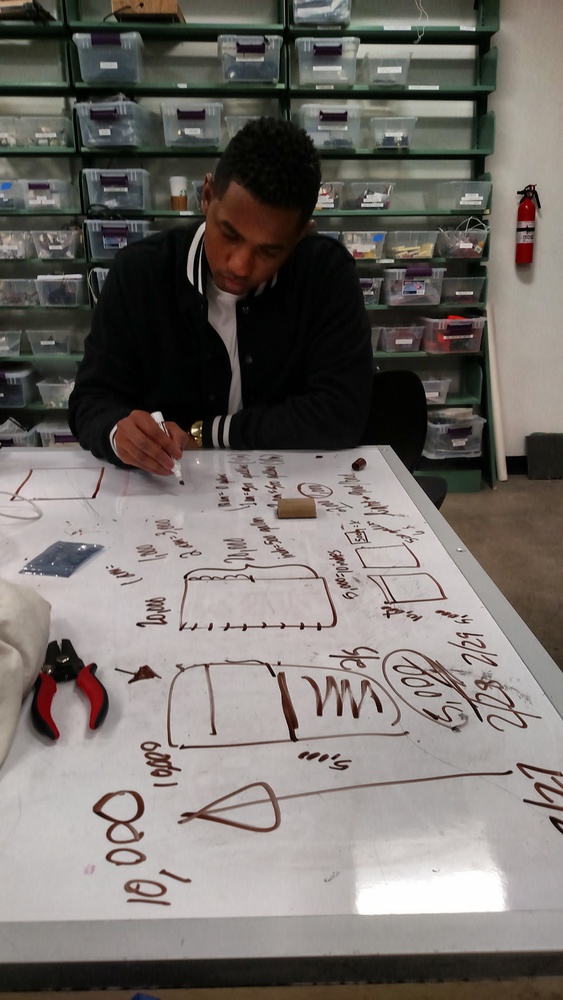
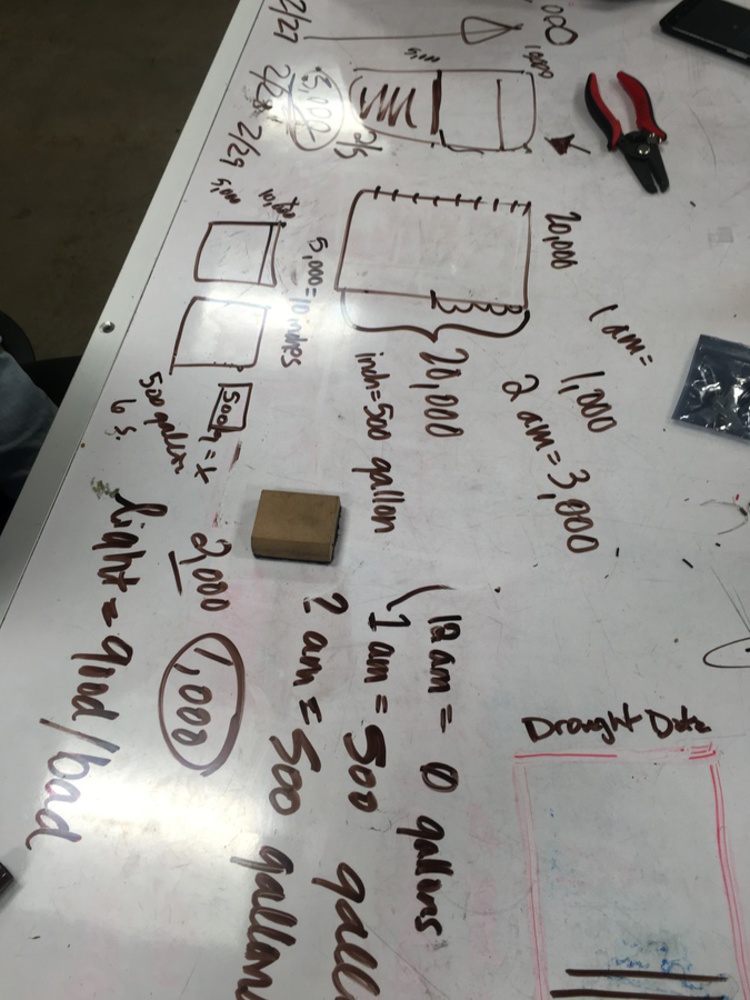
We started out with an original idea of comparing CMU water usage to a community undergoing clean water shortages. We played around with the idea of compairing Flint water usage or Ethiopia water usage amount. We had to go through a lot of iterations on how to present meaningful and relevant data.
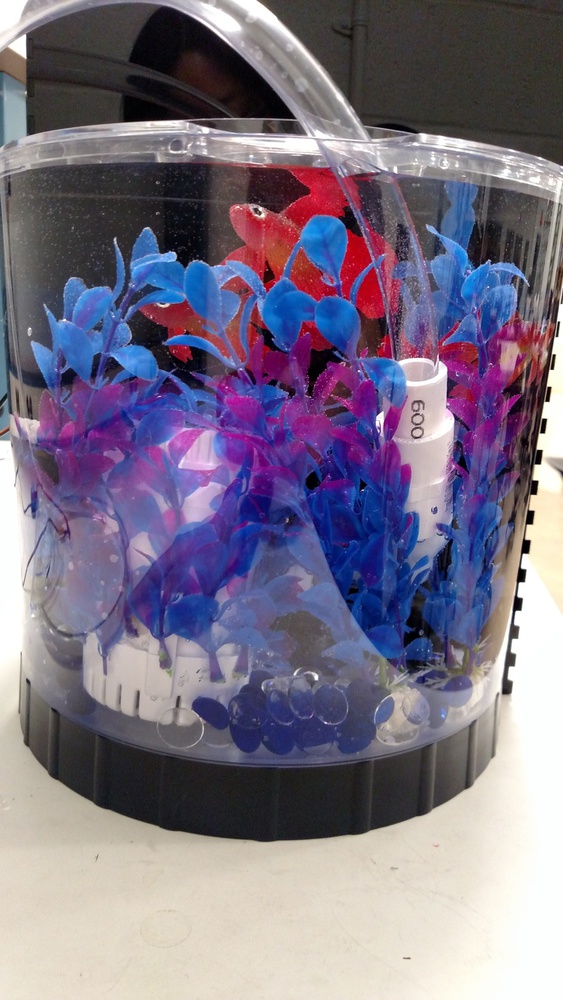
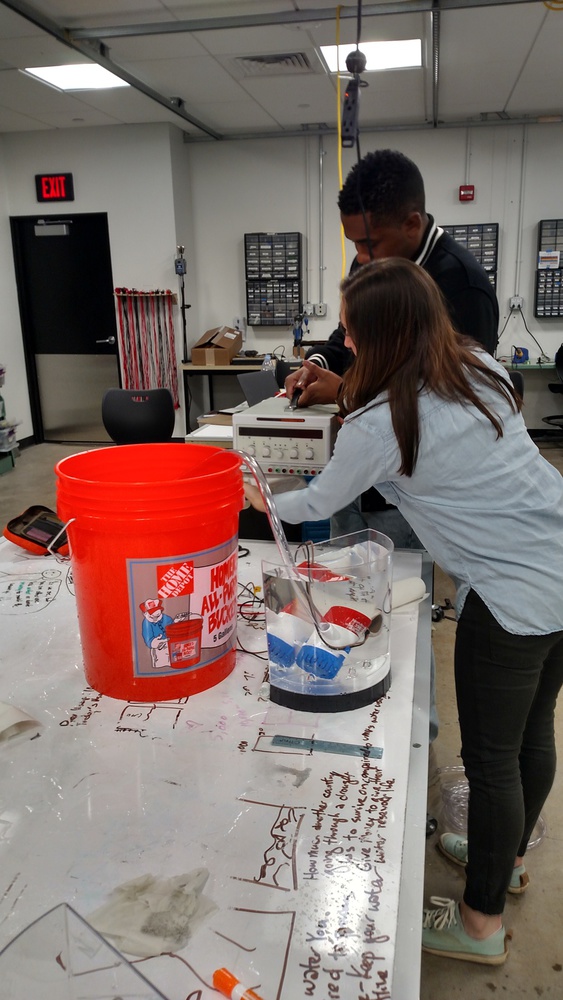
Even after we got the individual components working, we had the issue where the components were not working together as a system. We had the issues with the pumps where if the bucket of water was not aligned correctly, it could cause a vacuum that sucked out all the water even after the pump turned off. Also, it could cause the amount of water to back wash back into the tank causing no difference in the amount of water in the tank. We tried to solve this ineffectively through the use of valves. We eventually just had to shape the tubes just correctly so that we could make sure the right amount of water was moving in the right direction. Information was not being transferred through serial from Processing to Arduino. We had to rewrite all the coding for the pumps using the API information into Processing. Therefore Processing controlled the pumps through Arduino running Firmata. We kept the bend sensor information in Arduino on a separate Arduino and power source. Also, in the interest of time, we eliminated the 2 extra pumps that would have reset the tanks at the end of the day.
You can upload files of up to 20MB using this form.
