Back to Parent

Outcome


Intention

Our data is being exchanged and received virtually every second we are online. Our online presence is becoming larger and larger with us leaving behind a trail of data and personal information that can be easily found. What if we took control of our online self and created meaning out of our data footprints? 

This project aims to gather the data we leave behind and create an artwork that is a representation of ourselves. Our music taste is already a representation of who we are and what kind of emotional state we like to experience. We usually choose music based on how we are feeling or how we want to feel. Therefore this project will gather data about what type of music the user is listening to and create a unique data visualisation of this. This is so the user can remember how they were feeling throughout their past days and at what points their moods changed. Hopefully, this will aid the user discovering more about themselves by reflecting on their past musical moments.

In the form of a start-up page on your browser, this project will utilise the Spotify API and gather your personal musical data, in particular, what genre is most listened to. It will then display this data in the form of a  chrome extension, patterned start-up page.  
Prototype

Parts used in the prototype. 

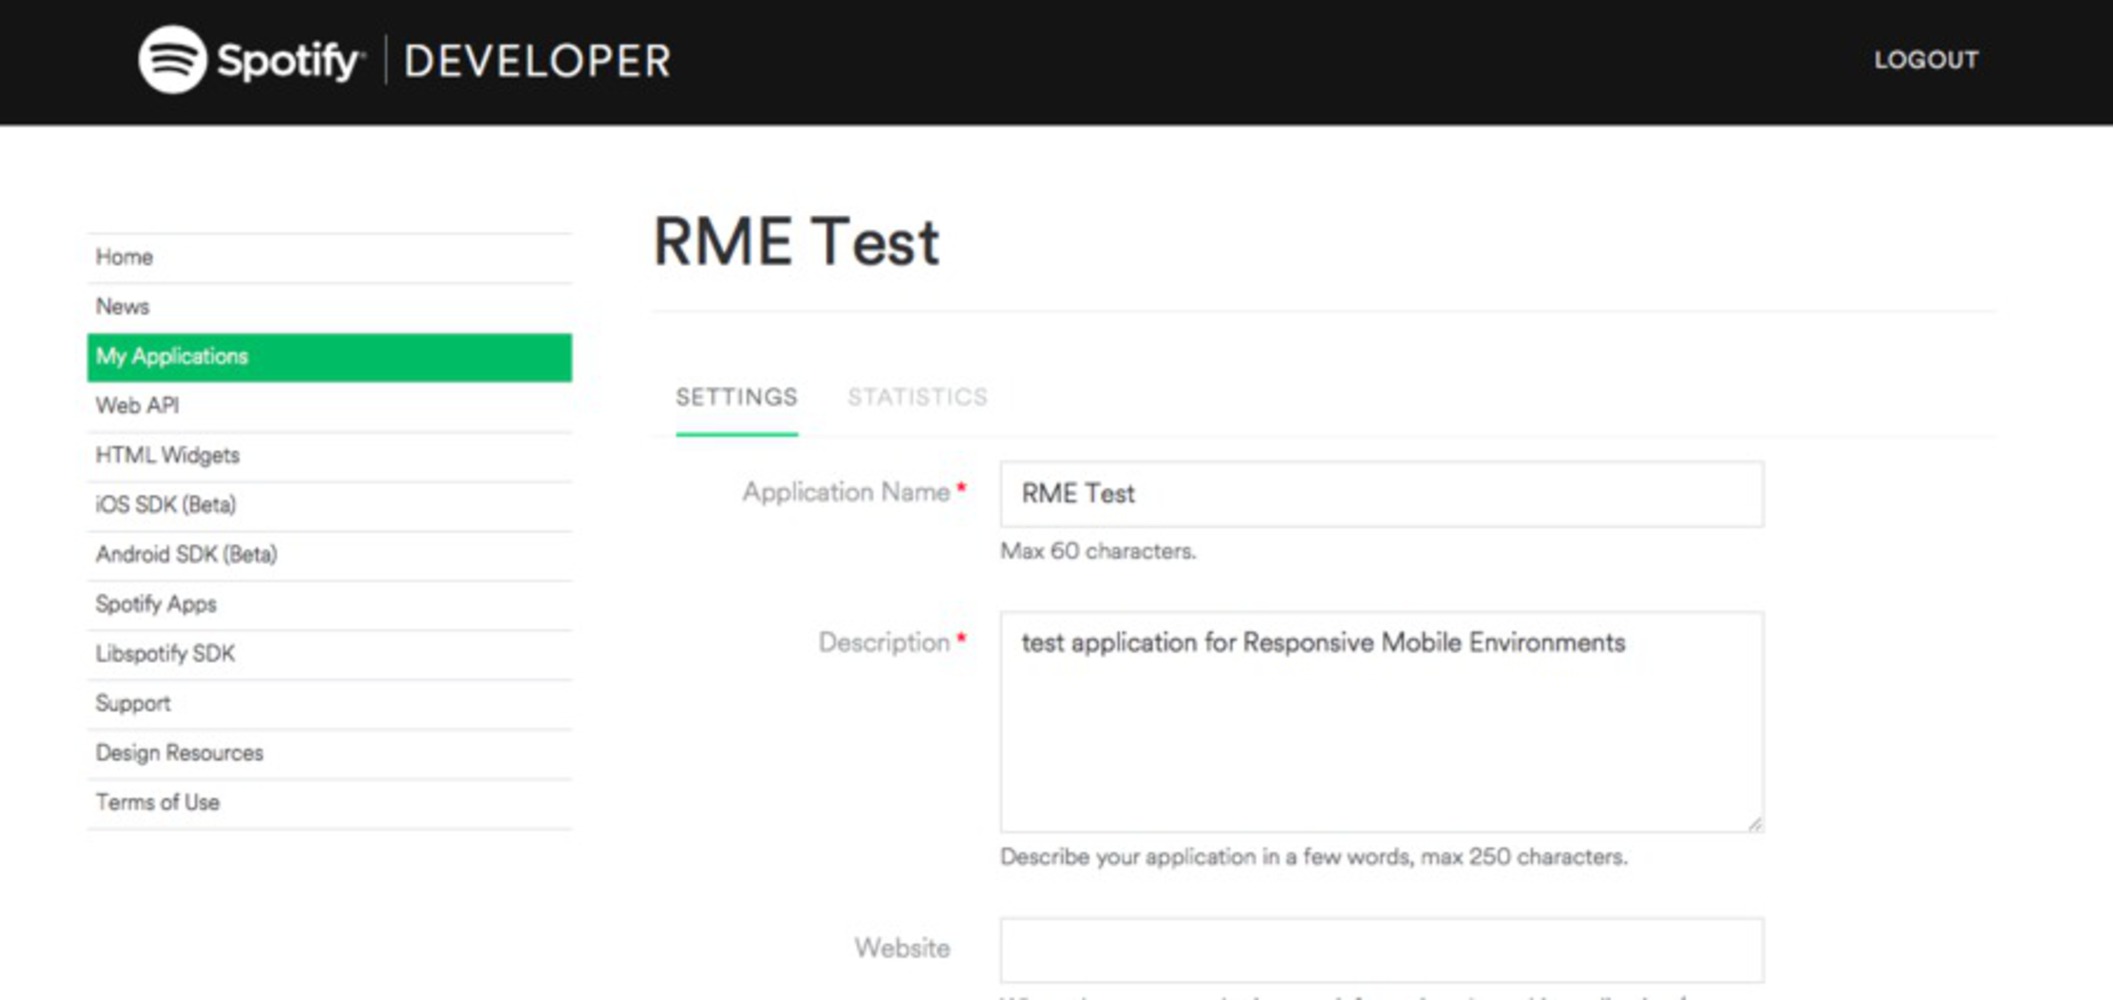
- Spotify API 

- JSON data of my most listened to Artists and Track names. 

- Processing sketch imports this JSON data

- Processing draws a visual representation of this data. 

 The first step was to get started playing around with the Spotify API and linking it to my account. I had to download a program called Node.js and access the Spotify data through the local server. I found this initially quite confusing as I am not very experienced using the Terminal.

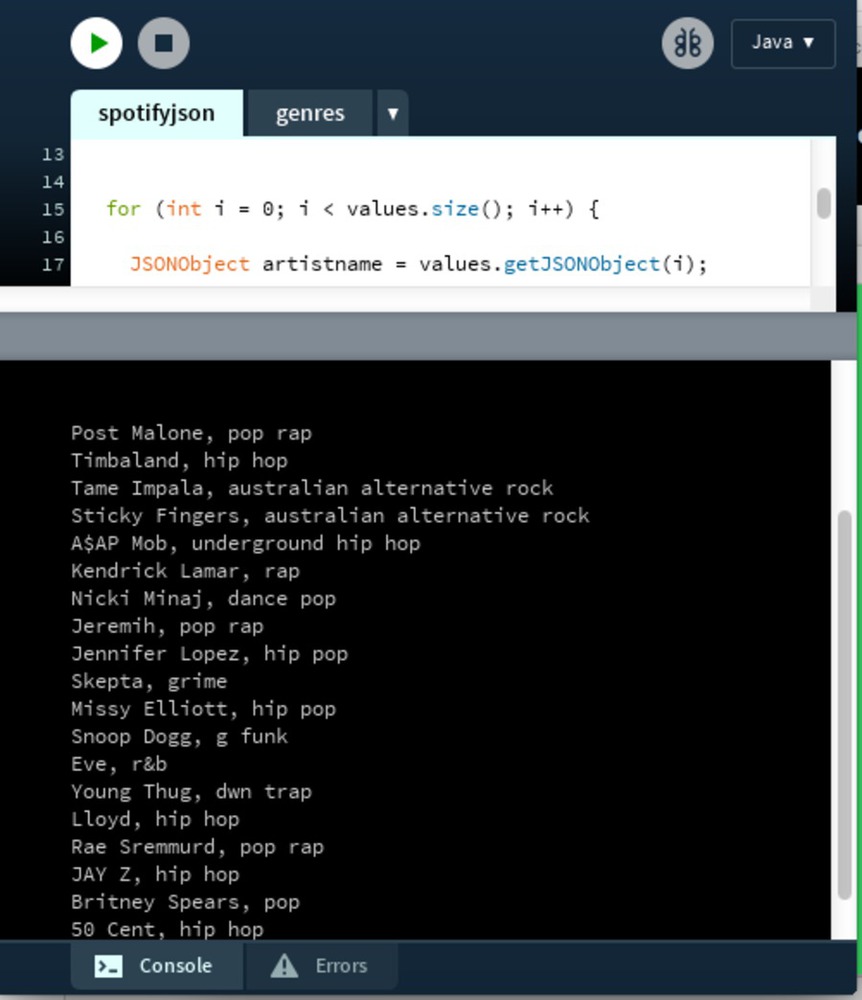
 I eventually managed to request my top played tracks I had listened to and gathering the data associated with them. However, I then realised that it would be very hard to visualise this with the track names as data because each name is different and I would be able to assign variables to each. I then decided to get the Artist information about my top tracks which provided the genre associated with each artist. This information was in JSON format that I downloaded to my text editor. 

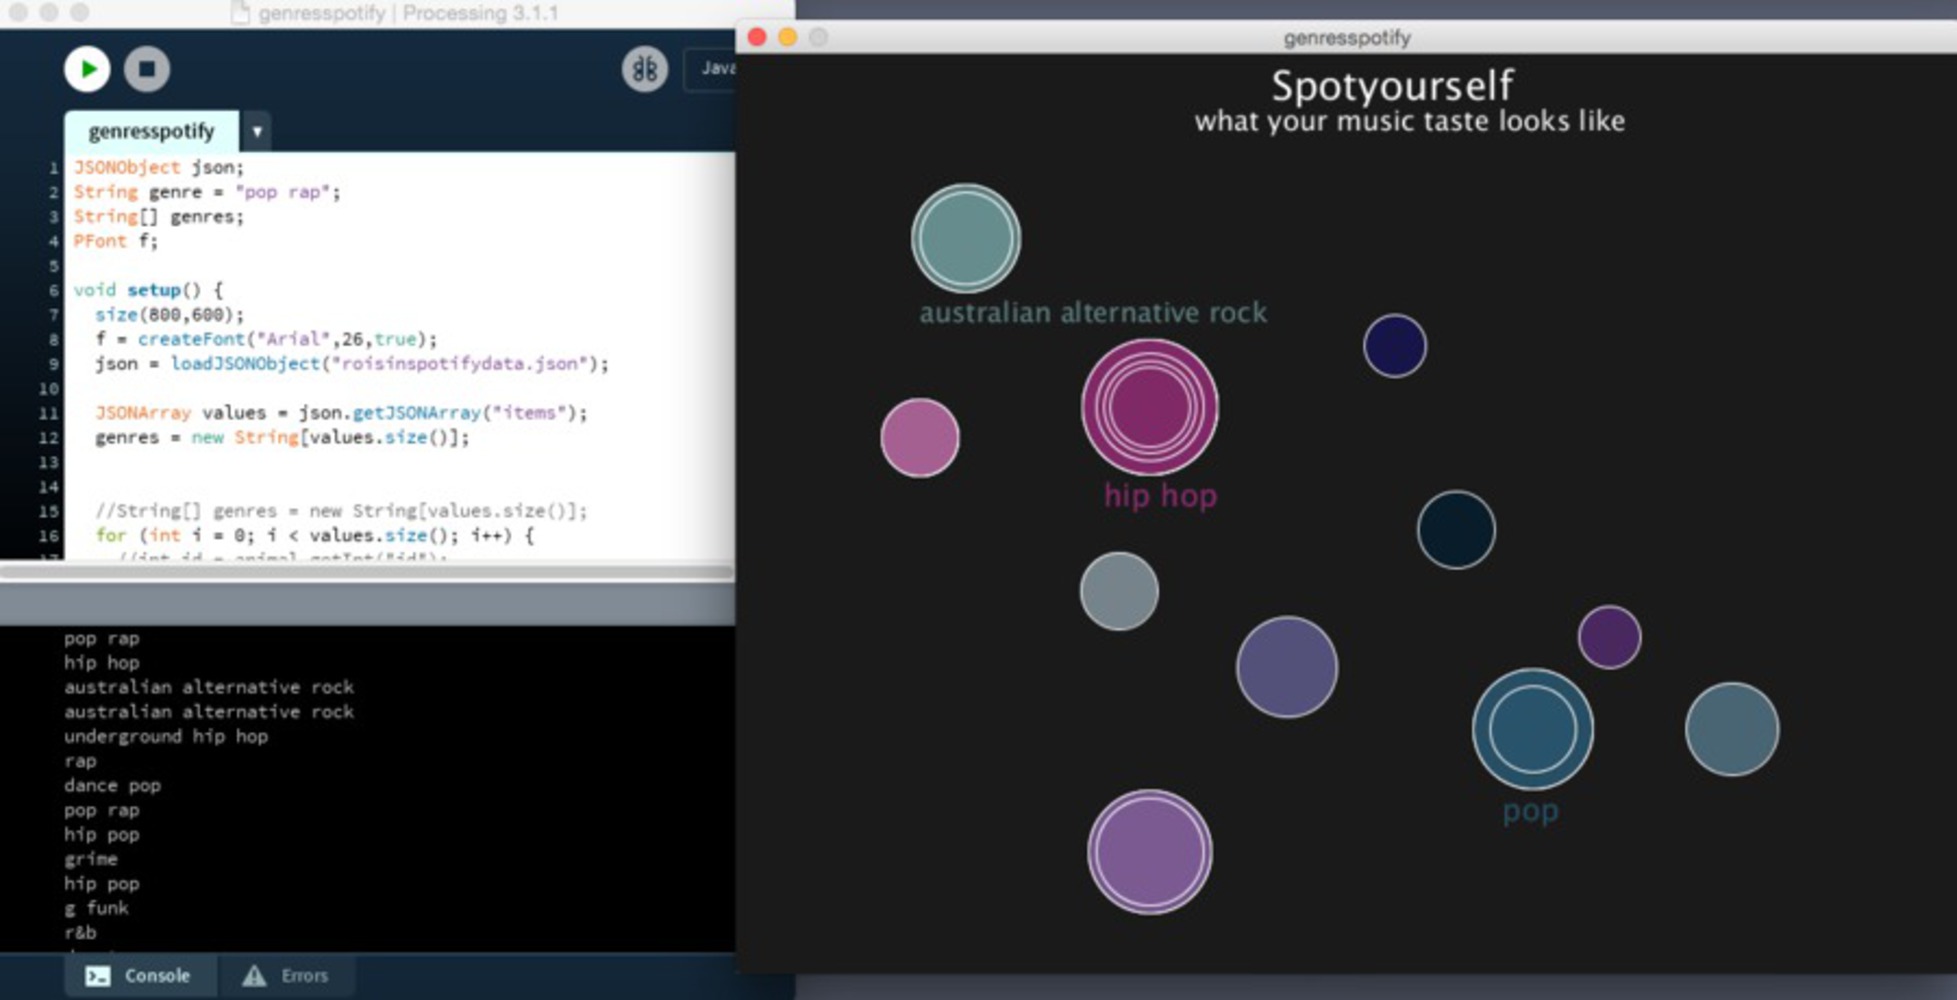
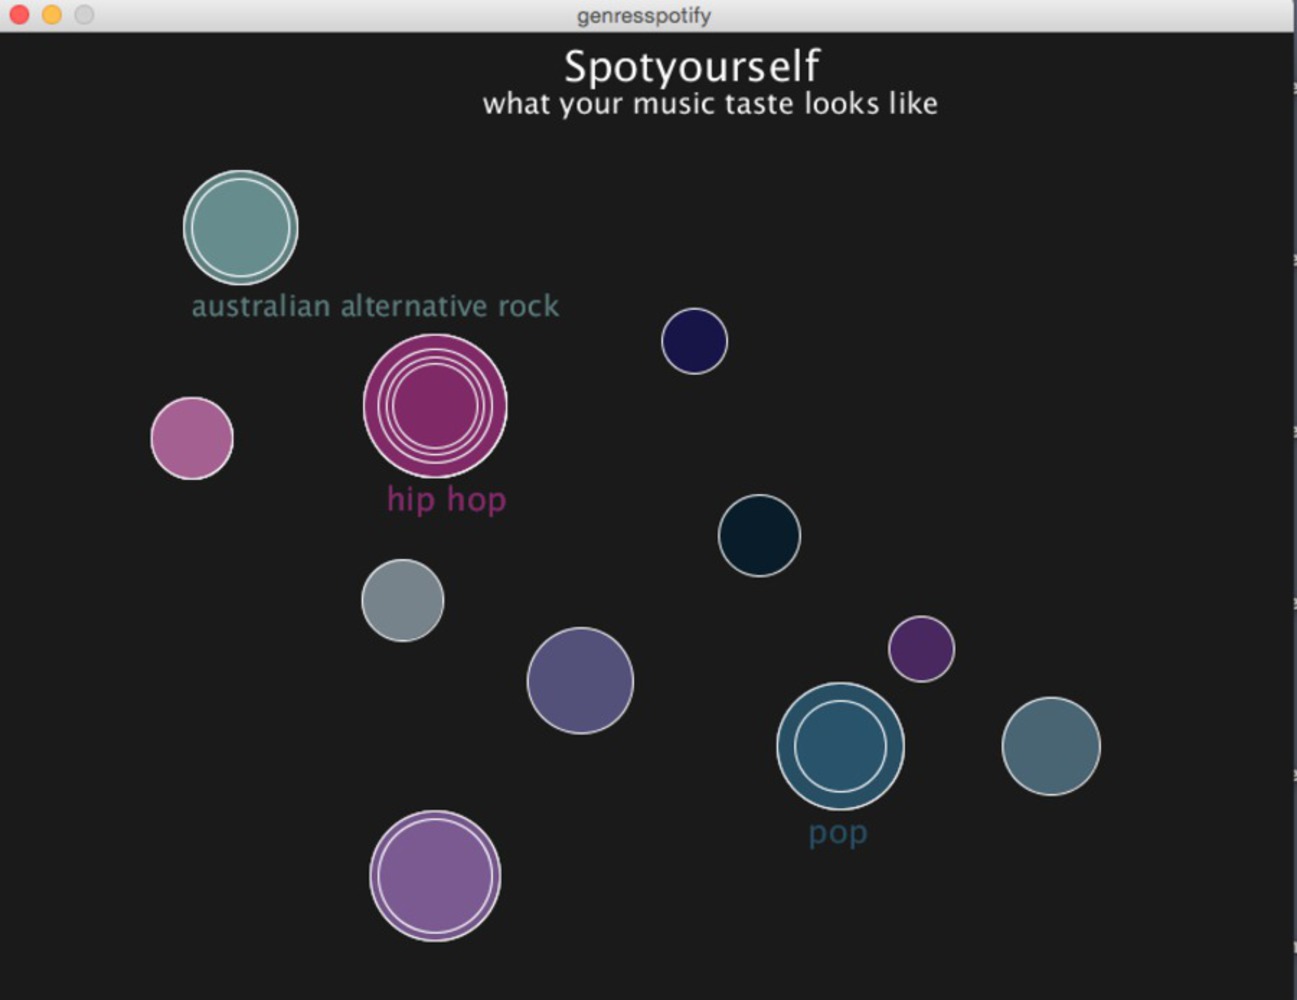
The next step was to import this code into processing. I added the JSON file into the processing file and made a call to extract the genre data. I then added a function that drew a circle and coloured it based on the genre that it was. Genres that were mentioned more than once were larger due to having overlapping circles. It was then relatively easy to see what genres I listen to the most, which was Hip Hop and Australian alternative rock.  

Precedents

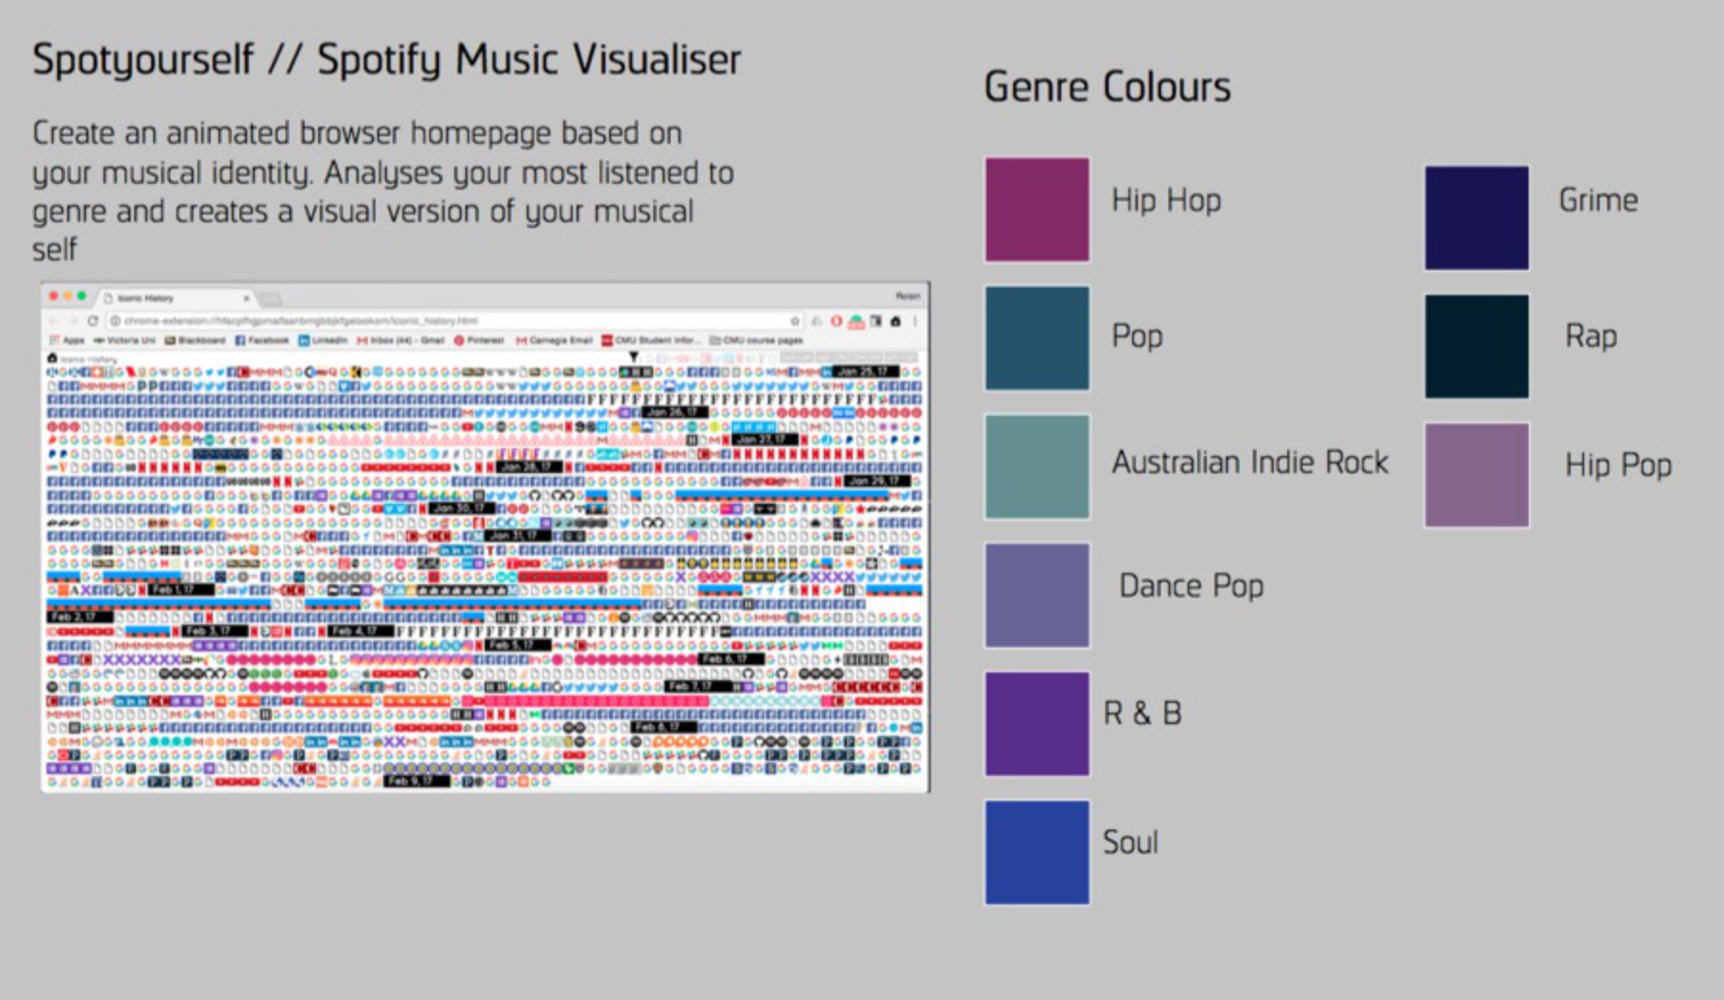
I was inspired to create Spotyourself as I wanted to create a technical project to improve my coding skills. I am very interesting in ways in which we can visualise ourselves in the our everyday lives and creating art out of different types of data, a musical data selfie. 

I was inspired by the browser history Chrome extension available at https://chrome.google.com/webstore/detail/iconic-history/hfacpfhgpmaifaanbmgbbjkfgelookom?hl=en  I like how this project conveyed an overview of that persons browsing habits over the past months and days. I was inspired to also create a visual overview for the user where they can reflect on their habits and themselves, to encourage memory. I also drew a lot of inspiration from http://dataphys.org/list/ and the way in which they displayed data. I originally thought about just creating a physical sculpture from the Spotify data but then decided I wanted to refresh my coding abilities and try make it web based!


Screen shot 2017 02 10 at 12.00.44 am.thumb
Show Advanced Options

Process

My initial idea for this project was to create a data selfie based on your online activity, I wanted users to visualize how they used the internet. However I was stuck on what data to gather on this and how I would gather it. I then decided to implement the use of an API to gather data which brought about the idea of using Spotify as it has many available functions and was classed as relatively easy to work with. 

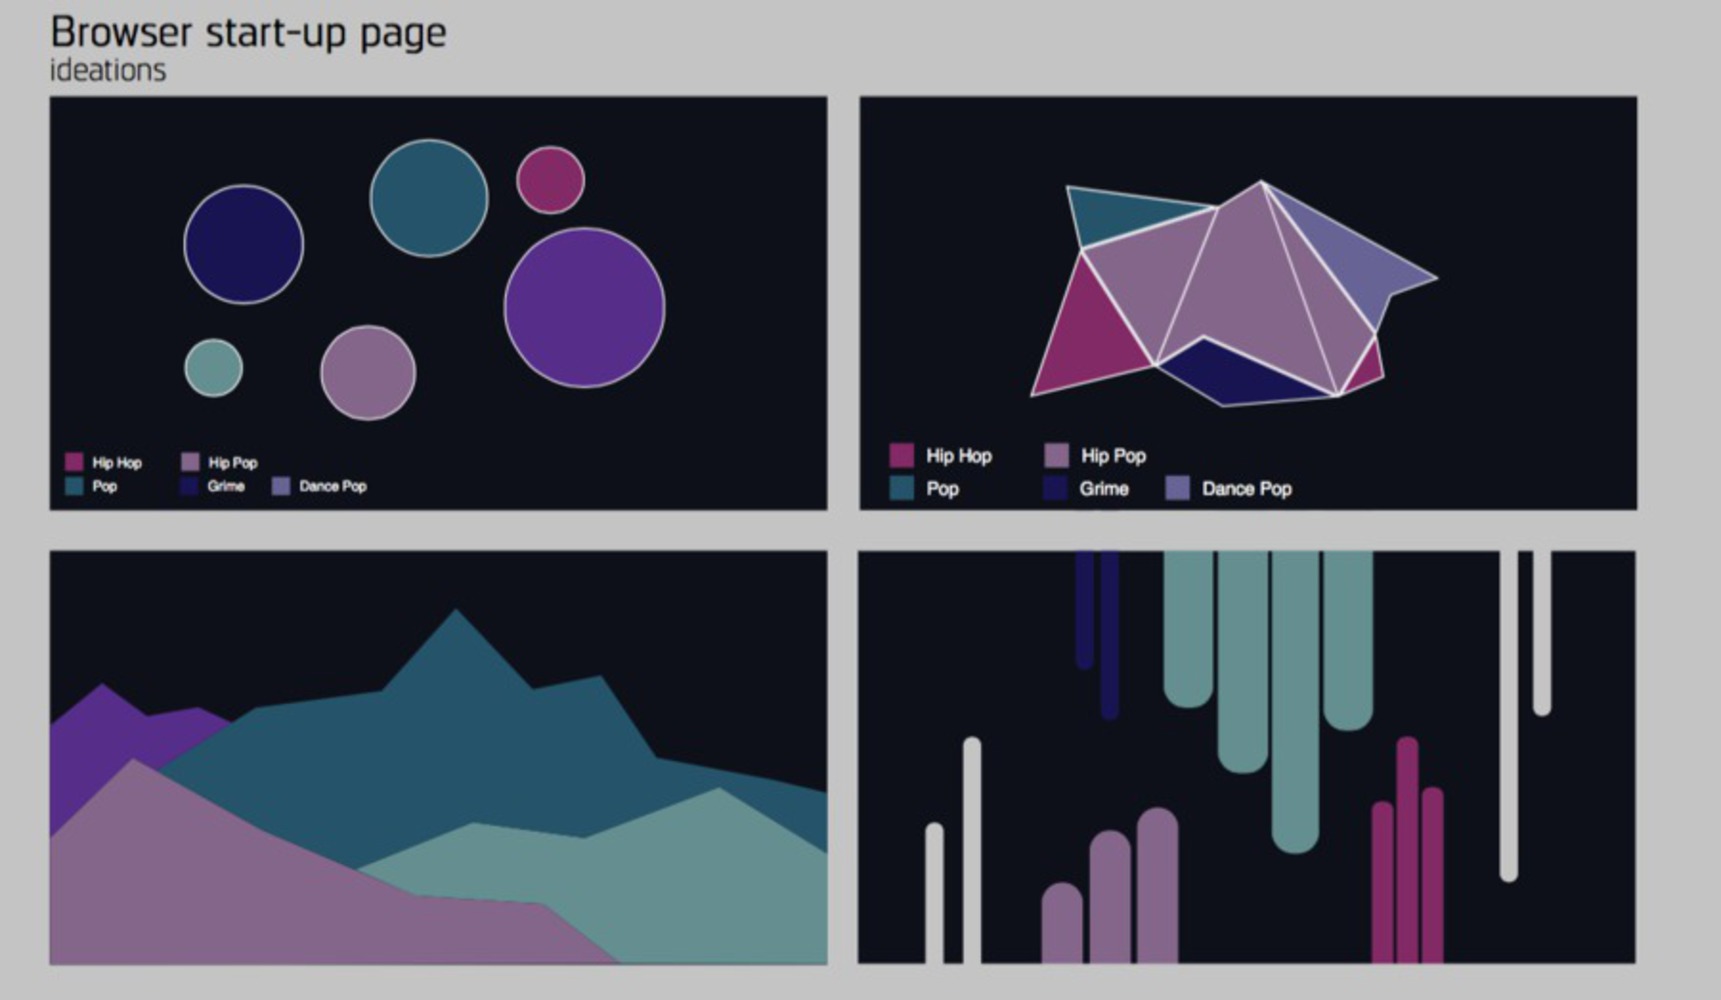
I planned out some draft visualization concepts shown below and then picked the idea that seemed most feasible by my coding abilities! 

For me, this project ran through a difficult process. The initial set up of the Spotify API wasn't too difficult and it was easy enough to get the JSON data parsing into processing. The real struggle came when I had to draw out the genre based circles. I had trouble figuring out how to draw a different circle for each genre as when I drew a circle from the genres string it would only draw one. I only managed to solve this problem due to some advice from people who actually knew some Java. 

Screen shot 2017 02 09 at 11.16.23 pm.thumb
Show Advanced Options
Screen shot 2017 02 09 at 11.16.52 pm.thumb
Show Advanced Options
Screen shot 2017 02 09 at 11.39.56 pm.thumb
Show Advanced Options
Screen shot 2017 02 09 at 11.31.21 pm.thumb
Show Advanced Options
Screen shot 2017 02 09 at 11.30.24 pm.thumb
Show Advanced Options

Open Questions and Challenges  


- How we can improve the way we view ourselves and the way that we remember who we are. By comparing our own musical visual identity to other peoples can we learn more about each other?

- What other kind of aids are there for reflecting back on our past through music? 

- Our memories make us who we are today. As cited in " Searching For Memory" we all want to know more about ourself and our identity. How can we further improve our knowledge of oneself through memory devices and the online activities. 

Reflection

Through researching processing 2+ I found out that there was another processing program called p5.js which uses javascript not java. I think if I was doing this project again I would use this program as I think javascript is easier to work with, as I have hardly used java before. It also would create the graphics in a web browser which I think would be a lot easier to showcase. I found a really good set of tutorials at https://www.youtube.com/user/shiffman/playlists for processing which will be useful considering it was so hard to find information on the website!

If I had the time I would have expanded this project to be displayed on the web and as a browser start up page. This is so that people could be continuously reminded of who they are and identify themselves with music. I also would have experienced with different graphical styles to visualize this data as well as animating the graphical elements on the page to move around and possibly be interactive. 

Show Advanced Options
Drop files here or click to select

You can upload files of up to 20MB using this form.