Goal:
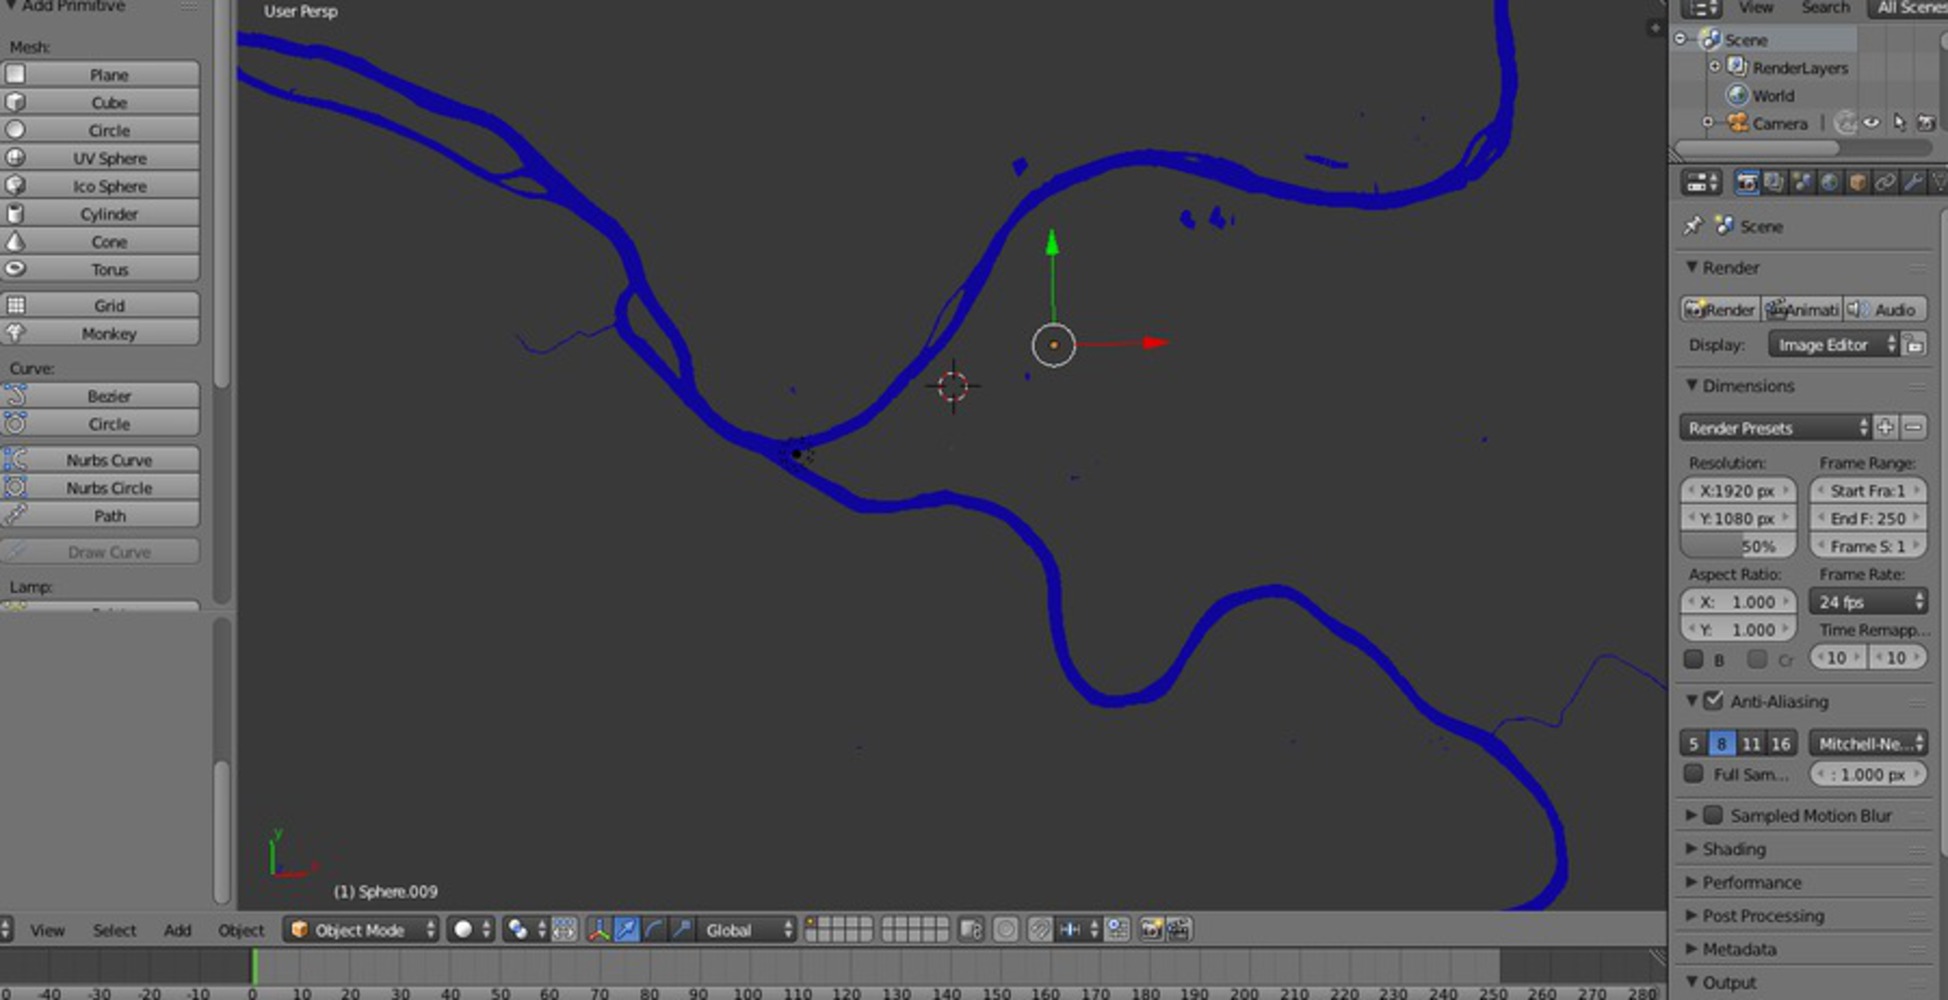
The goal of my project was to have a topographic map that depicted real estate values, making it easier to visualize data.
Process:
The process was long, and still I have not been able to accomplish the above goal completely.
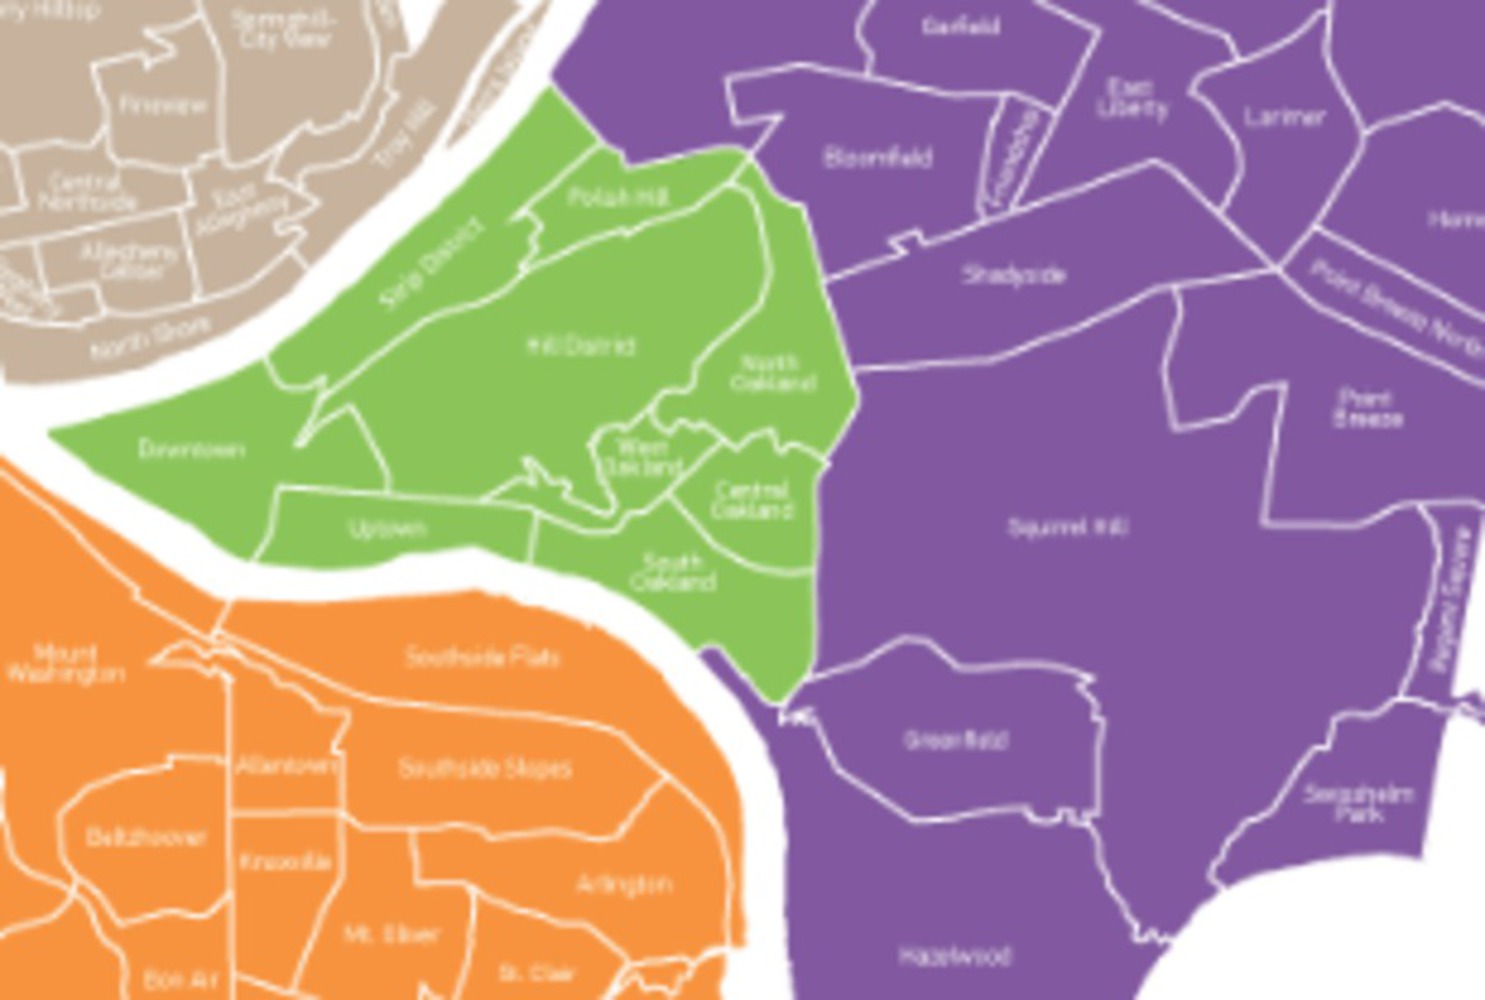
At first, the plan was to use Trulia's data and convert that into a topographic map. Trulia.com provided data for each region in Pittsburgh (Average of 4000 square feet^2) and even a map of the specified regions. Making that into a topographic map could have been done very easily using the smooth shader options on Blender which is why I decided to go the other more detailed route. I wanted to have a more accurate topographic map that wouldn't look blockish like Trulia using specific home prices rather than macro region ones.
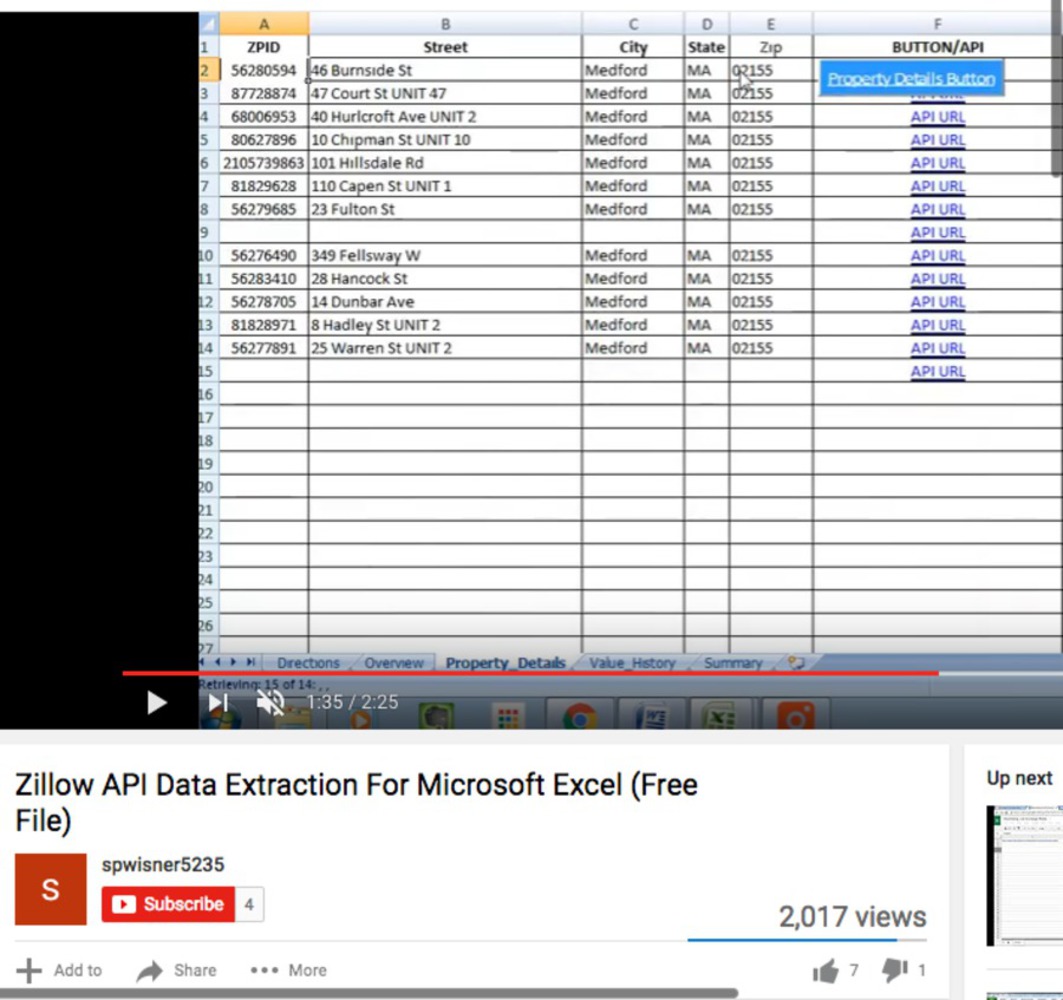
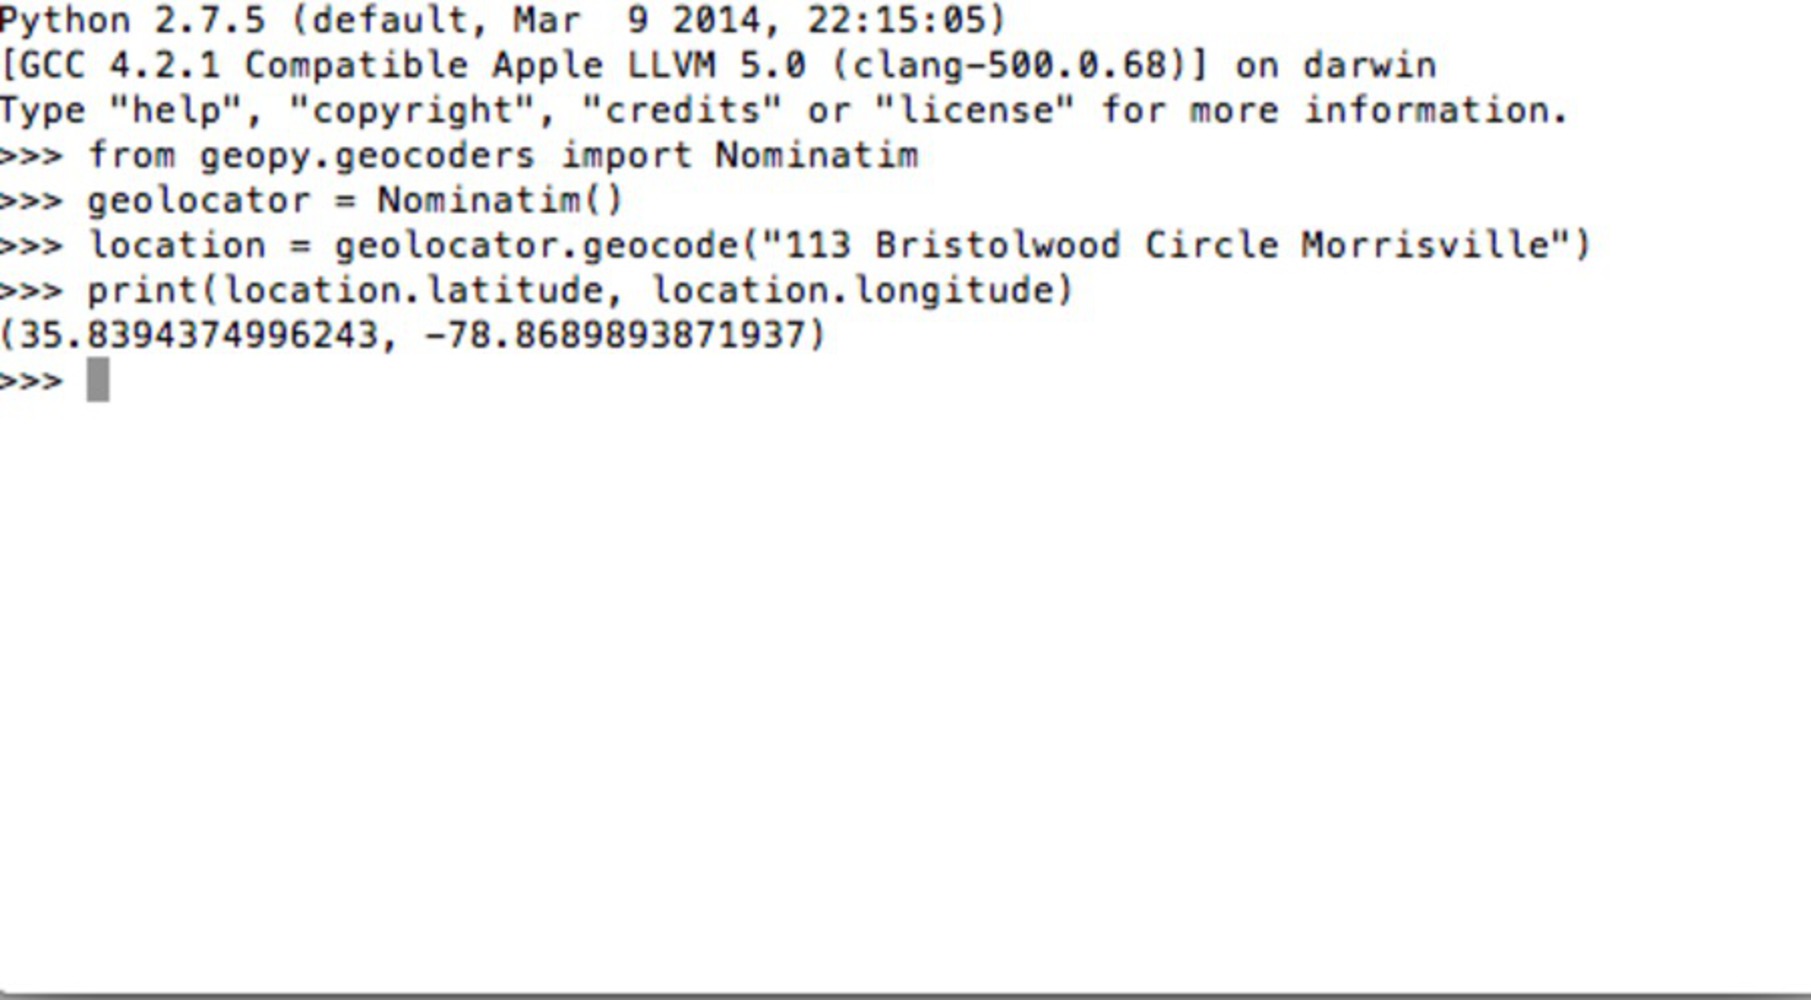
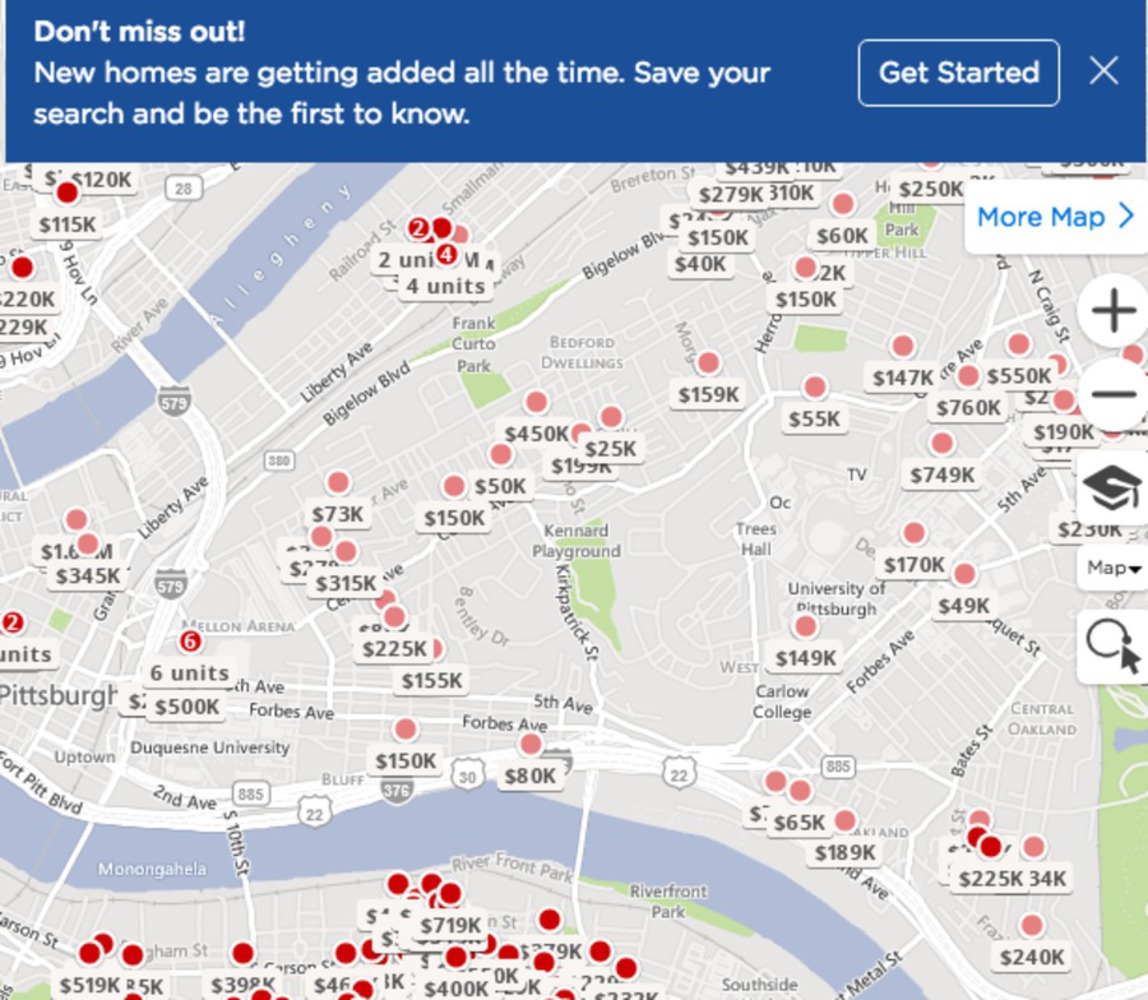
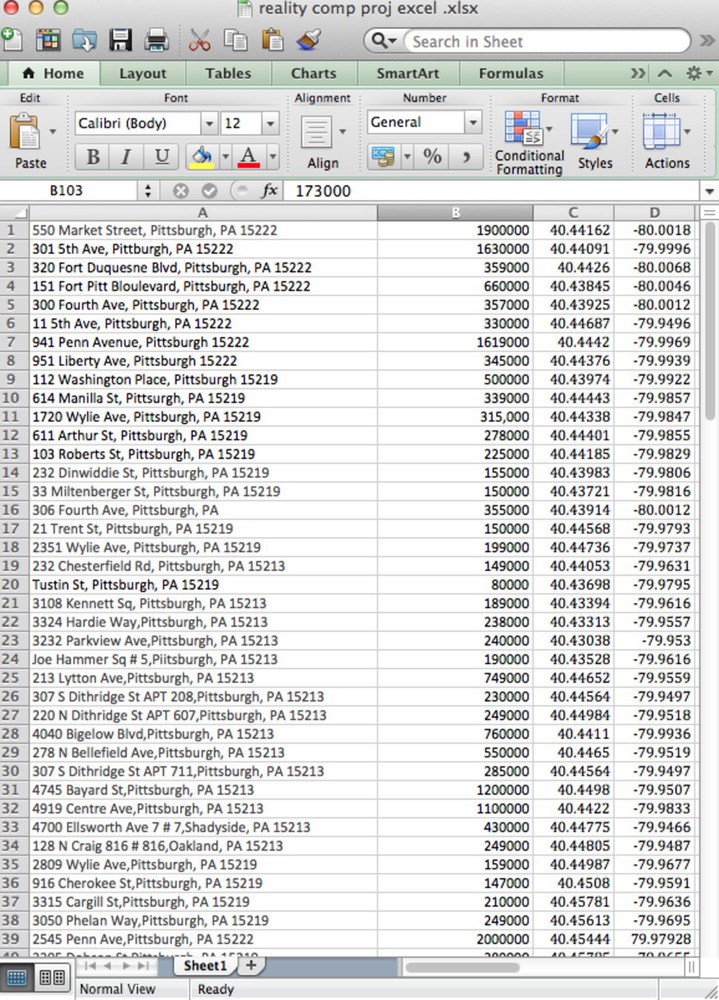
The plan was then to get the addresses of houses, pinpoint them using latitude and longitude coordinates and map them on Blender with their corresponding z-value which would correlate to the value of the real estate. I downloaded and ran the API I found on Youtube to mine and extract the Zillow data online. The problem with this API was that you had to manually put in the address and then the API ran, rather than it running for the geographical window that I had. The API tutorial is shown below. A lot of time was wasted in trying to get this API to work, as it also only worked on the Windows computer.
Google Maps, along with every other map provider I could find online, did not give a list of addresses within a region or even a street. There were online marketing companies that would sell that data, although the price was too high. I checked sanitation records, tax records, and other places online to see if there was a way to gather a list of addresses but there was none. None of Google's API's had that jurisdiction either so it looked like it would have to be done manually.
