Back to Parent

Outcome


Intention

The Summer Food Service Program (SFSP) is a national program of the USDA that provides FREE meals to kids during the summer months.  Summer Food Sites are the designated spots to distribute the free food. I would like to explore the distribution of the summer food sites and how they relate to the social context.

Collection

To further find out whether there is any correlation between the distribution and characters of the summer food sites with social context, I looked for the following datasets:

Allegheny County Summer Food Sites https://data.wprdc.org/dataset/allegheny-county-summer-food-sites1

This dataset has the open time of the food sites regarding breakfast and lunch. They are categorized by the school district.

Allegheny County School District Boundaries https://data.wprdc.org/dataset/allegheny-county-school-district-boundaries

Allegheny median household income http://www.city-data.com/forum/city-vs-city/2600986-cleveland-vs-pittsburgh-6.html


Capture.png.thumb
Show Advanced Options

Analysis

I categorized the open time of summer food sites in terms of open time and duration in order to understand how active they are and how much service period do they offer.

Open days.thumb
Show Advanced Options
Breakfast startime.thumb
Show Advanced Options
Breakfast duration.thumb
Show Advanced Options
Lunch startime.thumb
Show Advanced Options
Lunch durarion.thumb
Show Advanced Options

Product

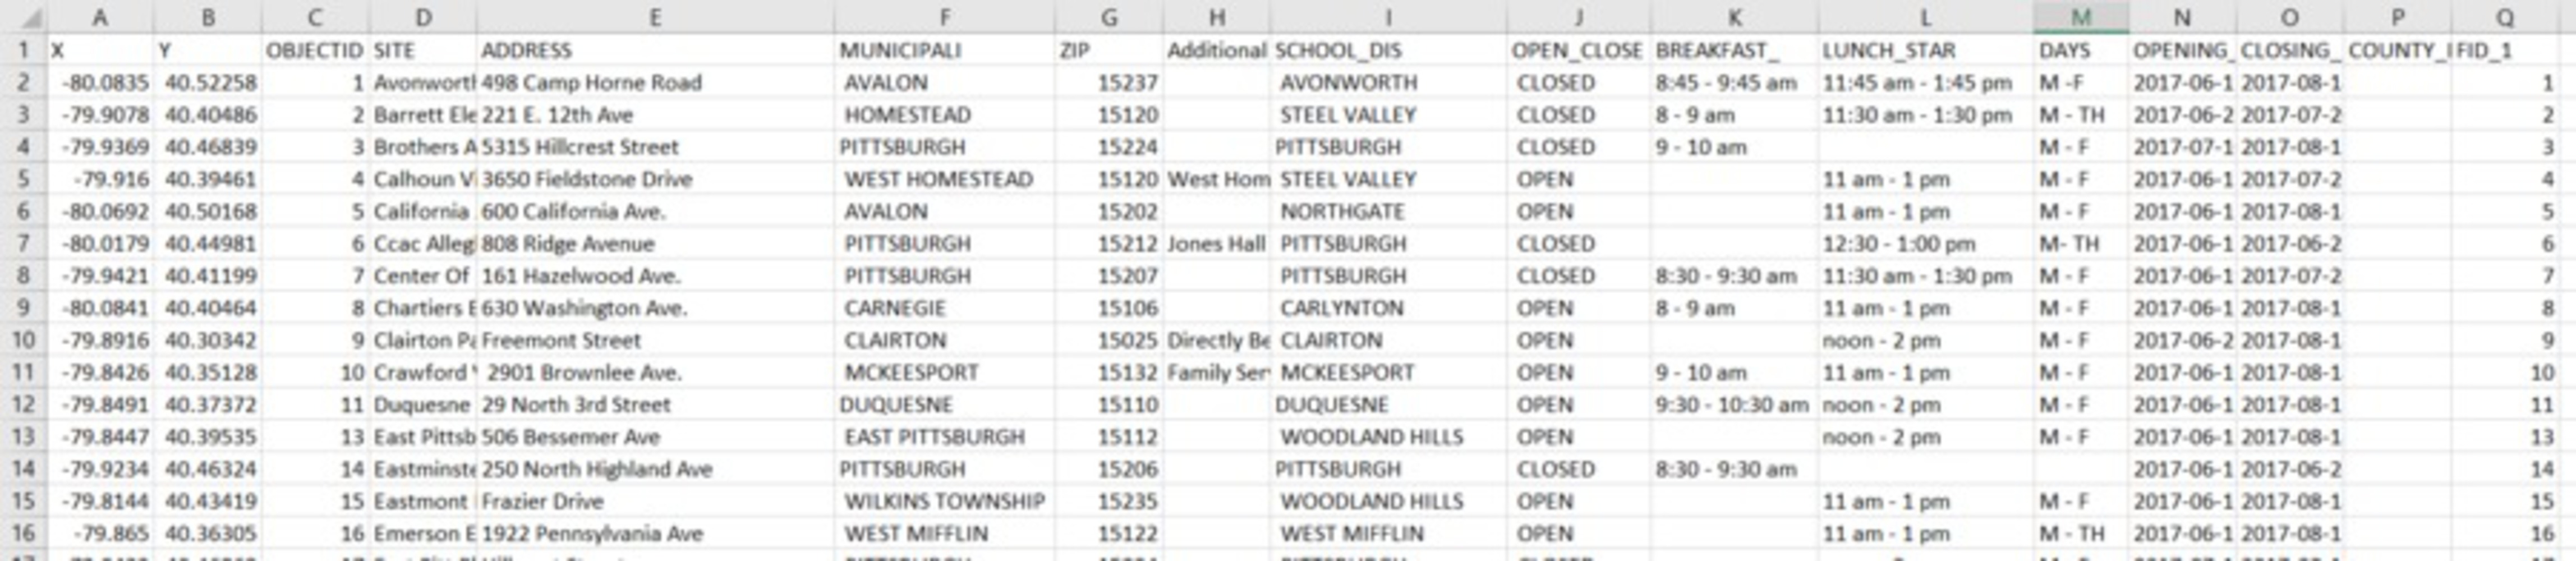
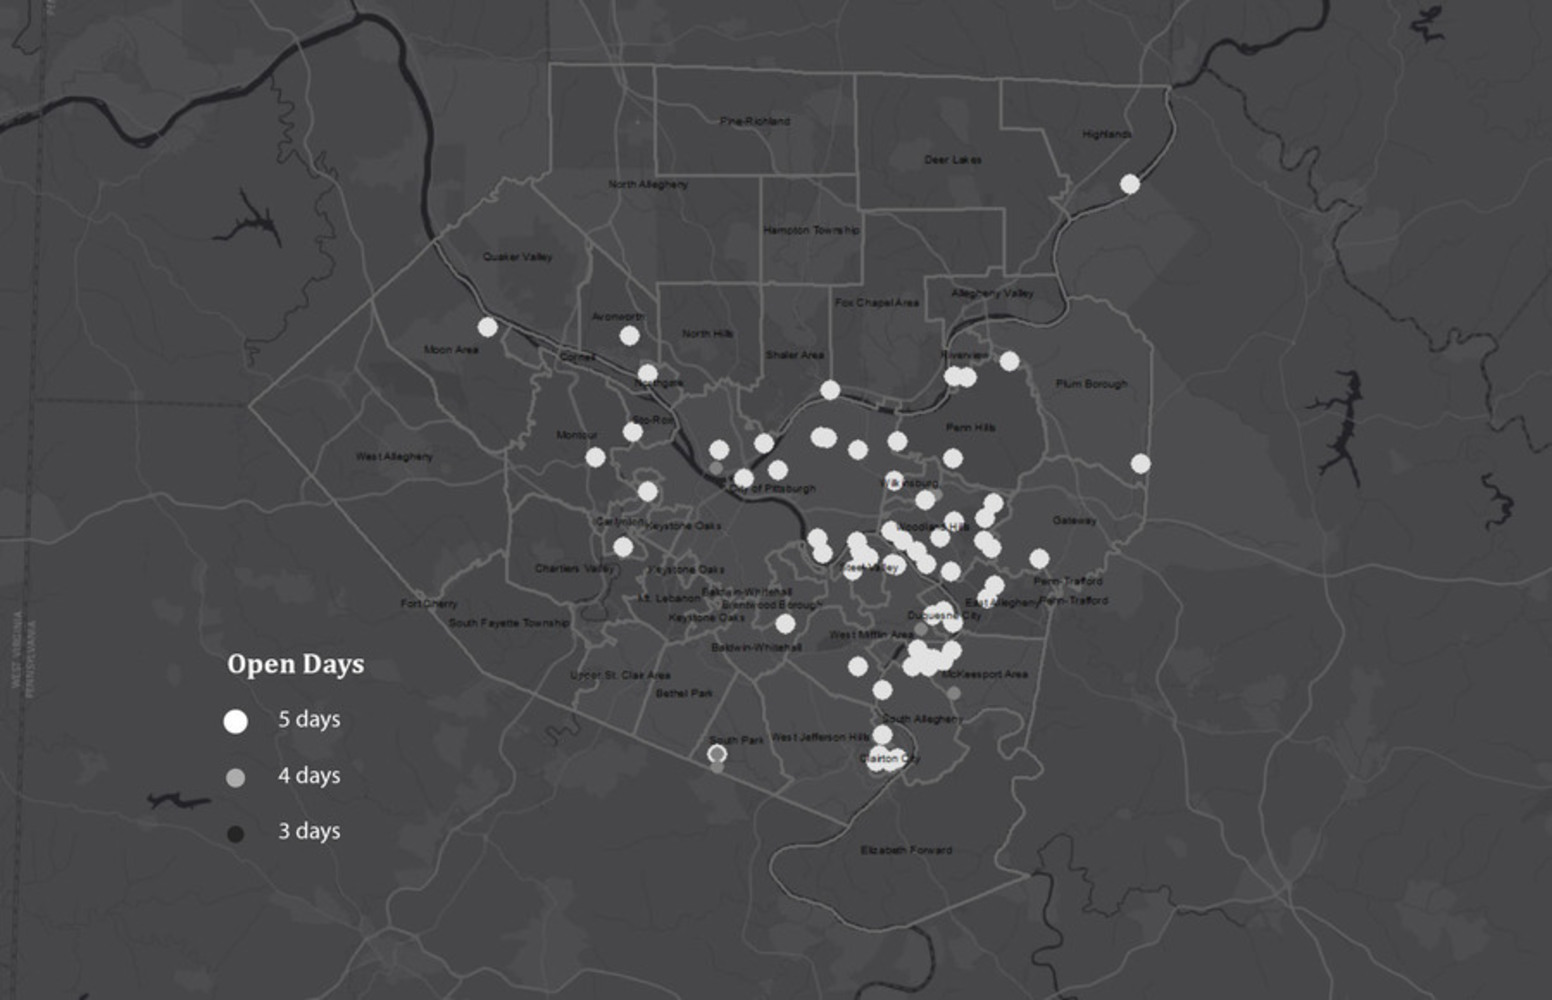
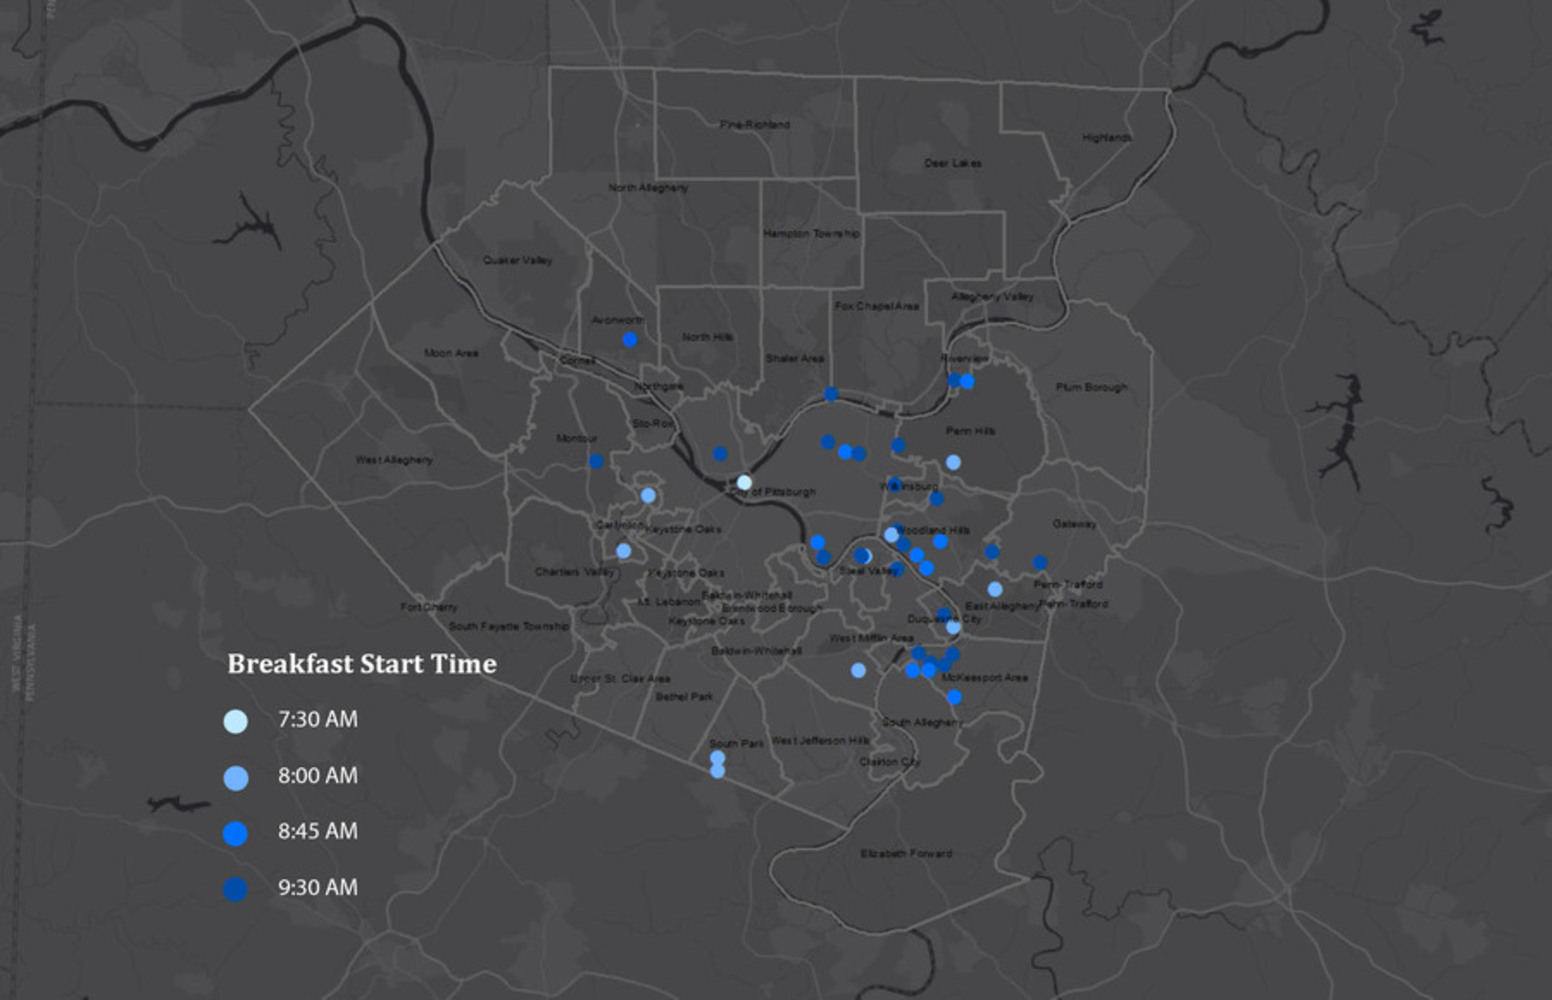
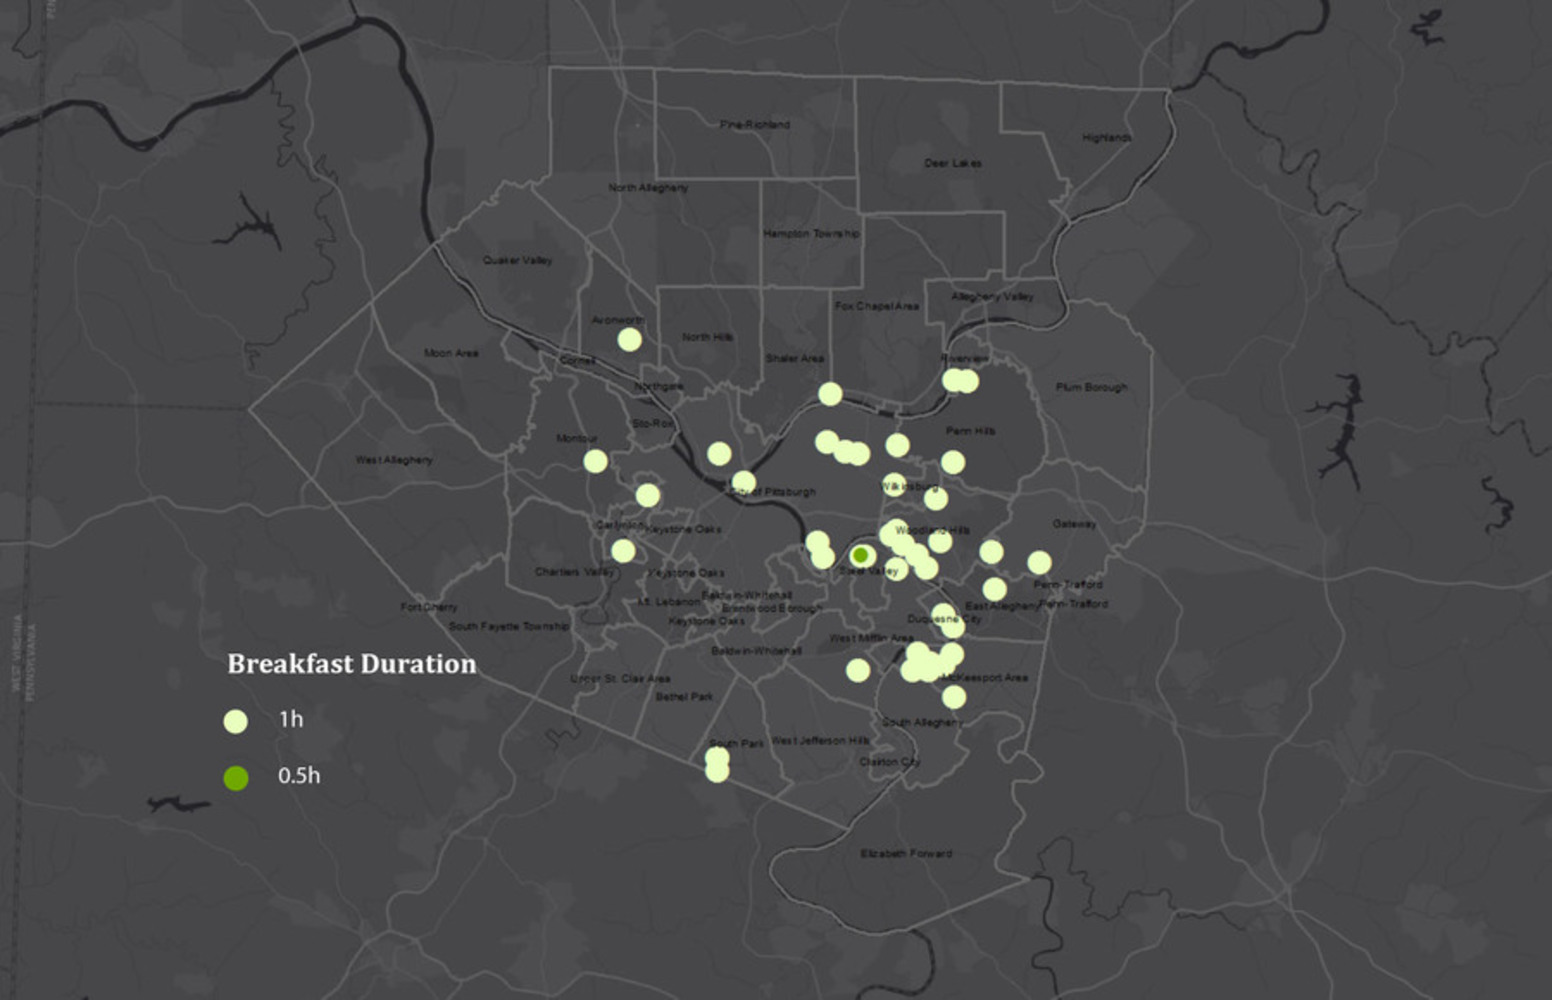
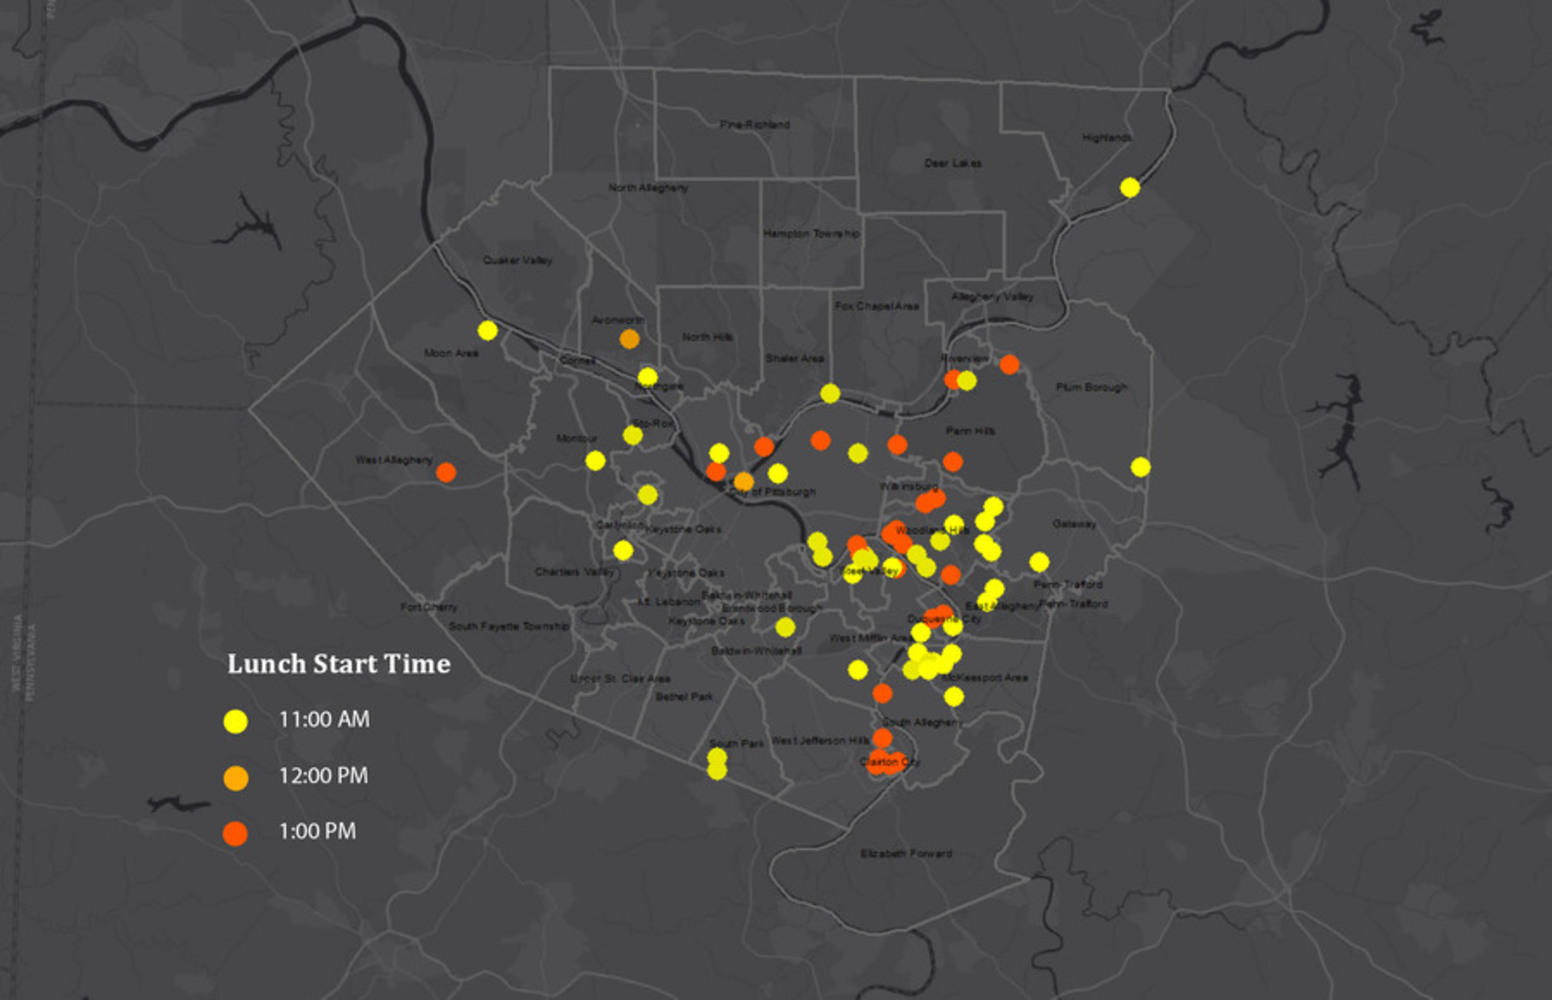
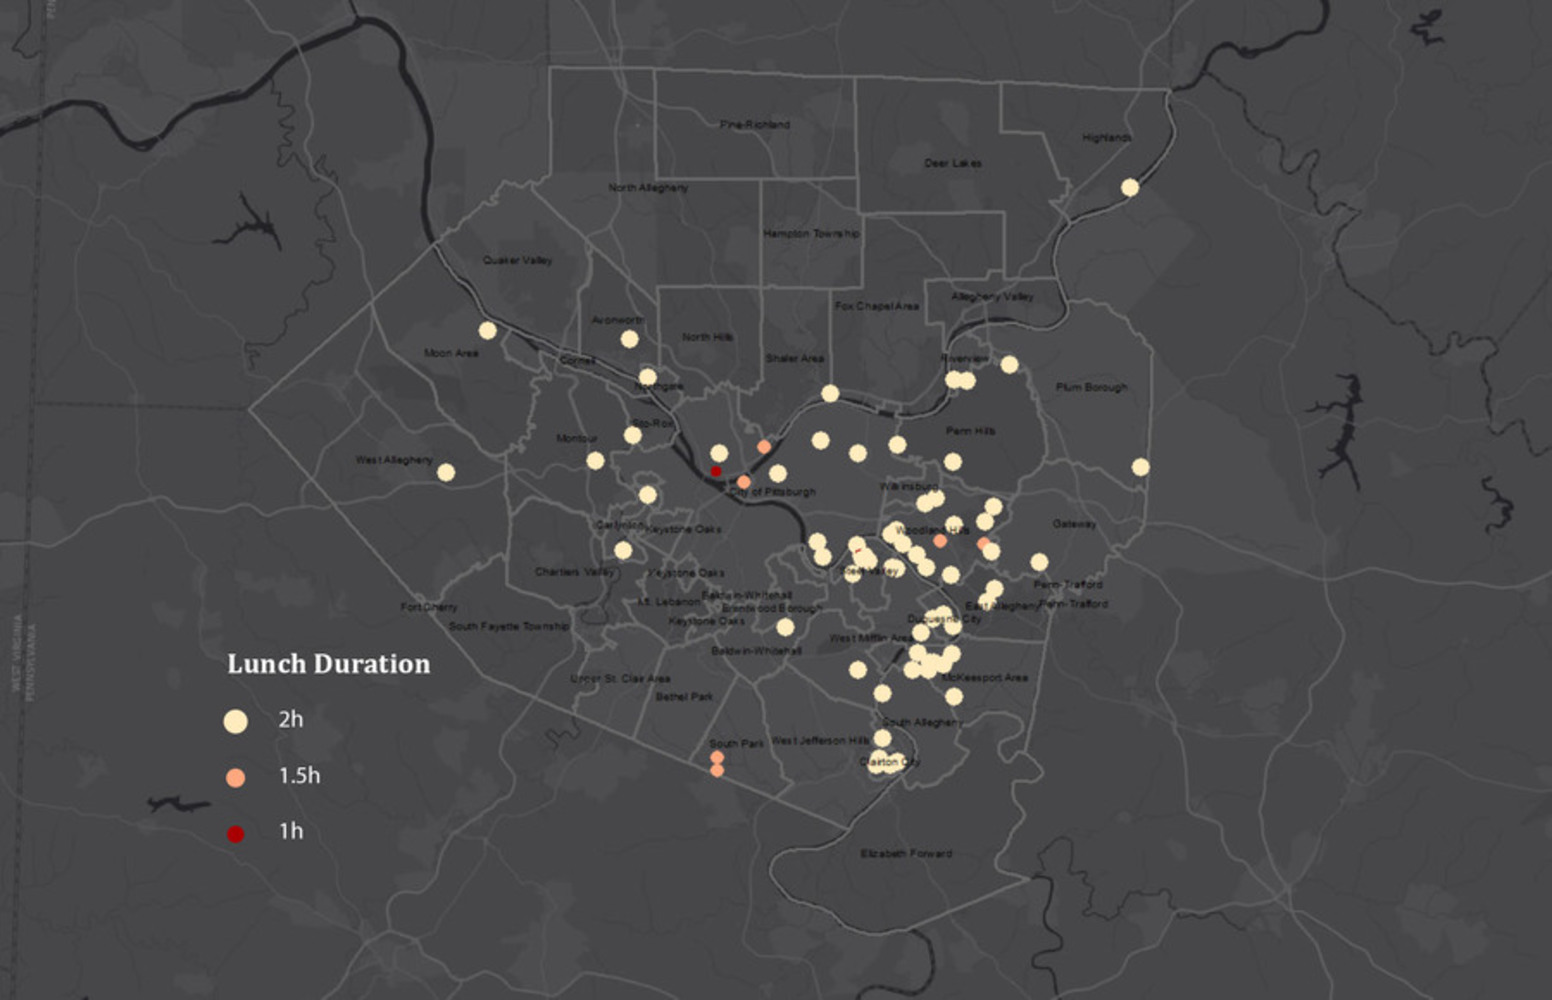
After the basic analysis of the datasets of summer food sites from ArcGIS, I would like to have an overall understanding of the level of activity of the food sites and how does this involvement correlate to the social and economic context. To achieve this goal, I overlapped the factors which will contribute to the activity level in gradient in Photoshop. For instance, the earlier it opens and the longer it lasts, the brighter it will be. 

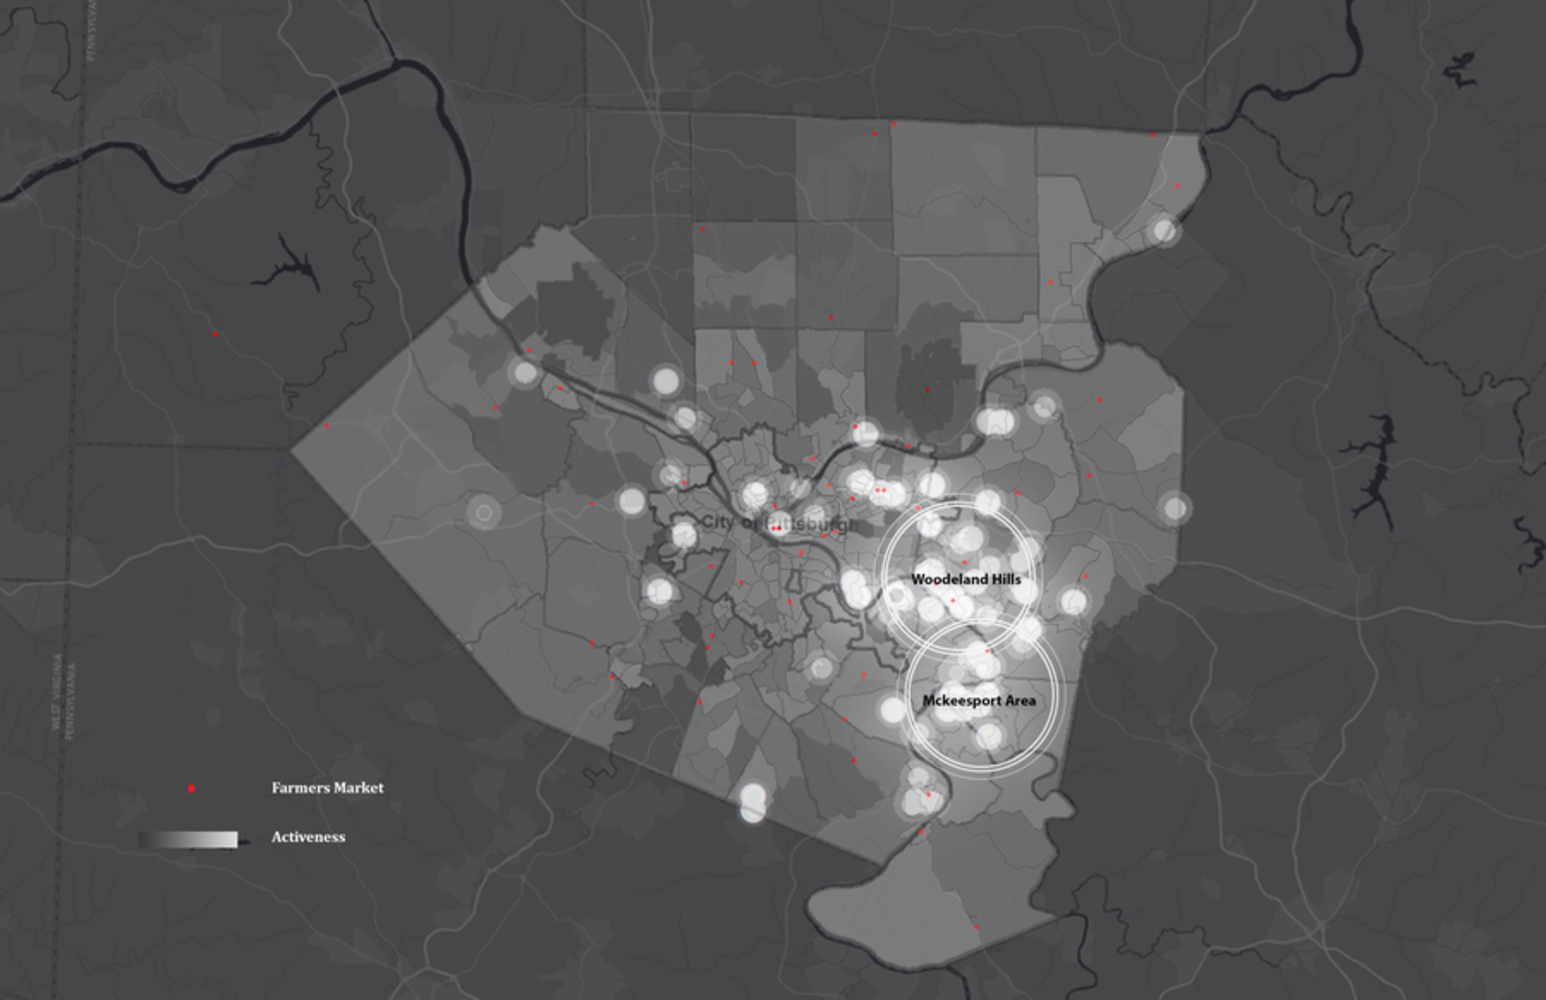
And then I overlapped the synthesis map together with Allegheny Median Household Income(the brighter the block means the median household income is lower) and school districts.  It is interesting to find that the summer food sites congregate in Woodland Hills and Mckeesport Area. And these two school districts are in the area where the median household income is relatively low.

I think the low household income will initiate the need for summer food sites and the active involvement of schools, churches and organizations will contribute to the high activeness of the summer food sites.

111.thumb
Show Advanced Options

Reflection

After doing this project, I realized that only under the circumstance I fully understand the datasets, can I further interpret them and translate into my own language. However, I still feel it is very hard to draw a clear and rational line between accuracy and representation. Just as compared to the final synthesis, my fundamental analysis is more accurate. They provided me the ground for analysis. And it was at that time, I somehow realized there is a congregation in terms of geographical distribution, then I wondered how it is correlated with social context. Then after I fully understand the food sites are more aggregated at areas with low median income and mainly focused in two school districts, I decided to exaggerate the expressiveness of this certain area. Meanwhile, I also kept a certain accuracy of each layer of data, but by using the methods of overlapping to emphasize the overall idea.

Drop files here or click to select

You can upload files of up to 20MB using this form.