Back to Parent

Outcome


Intention

Shadyside is an historically wealthy neighborhood with interesting mix of social groups live in and around the neighborhood, including students, scholars and high net worth people living in the neighborhood. Based on the preliminary work on bicycle crashes from 2004 to 2015, the visualization work shows a concentration of bicycle crashes in and around the neighborhood. It would be an interesting area to further look into the data as the area closes to large regional employment centers, different types of bike commuting activities would generate along certain streets. The story reflected by visualized data could be used to help improve the bike commuting or leisure use infrastructure.

Collection

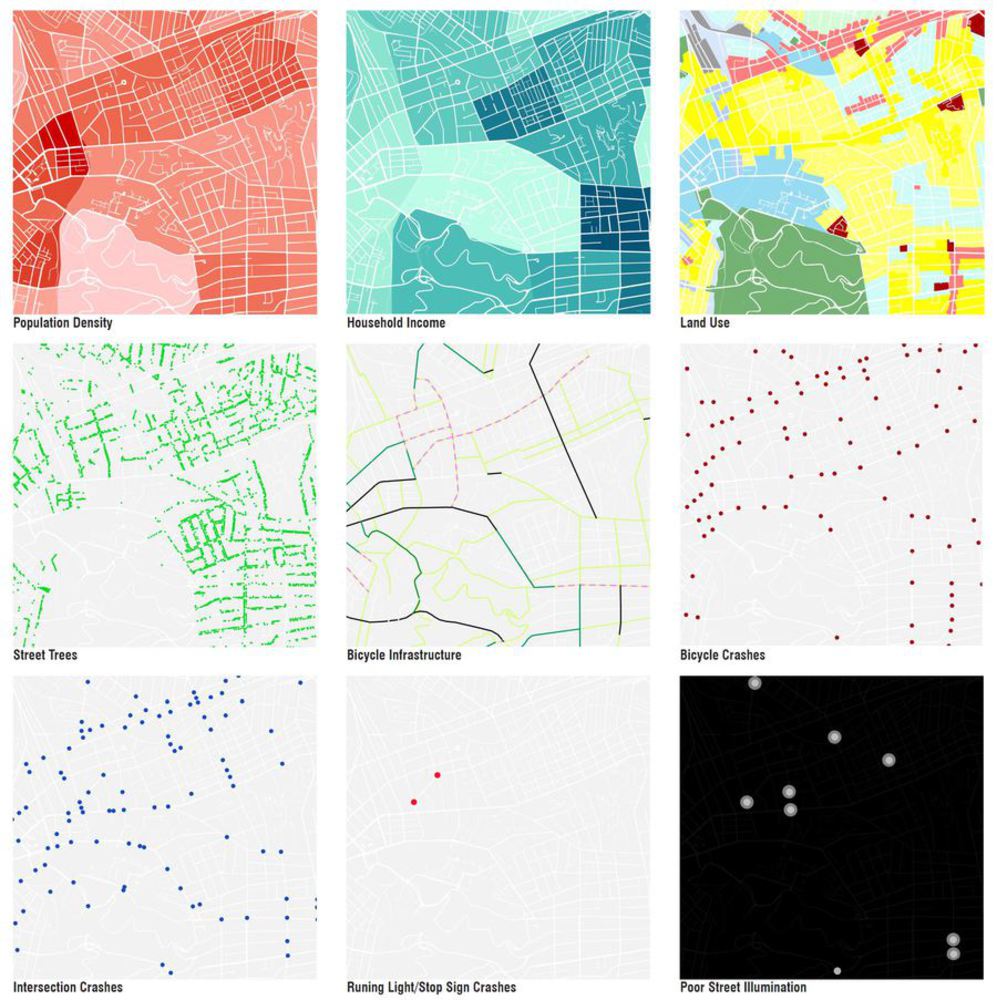
1) Population Density: To indicate the possible intensity of activities in and around the neighborhood by population density, which may also indicate a potential cycling population.

Source: American Census Survey, American Factfinder, Population by Census Tracts, Pittsburgh Metro Area, 2015, 5-year estimate.

2) Traffic Signal Controlled Intersection: To reflect the urban traffic control infrastructure at intersection.

Source: SWPRDC, Pittsburgh Traffic Signals, link: https://data.wprdc.org/dataset/pittsburgh-traffic-signals

3) Household Income by Census Tract: To indicate the demographic of potential cycling population, although not knowing where cyclists come from and go, it still give a sense the crashes happen in what type of neighborhoods.

Source: American Census Survey, American Factfinder, Estimated Household and Family Income by Census Tracts, Pittsburgh Metro Area, 2015, 5-year estimate.

4) Pittsburgh Street Tress: To explore if any correlation between street scape and crashes location.

Source: SWPRDC, Pittsburgh City Tree Inventory, link: https://data.wprdc.org/dataset/pittsburgh-city-trees

5) Bicycle crash data,

Source: SWPRDC, Allegheny County Crash Data, link: https://data.wprdc.org/dataset/allegheny-county-crash-data

6) Bicycle Infrastructure Suitability: The map data was record by physical improvement of bicycle infrastructure and cyclists’ perception regarding the cycling safety on certain street. It could indicate the street condition regarding cycling safety, and show whether there is a correlation with crashes.

Source: BikePGH & Lu Zhu, link: https://data.wprdc.org/dataset/allegheny-county-crash-data

7) Land Use: To explore the location relationship between land use type and bicycle crashes.

Source: Pennsylvania Spatial Data Access, http://www.pasda.psu.edu/

Codes Used

The majority of data processing, including density calculation, data filtering and sorting, etc., was done in ArcMap through attribute table manipulation. There are limited coding data filtering process involved, except sorting out necessary data columns for exporting to csv file format purposes. The general code for extracting household income and order them by ascending order include following:

Select household_income/hc01_est_vs13

From ACS_10_5year_S1901Simplified

Order By household_income/HC01_EST_VS13 ASC

However, excel might be easier to do this part of work.

Analysis

1. Downloading dataset, including household income data, population data from American Census Survey (American Factfinder); downloading dataset, including Pittsburgh street trees, Allegheny County crash data, controlled intersection data, from SWPRDC; downloading bike infrastructure data from BikePGH.

2. Loading population data into ArcMap, and using population data of each census tract to be divided by sq.mi. to get population density for each census tract.

3. Loading household income data to ArcMap or Carto to filter out the household income column, and visualizing the income data by amount, the darker green areas has higher income.

4. Loading land use shapefile to ArcMap or Carto (zipped), and visualizing land uses by different colors.

5. Loading street tree data into ArcMap or Carto, and visualizing the data by longitude and altitude data.

6. Loading bicycle infrastructure data into ArcMap.

7. Loading crash data into ArcMap, filtering out all bicyclist involved crashes. Then visualizing it by longitude and altitude data.

8. Filtering out all intersection related crashes, and exporting it as a new layer.

9. Filtering out all running light/stop sign related crashes from bicycle crash master sheet, and exporting as a new layer.

10. Filtering out all bad street illumination related crashes from bicycle crash master sheet, and exporting as a new layer.

Capture.jpg.thumb
Show Advanced Options

Reflection

I. Lessons Learned

Regarding using SQL to help filtering data, I think coding is definitely a lot of fun, however, it took some time to make things/codes right. I’m more comfortable of using ArcGIS, so the majority of heavy load was done in ArcGIS. However, there are not too many challenges encountered, most of the data processing is very straight forward, just a little time consuming.

Selecting the datasets to reflect correlation of urban environment and other urban data was a little difficult, and how to forming a story line to tell, because cyclists were moving on their routes, it was difficult to interpret their demographic and relationship to cycling route settings. I selected income was to show the possible neighborhood maintenance, such as street pave, signage, landscape visibility (vision triangle of intersections), status, as in the perception, higher income neighborhood would have better public maintenance.

Also, after comparing street with crash locations, it seems better landscape could improve the cycling safety as lower crashes appear on the these better landscaped routes. It might because these trees could lower the traffic speed in the neighborhood compares to Baum and Center.

The majority of crashes happened in cautious routes which was highlighted in black, so the perception could also reflects the route safety.

II. Speculations

These comparison could help create a sense of different factor could contribute to bicycle crashes, and how could be improve, such as follows:

1. A large number of intersection crashes in the neighborhood, including total 125 crashes in and around Shadyside and 101 happened at intersections, indicates there should be certain improvement at these intersections, such as bicycle safety boxes or prioritized intersection signalization to help cyclists crossing.

2. Adding bike sharrows or bike lanes to certain streets like Baum Boulevard, Negley Ave, which could encourage sharing traffic and improve the cycling safety.


Show Advanced Options
Drop files here or click to select

You can upload files of up to 20MB using this form.