For this module, there were several social networks datasets given to interact and work. After studying the almost limitless possible outcomes of the information, I was motivated by the idea of exploring the ability of social networks to visualize urban spaces to a broader audience and if possible to assemble this information in order to understand the connection between users, networks and the physical spaces.
Outcome
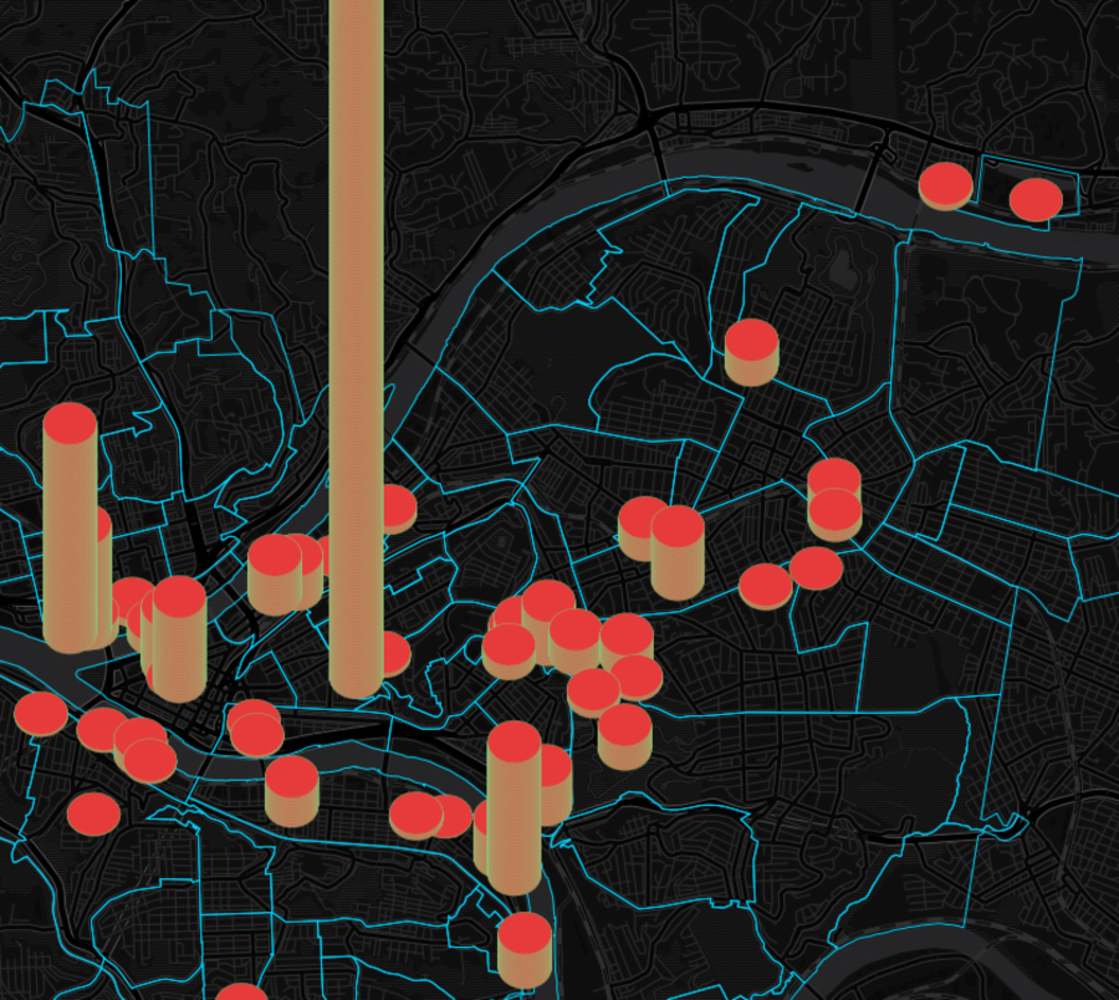
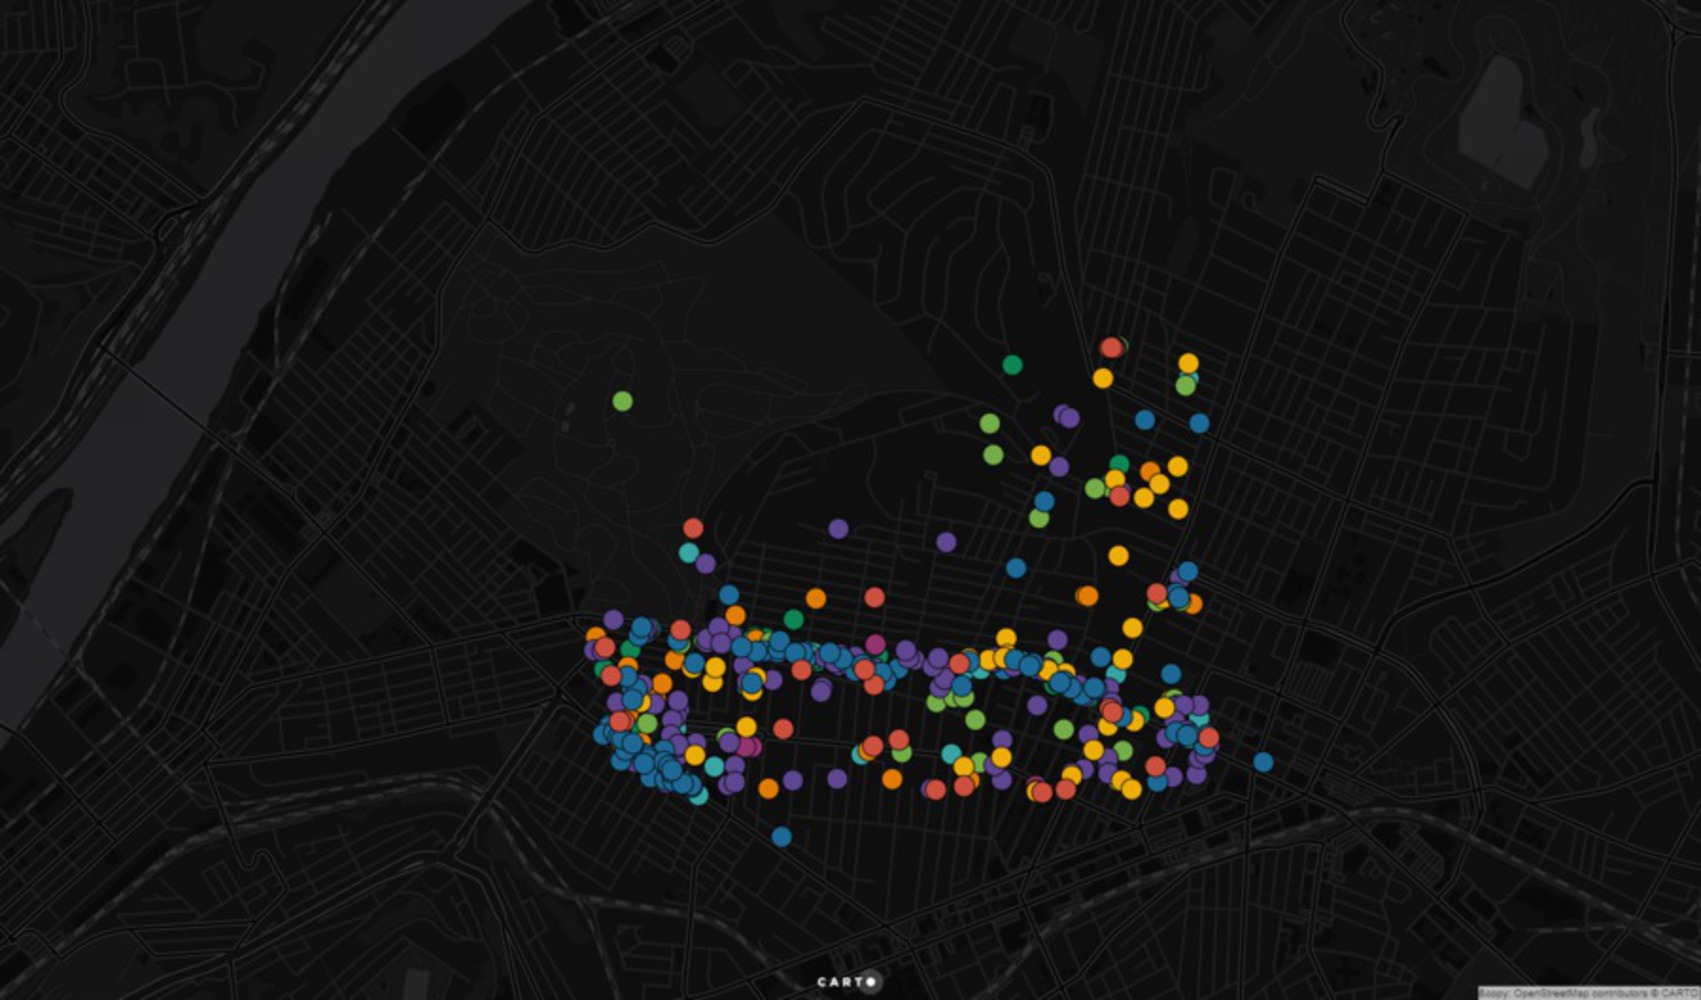
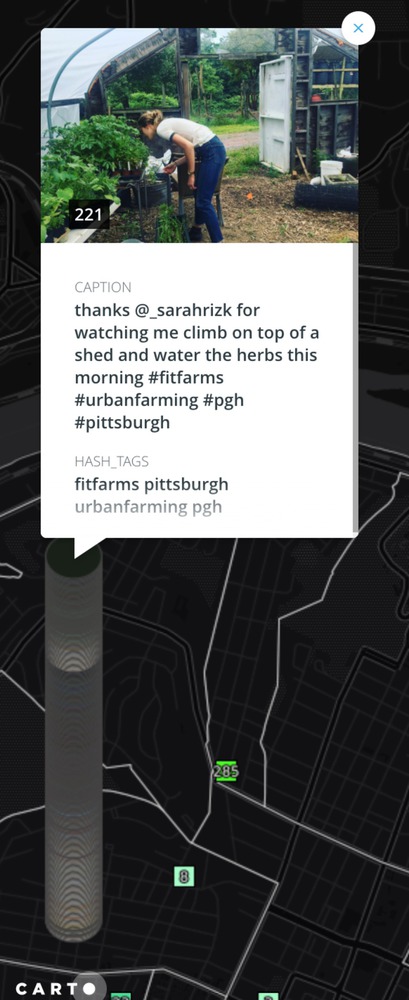
With an Instagram database, it is possible to code in Carto SQL to stack the information of post so that it becomes comparative concerning different places, but it is limiting the fact that this social network does not georeference the content. The above image shows the different post of Instagram in different locations within Pittsburgh.
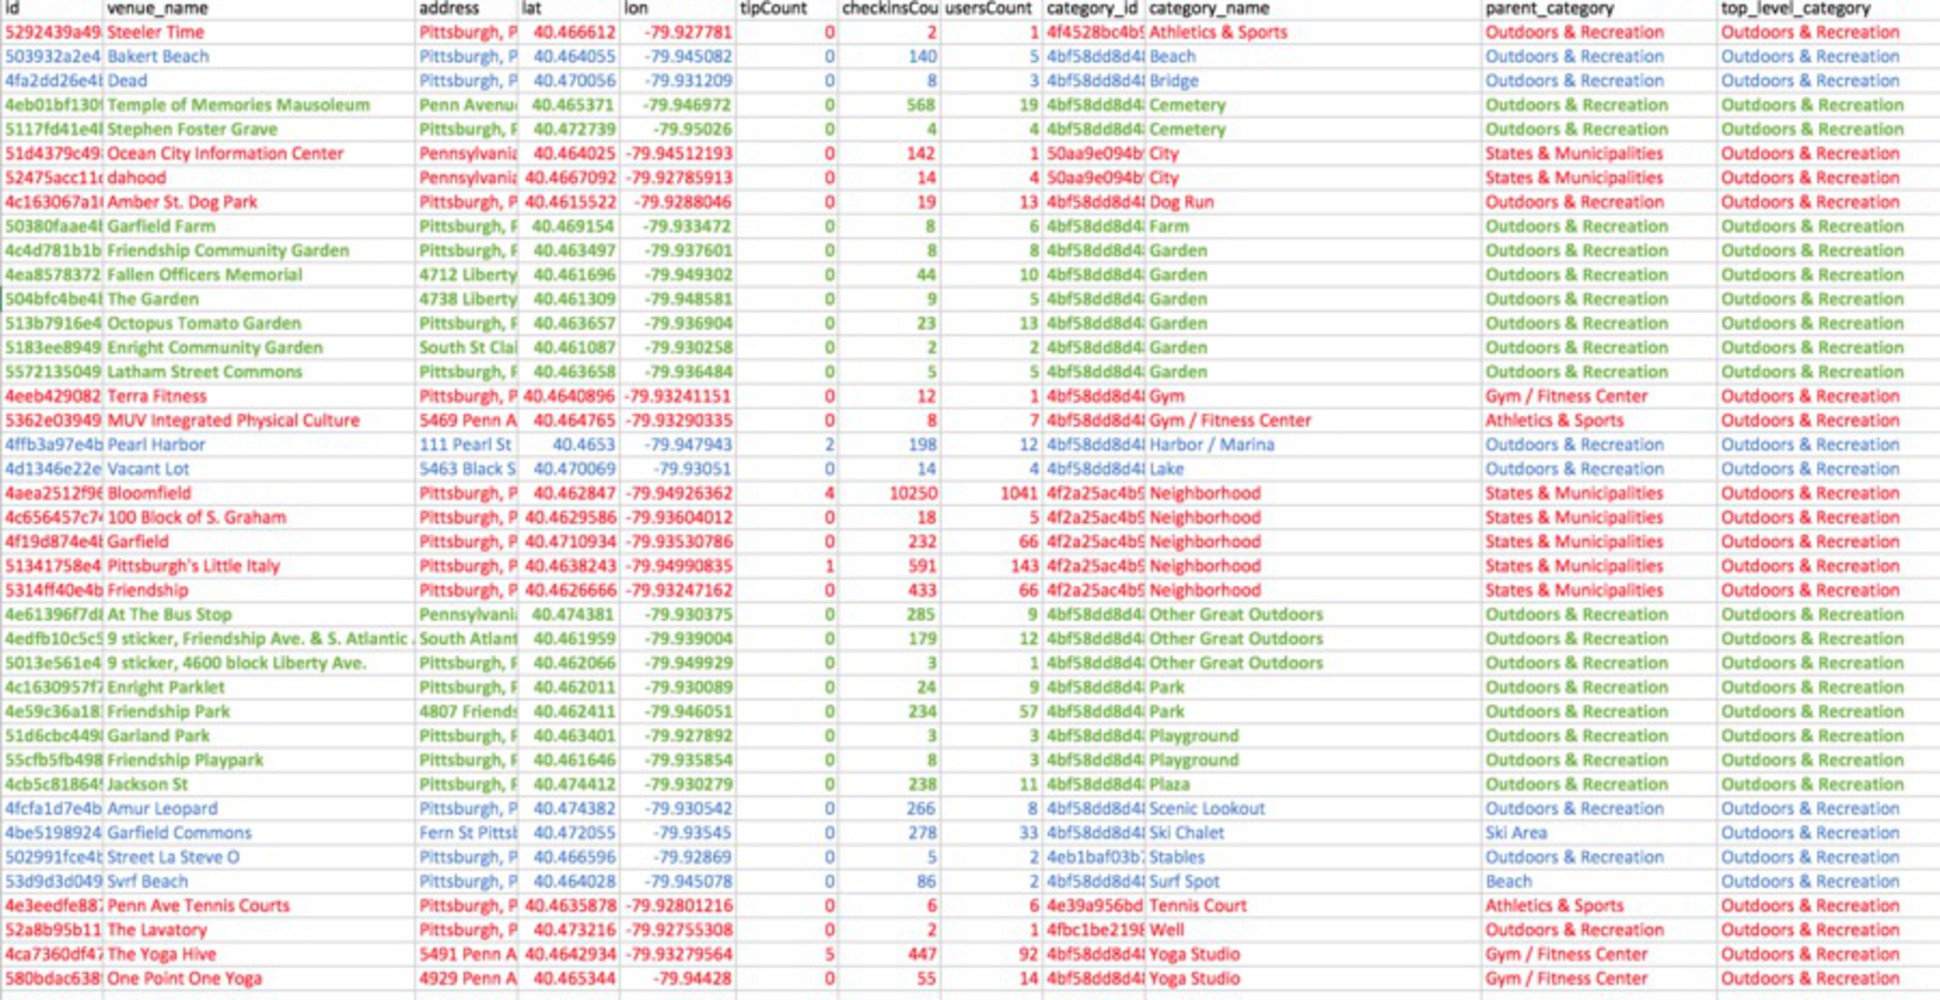
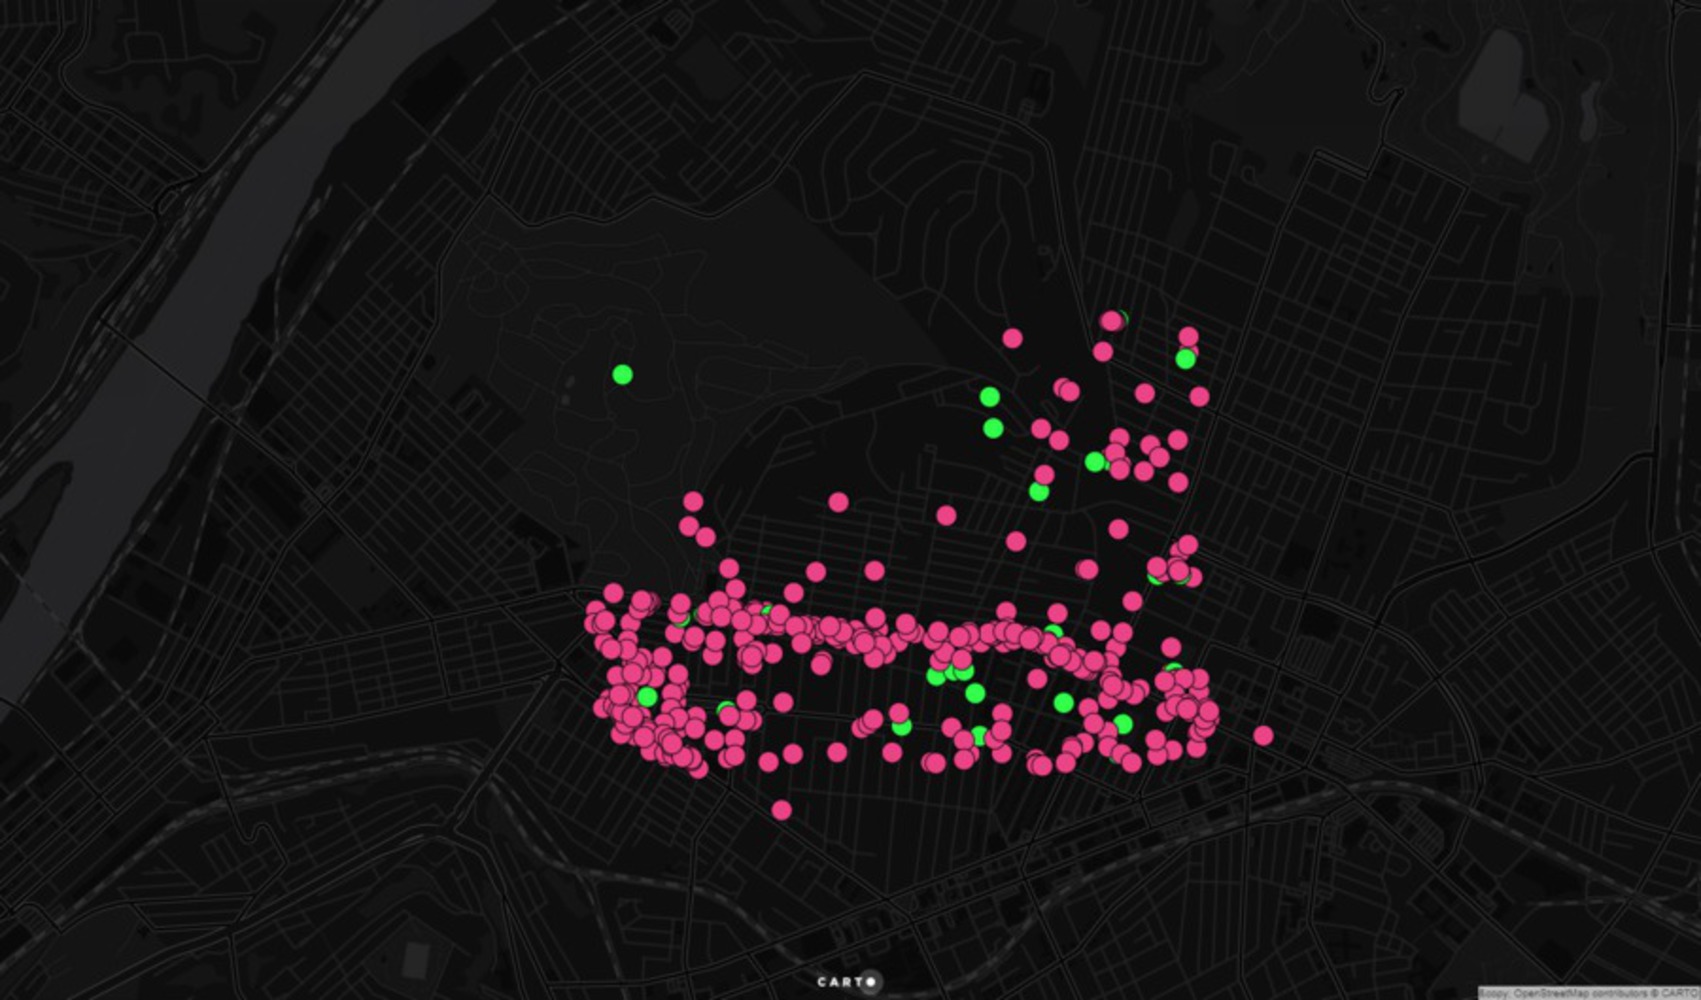
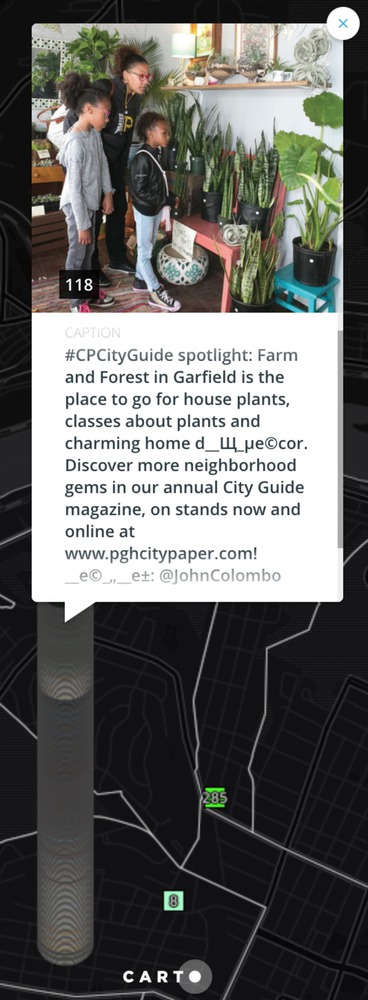
But by reducing the list to green spaces, it arises a need to understand what are these spaces where people react and publish information within Garfield. Thus, a Foursquare database is used, and the dataset list is reduced to specific green spaces of the neighborhood, which are not redundant or not very specified.
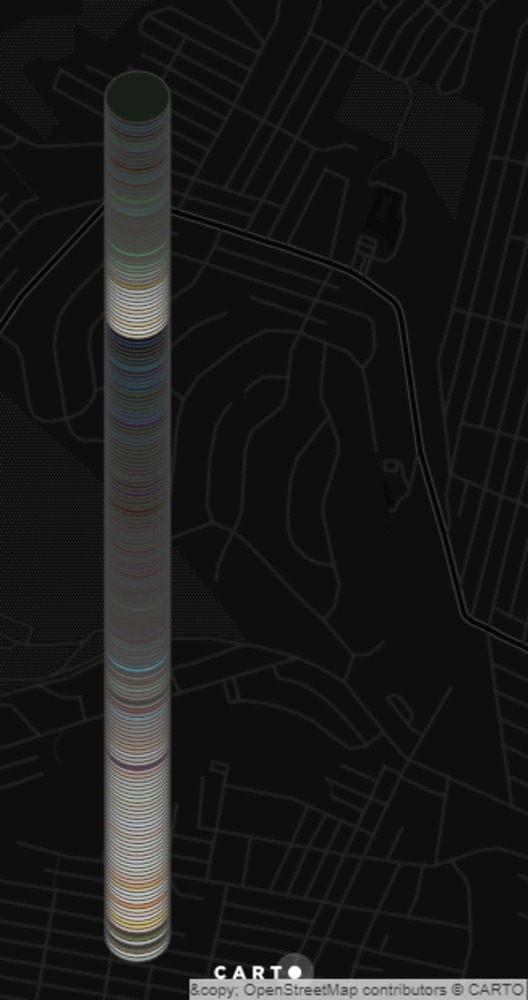
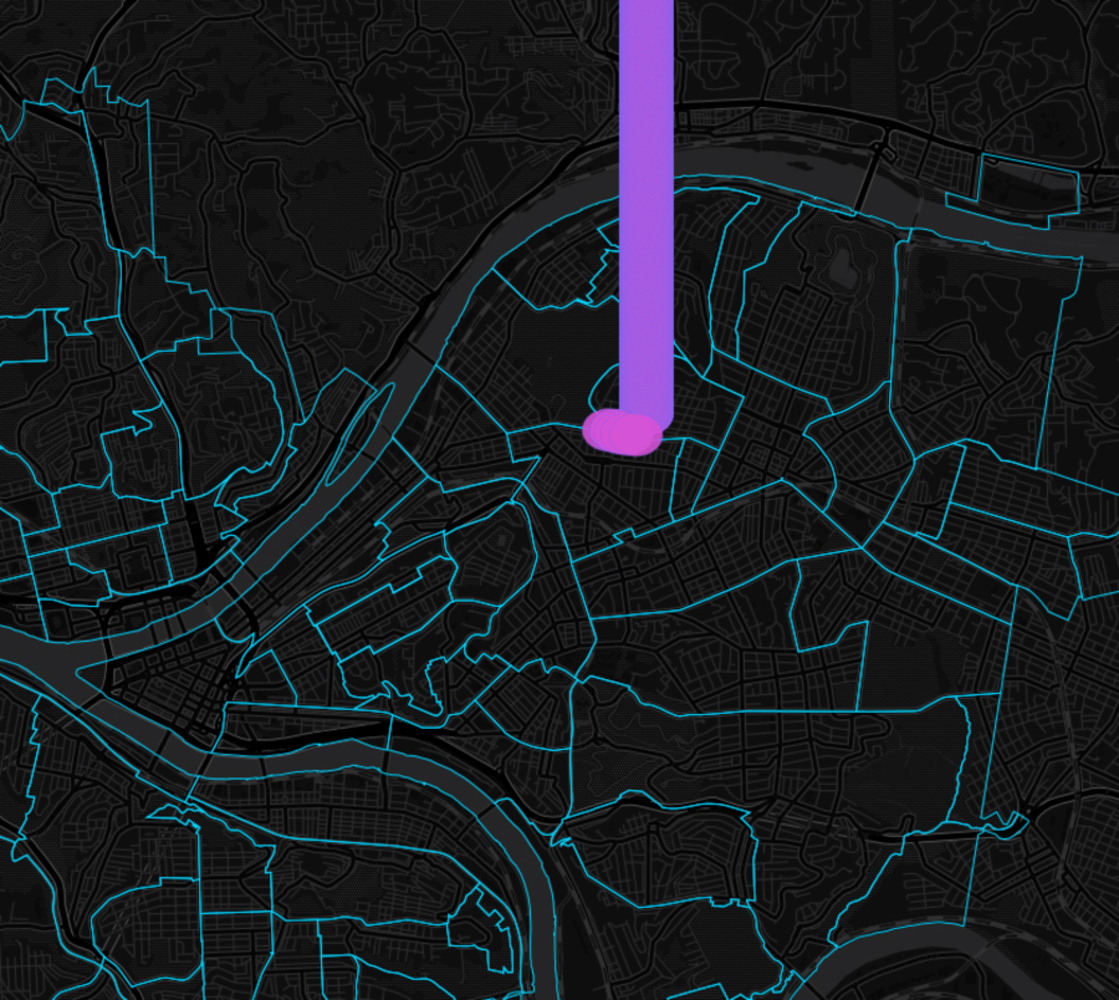
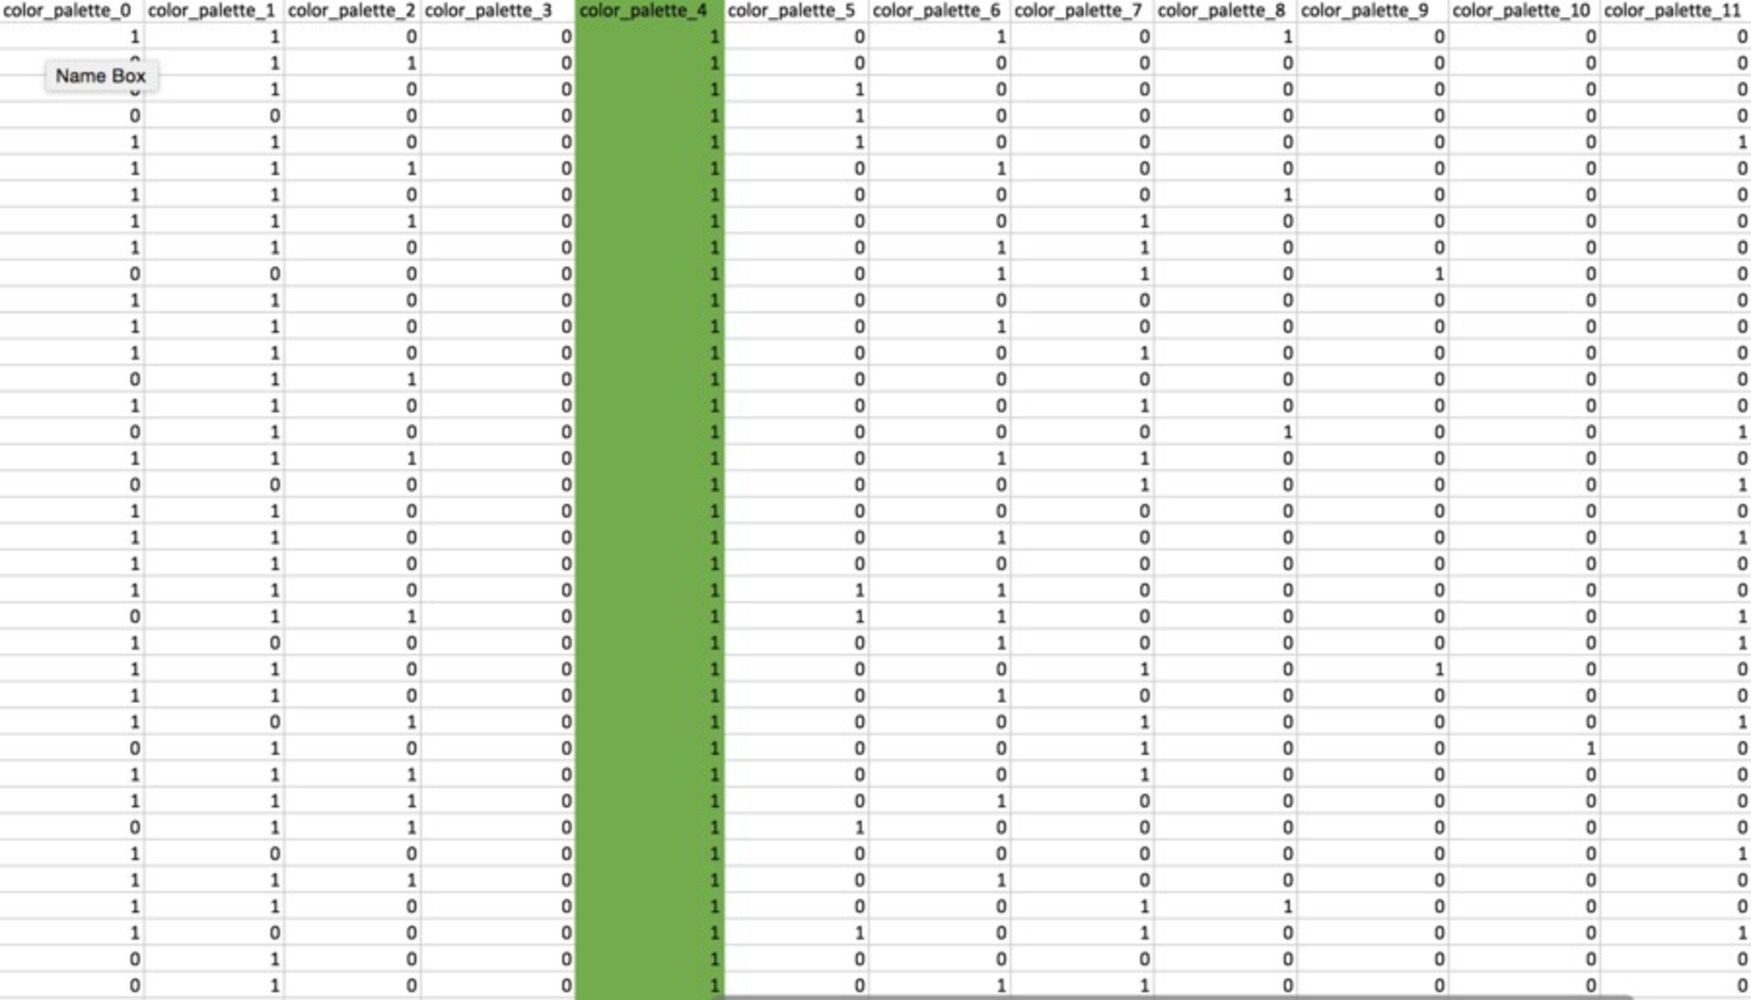
Using as reference the Stacking Chip approach, a script for stacking the new formatted dataset is written. To change the appearance of the information, there is also a new Carto CSS script. Check more info about Stacking Chip by Chris Whong here: https://carto.com/blog/stacking-chips-a-map-hack/
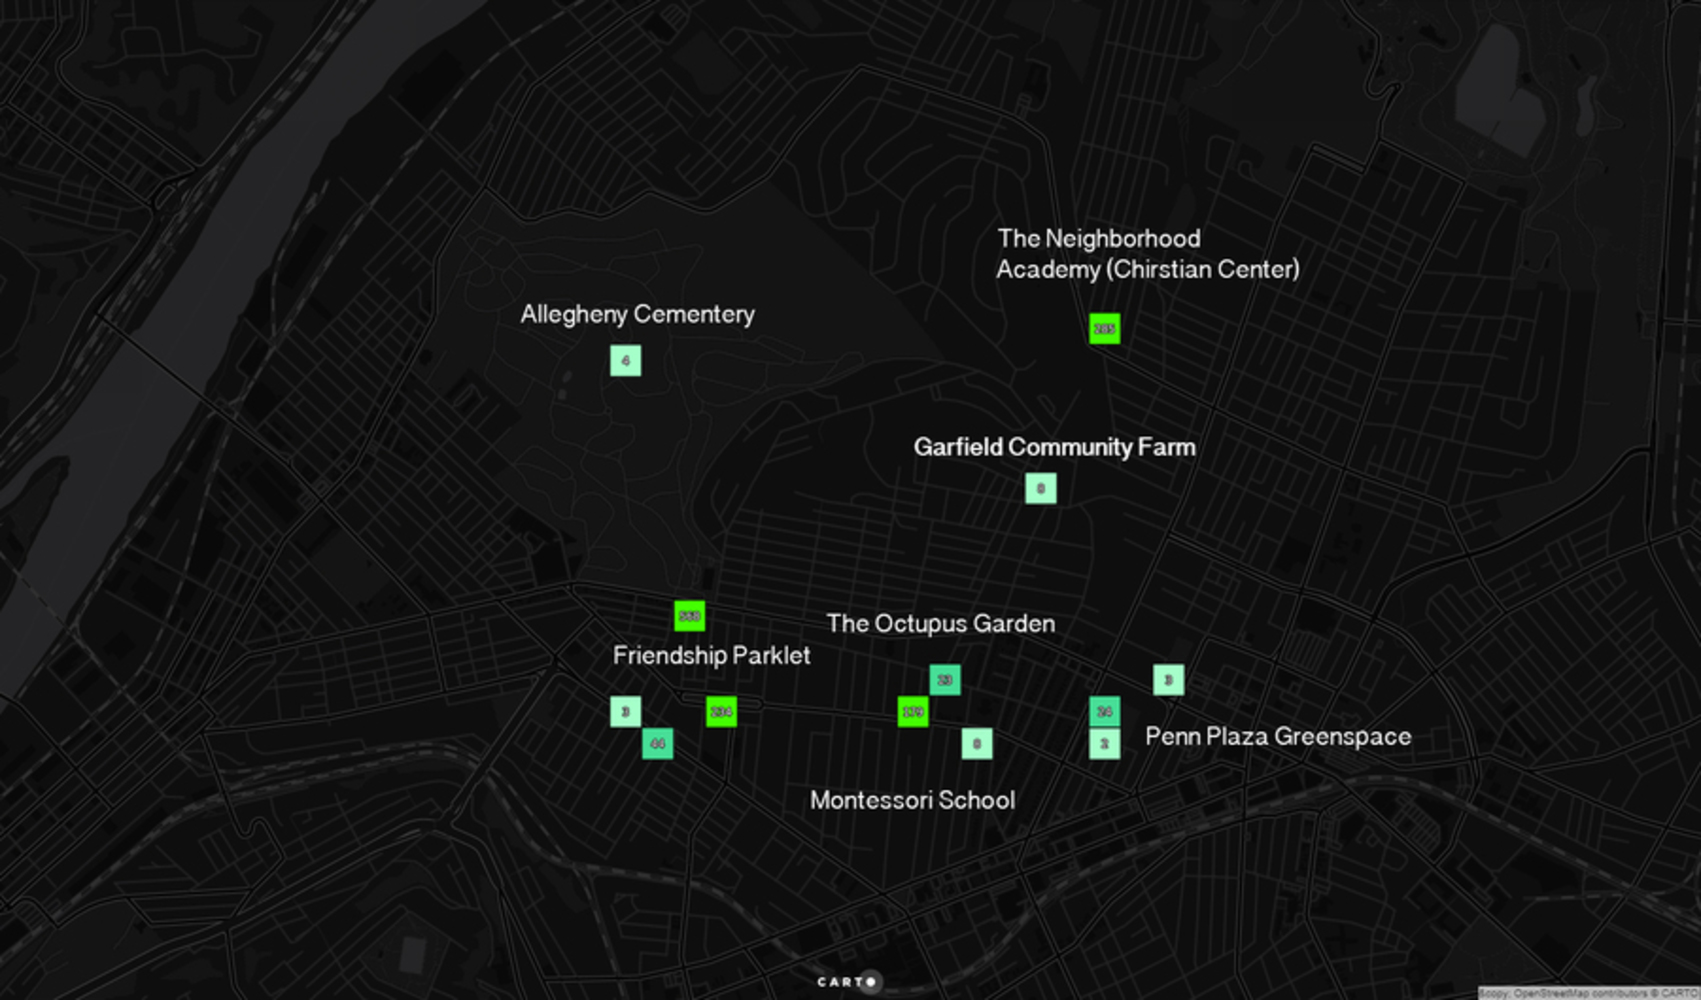
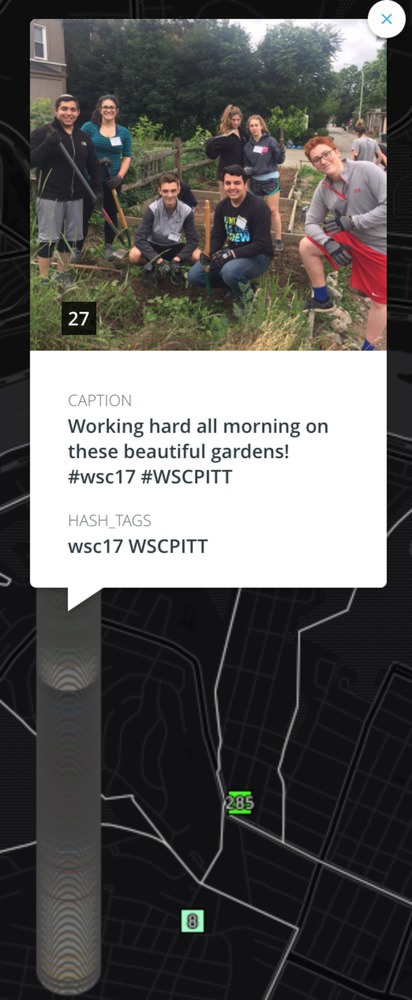
Finally, the study has determined that there is a correlation between the green spaces and the images that are placed on Instagram, at least three examples have been found that have a correlation between the colors, the check-in space, and the physical public space. The biggest limitation is that in order to use this information more effectively, it should continue to be coding in order to combine the data into a single presentation, and not empirical as it is now. It would also be interesting to propose a potential computational design that allows to automatically analyze the proposed relationships.
You can upload files of up to 20MB using this form.