Back to Parent

Outcome


Story

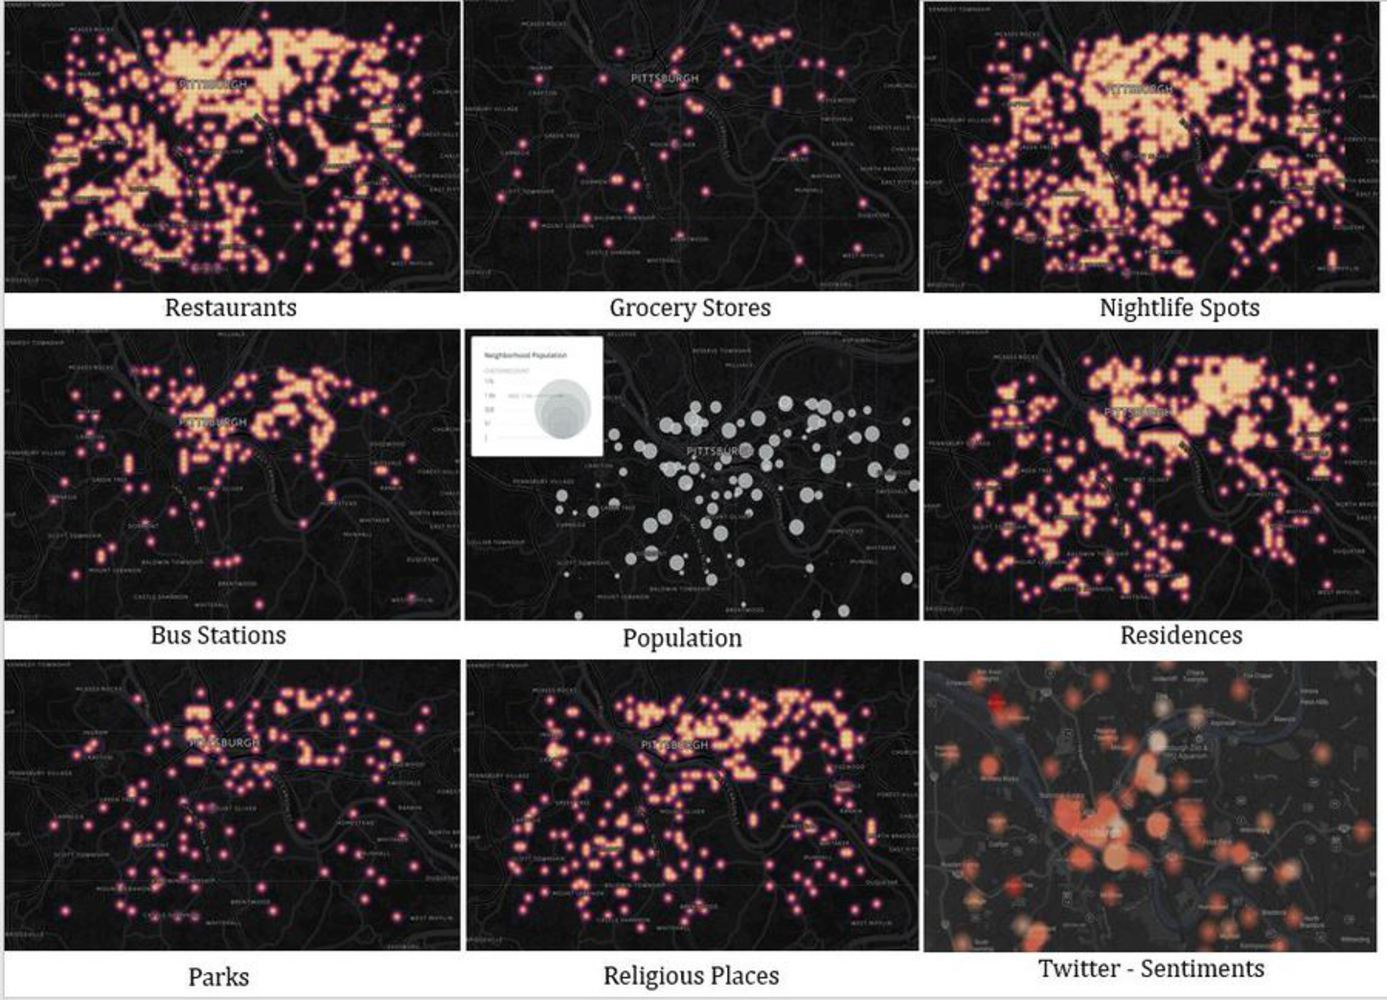
Continuing from what I did in Module 2, Iā€™m trying to investigate the neighborhoods a new family can move into. In this module, I have used social data from two sources ā€“ Foursquare and Twitter. Some of the factors, I have considered are ā€“ Restaurants, Nightlife Spots, Grocery Stores, Bus Stations, Twitter Sentiment Data, etc. This report contains an analysis of these datasets in order to conclude which neighborhoods are good o move into.
Collection

For this analysis, I have used Foursquare and Twitter datasets. All the mappings have been done using Carto except the sentiment data analysis which was done using eSpatial, an online tool which generates heat maps.

Analysis

I used the Foursquare datasets and filter it down in order to get the final data required for the analysis. After plotting the datasets on a map, we can get an idea of all the neighborhoods which are more attractive than others. Twitter sentiment data collection was particularly interesting. I tried to a text analysis using following words and gave them ratings based on their happiness quotient:

Elated, Ecstatic ā€“ 5

Happy, Glad ā€“ 4

Satisfied, Content ā€“ 3

Sad, Unhappy ā€“ 2

Angry, Furious ā€“ 1

Some of the drawbacks of this analysis were like inability to understand sarcasm, misspelled words are not accounted for, ā€˜contentā€™ can have other meaning as well, etc.

1.1.jpg.thumb
Show Advanced Options

Conclusion

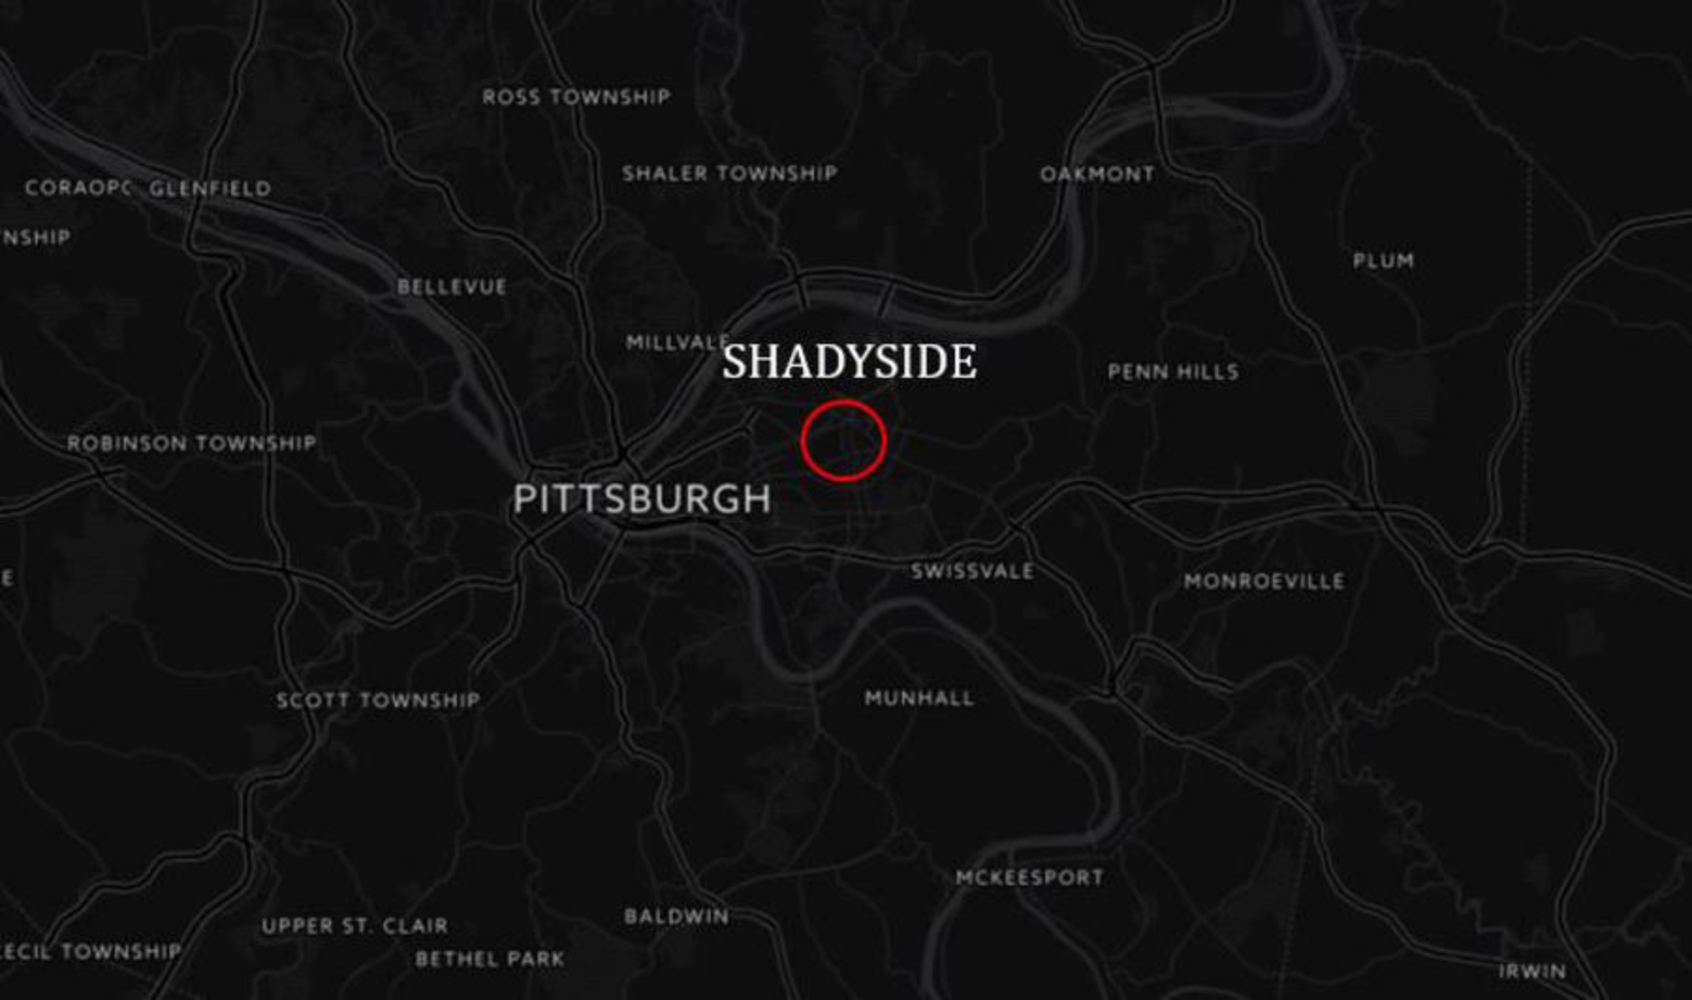
After the analysis, If I have to identify one neighborhood I would like to choose Shadyside as it covers all the bases. This also in agreement with my previous analysis (Module 2), where the demographic data showed that Shadyside is a good place to move into.

Shady.jpg.thumb
Show Advanced Options
Drop files here or click to select

You can upload files of up to 20MB using this form.