Back to Parent

Outcome


Dataset

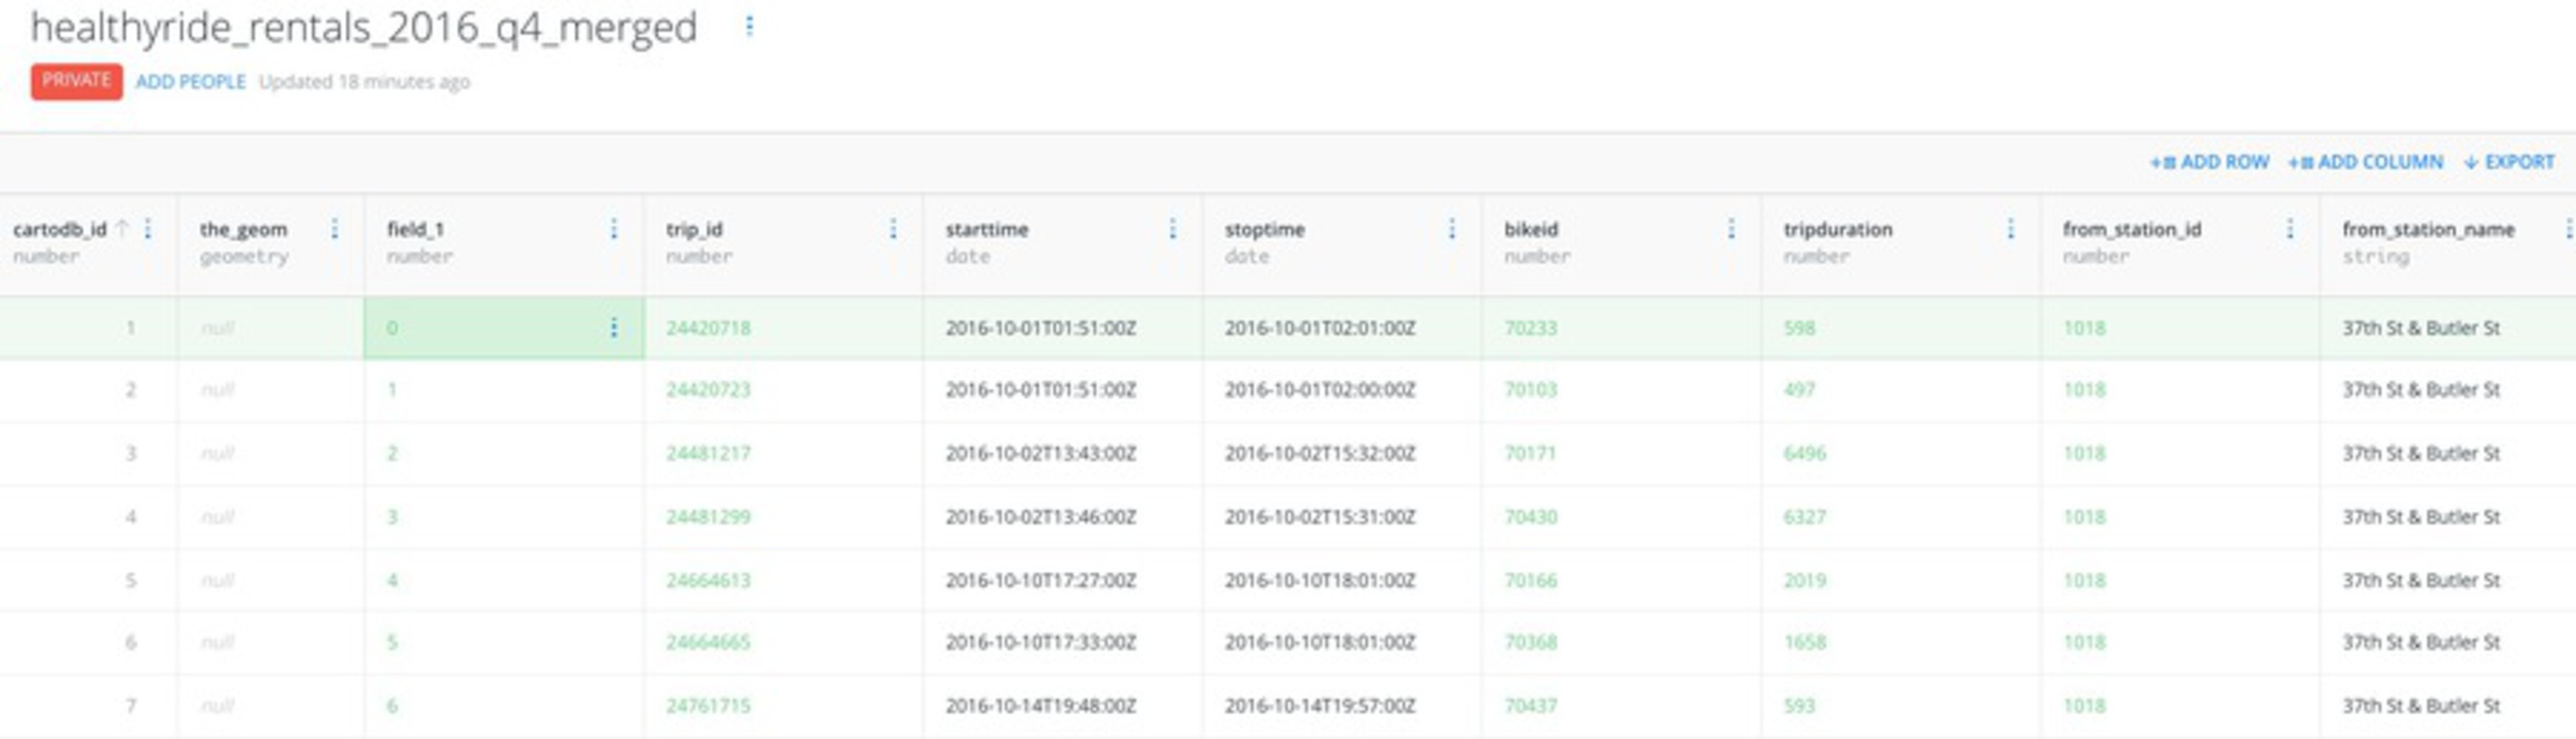
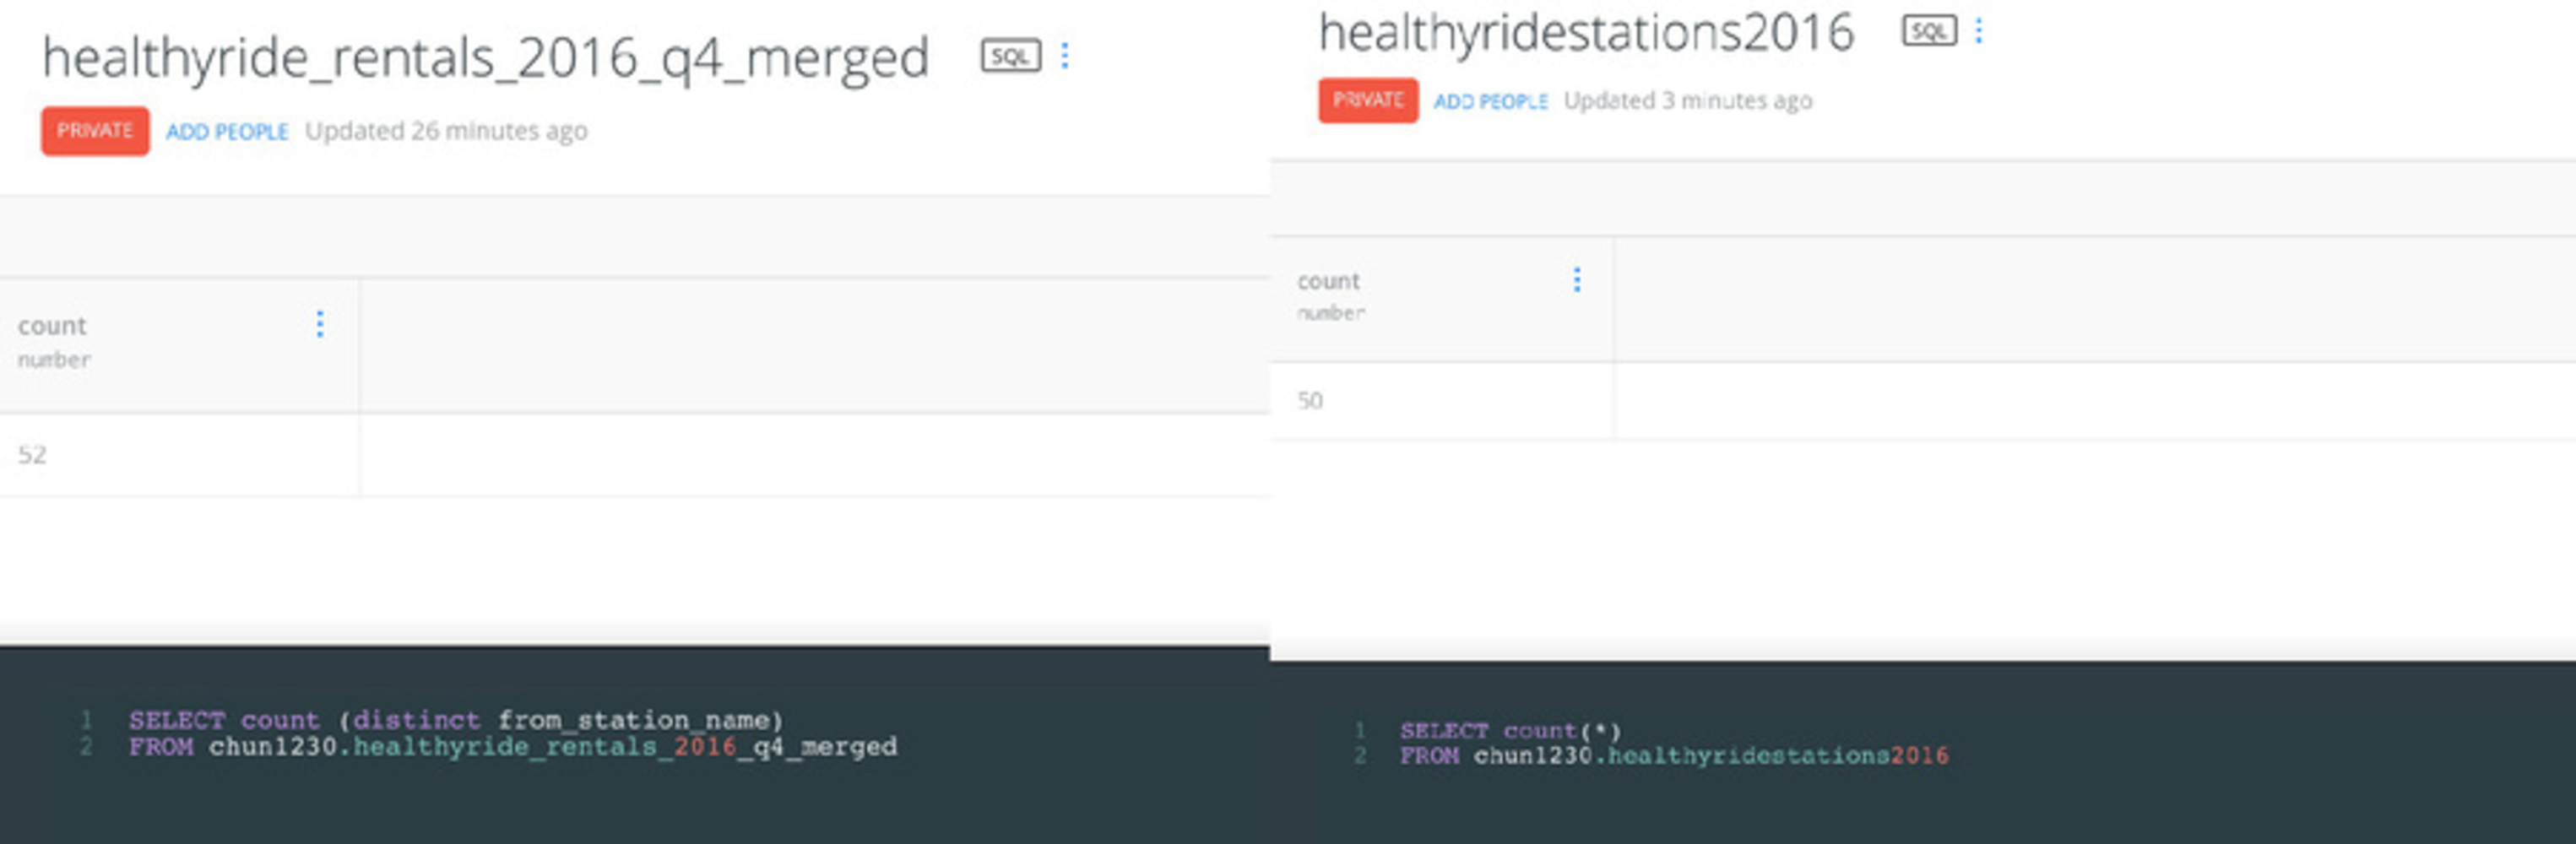
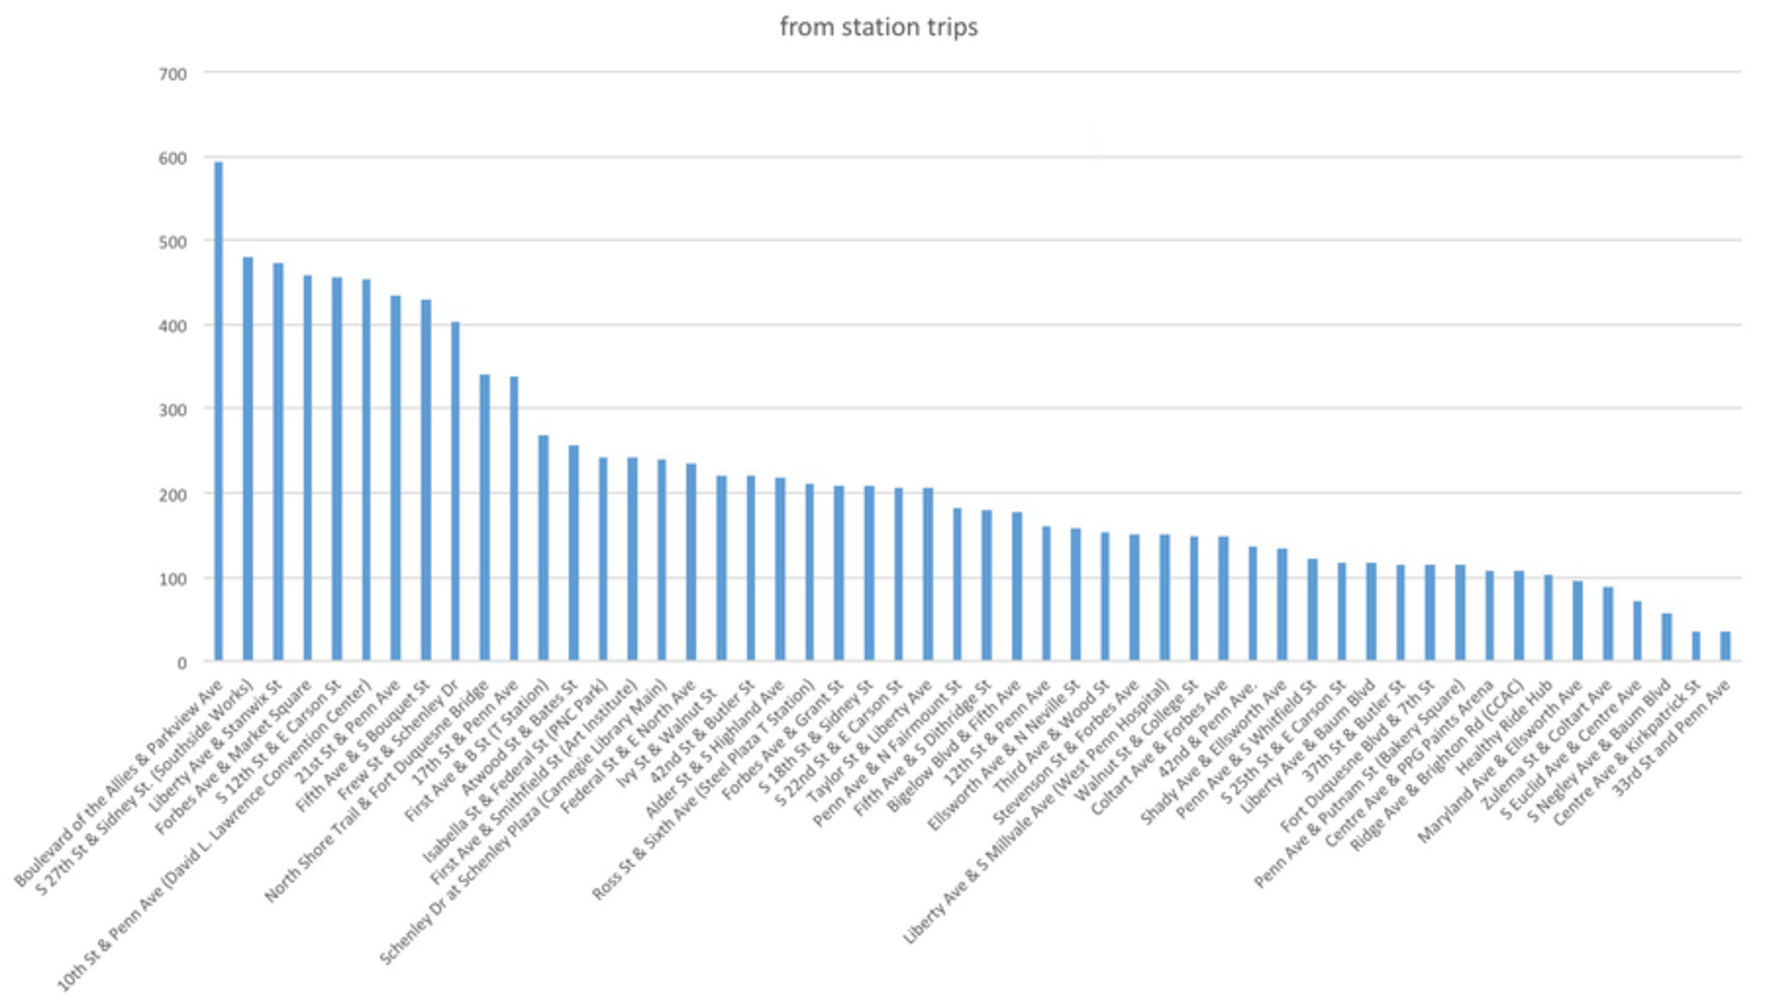
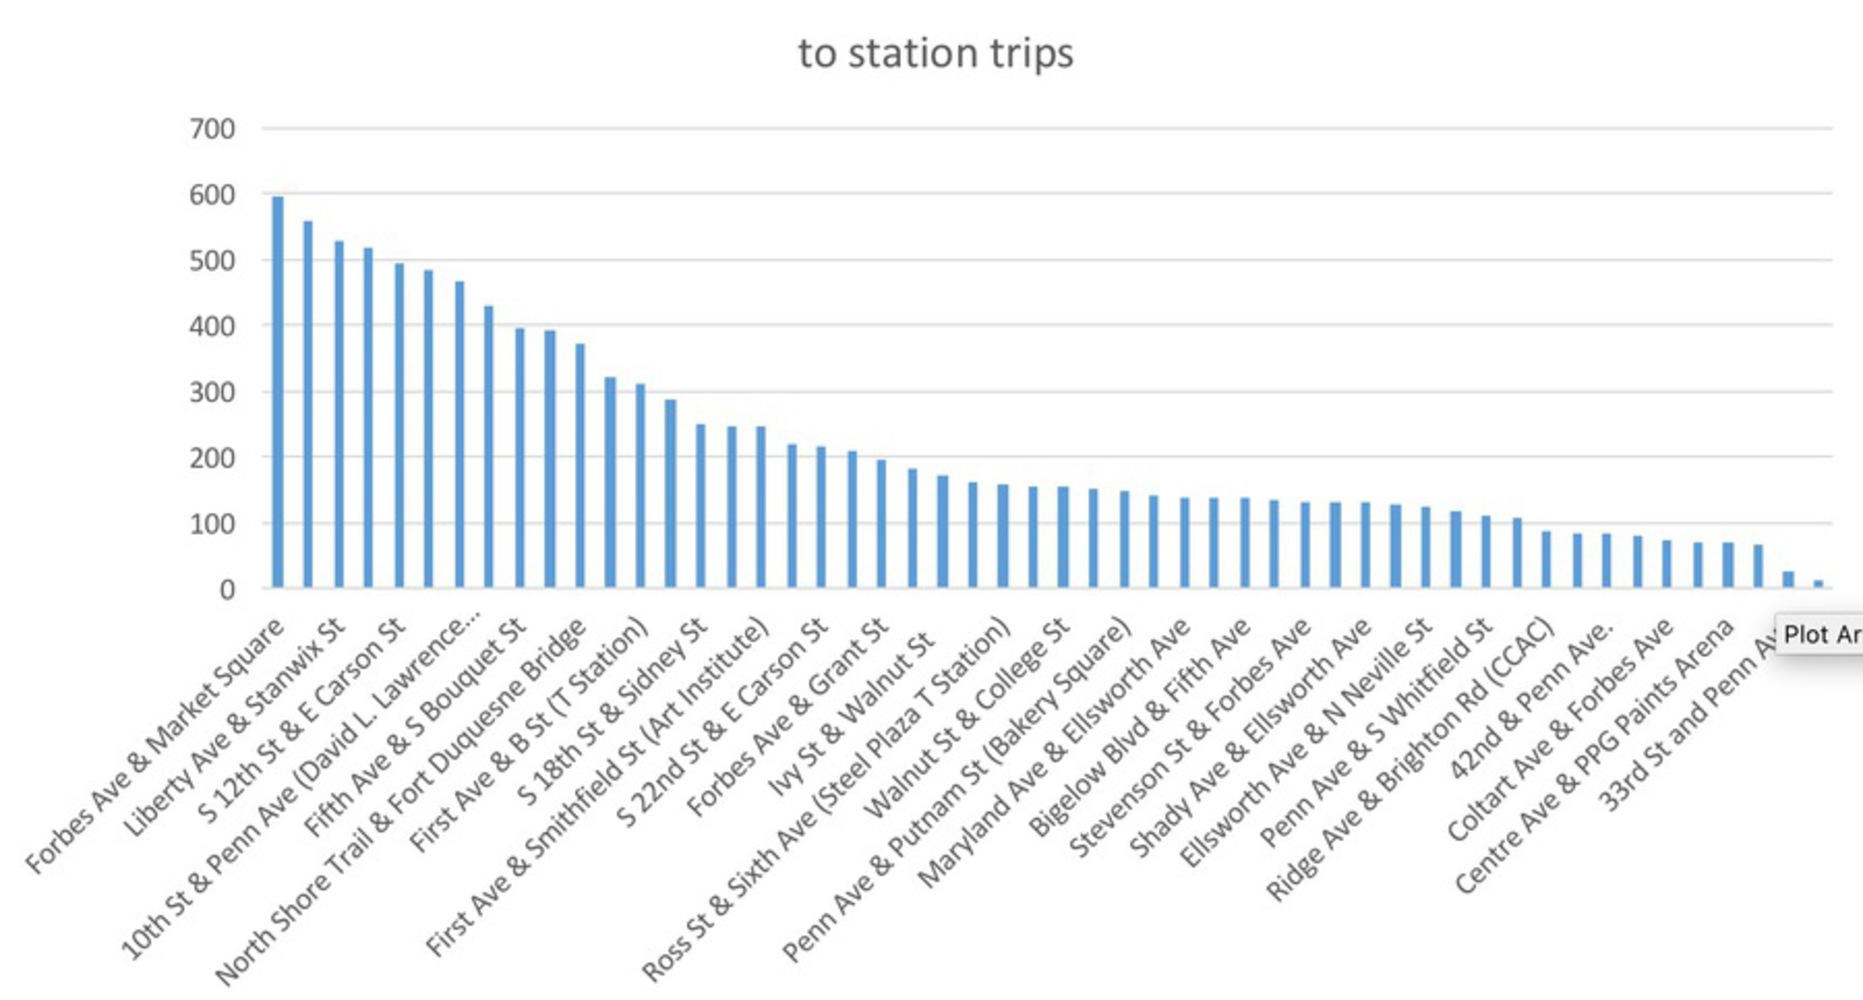
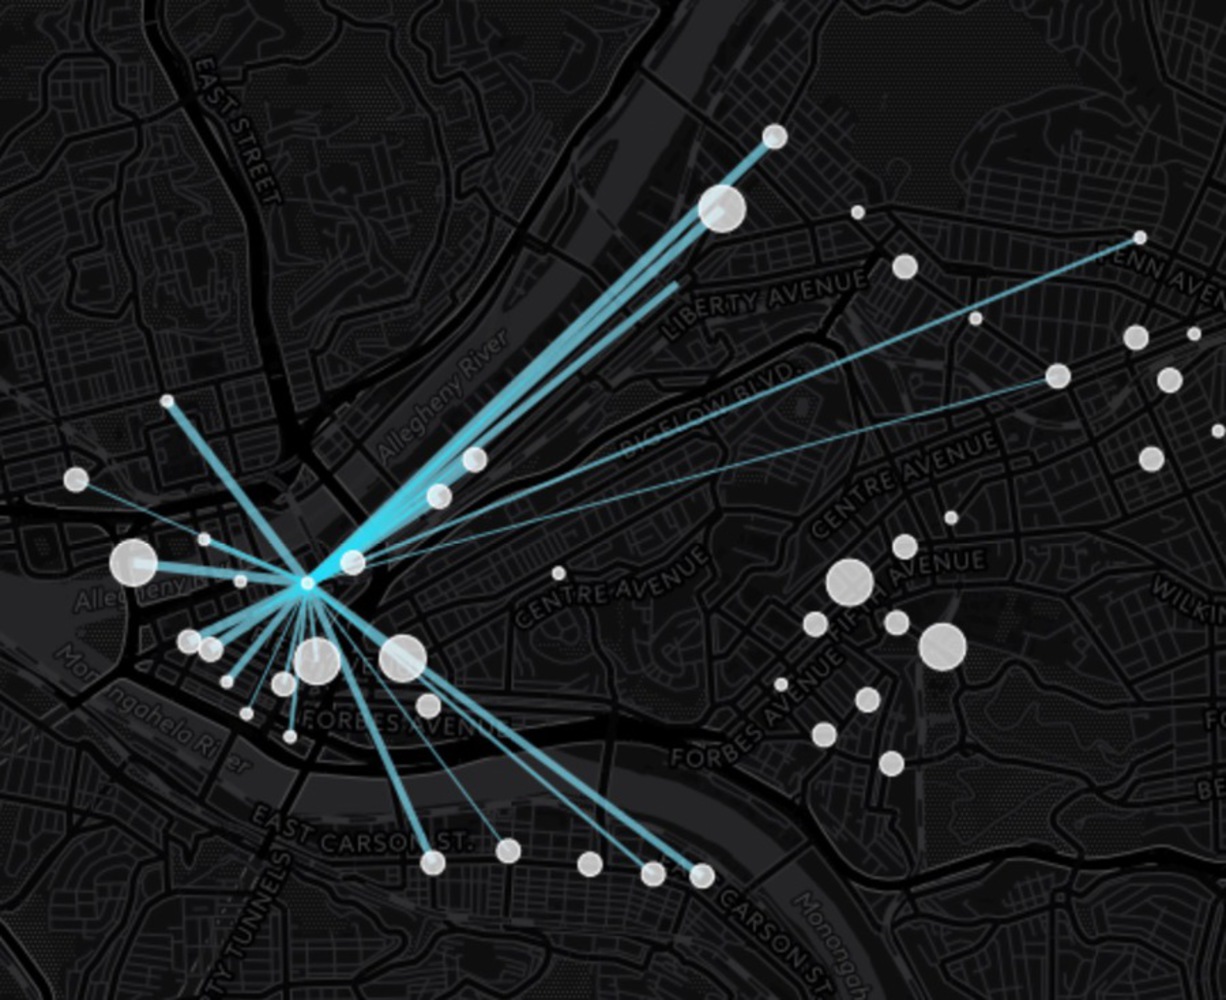
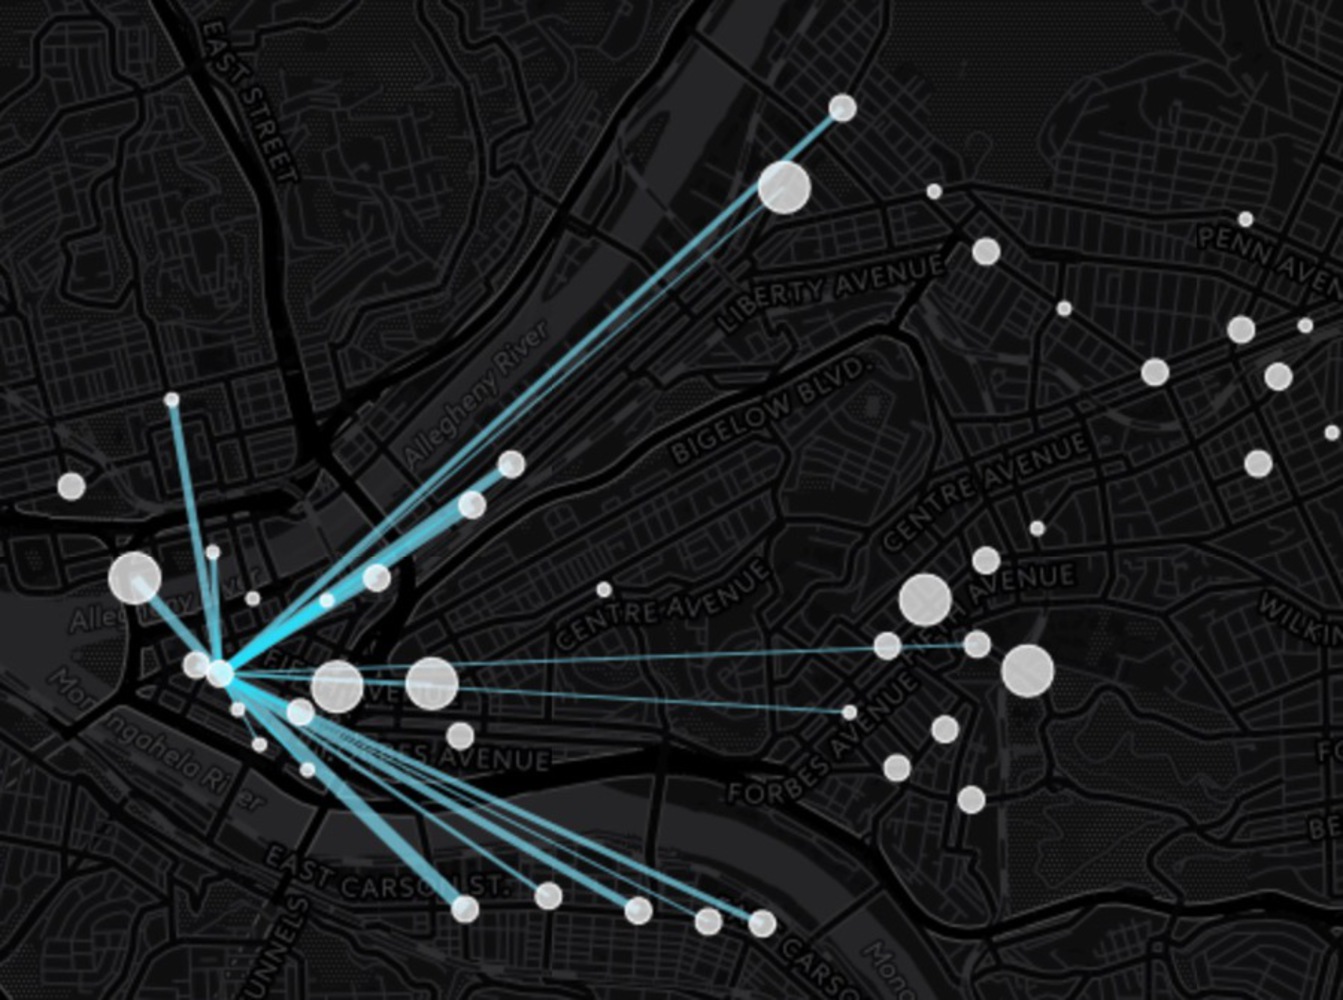
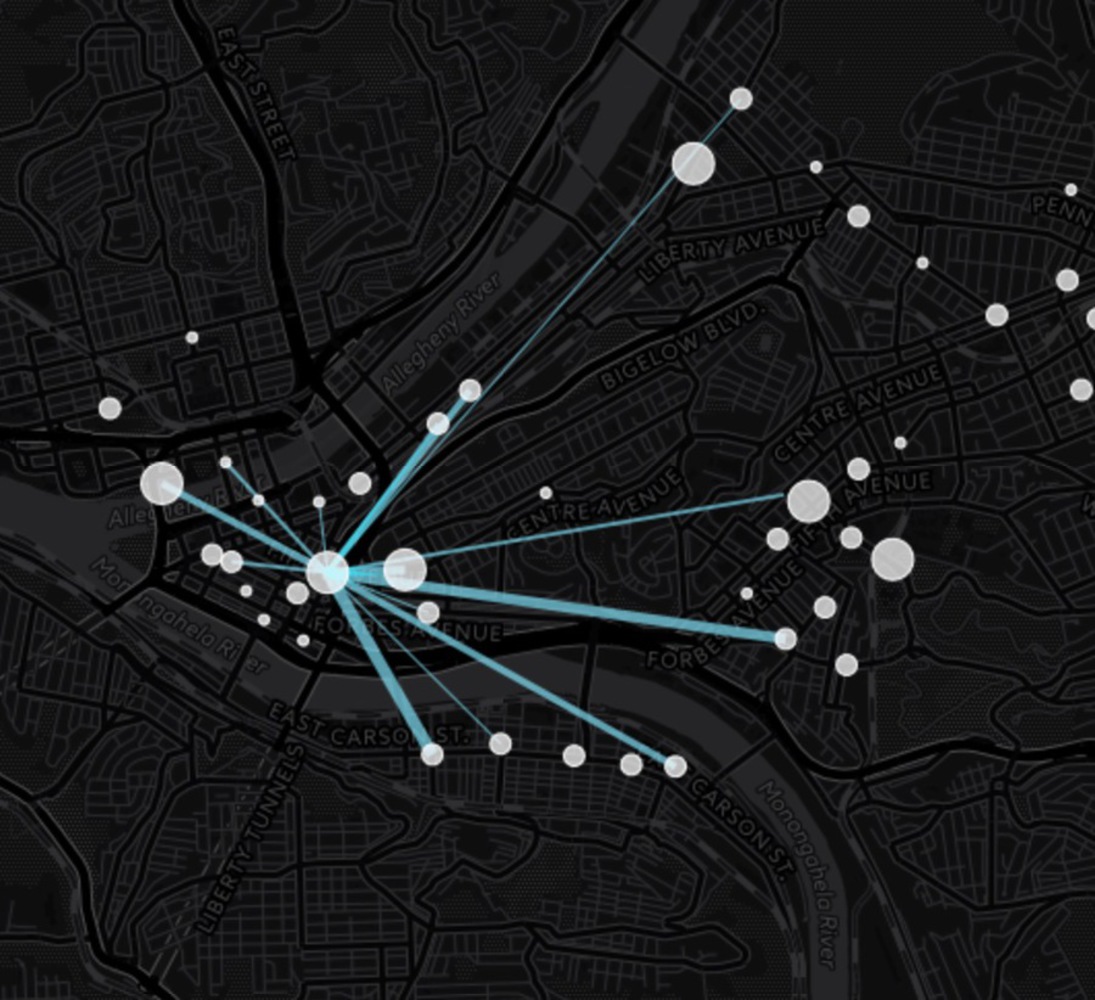
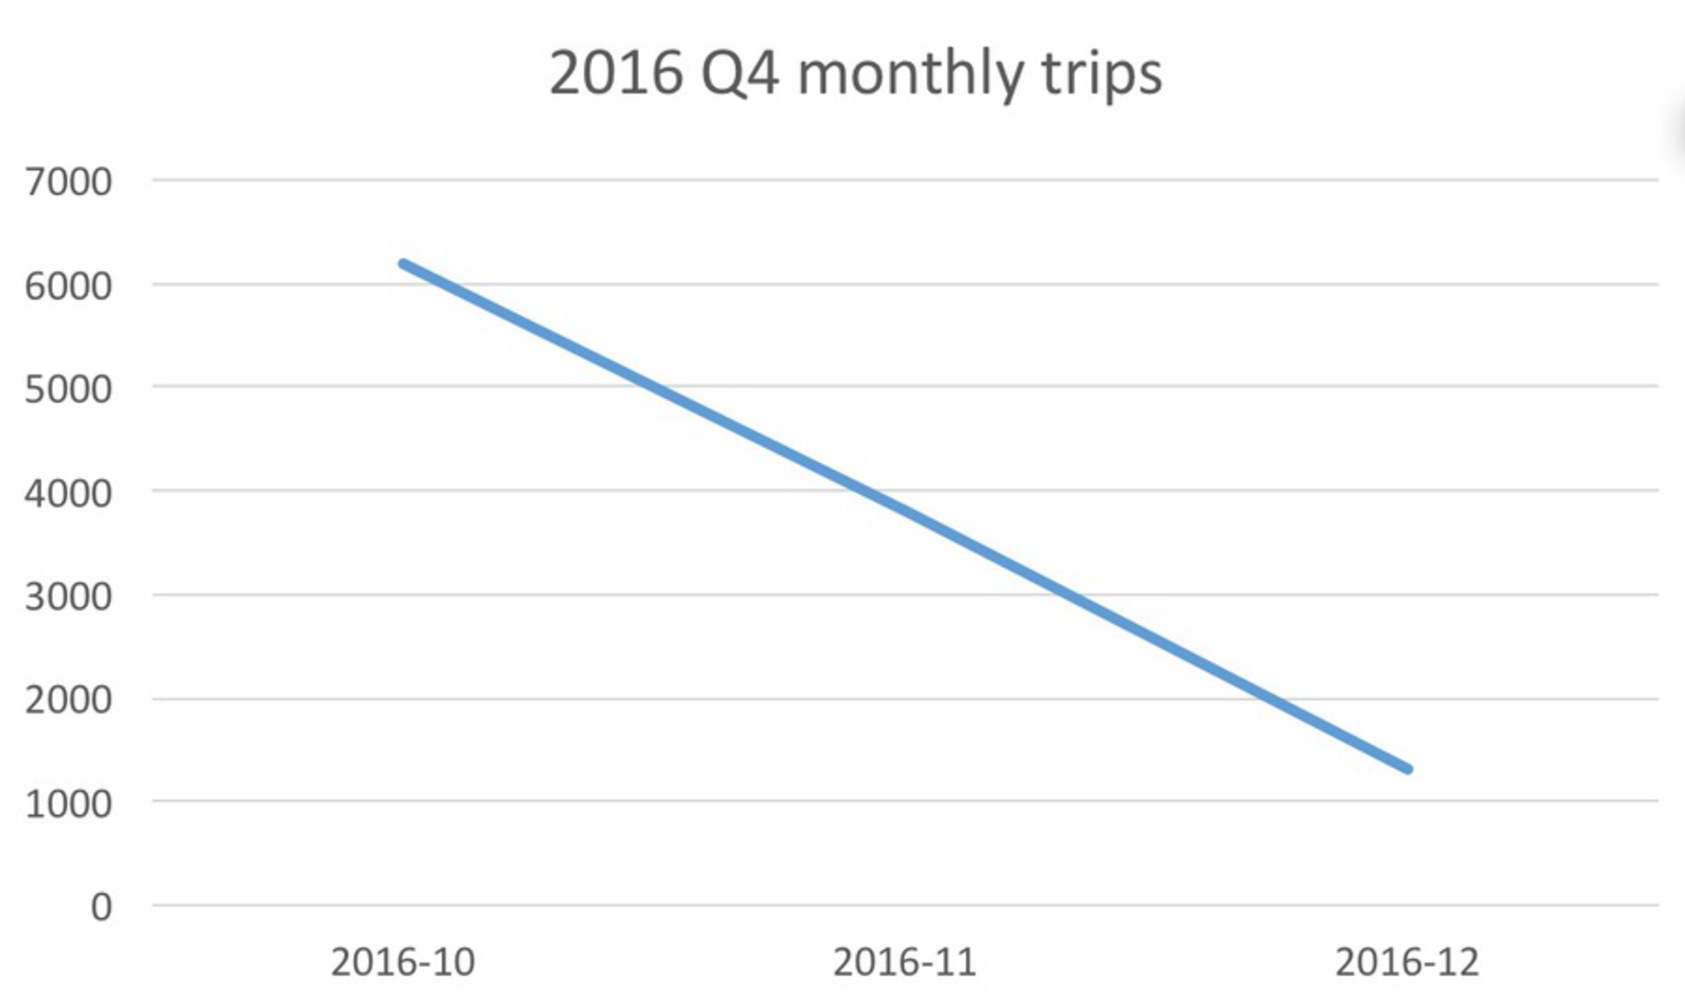
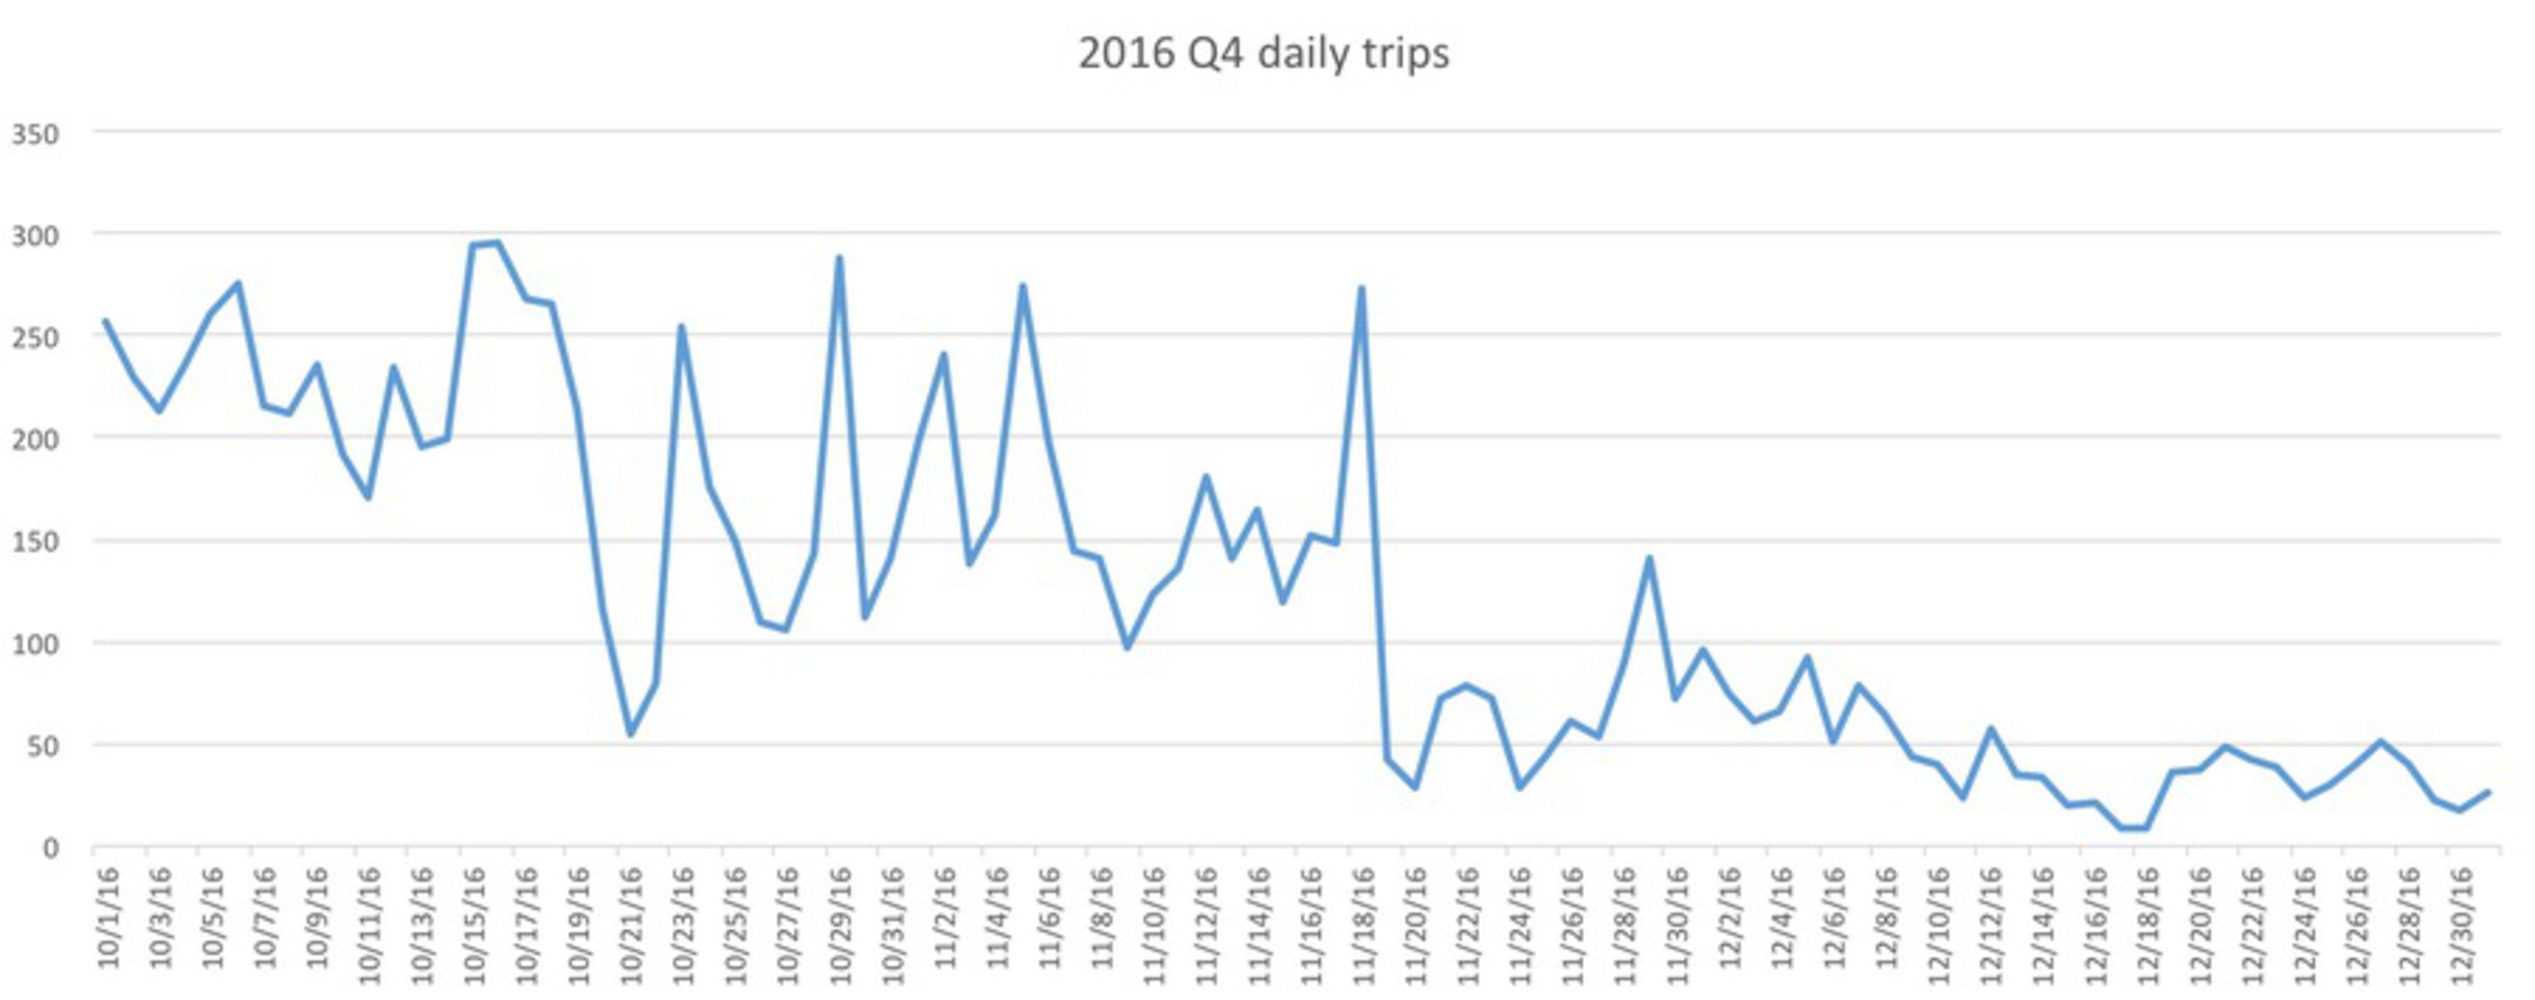
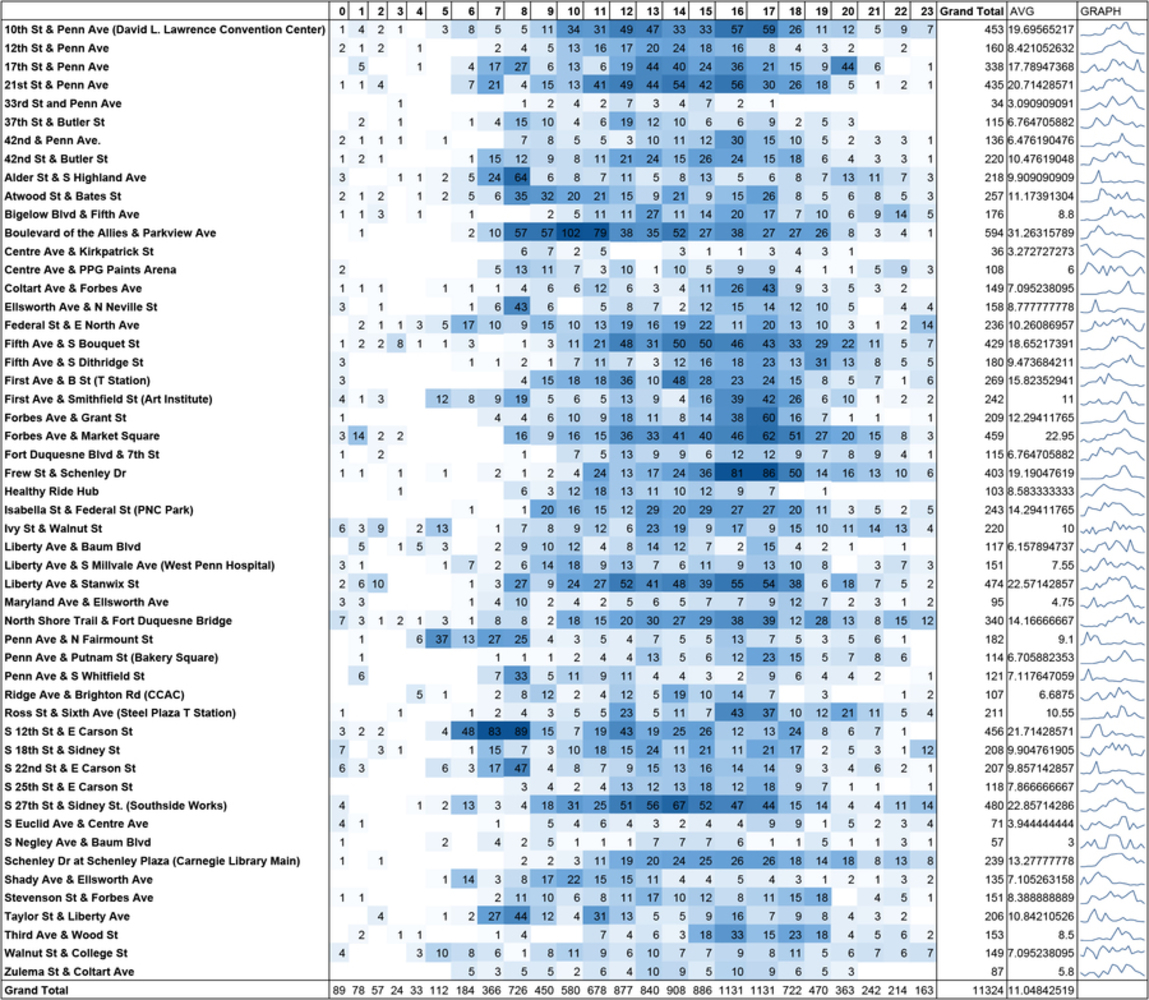
I used datasets made available by the Western Pennsylvania Regional Data Center (WPRDC) for the Healthy Ride Trip Data. Available at https://data.wprdc.org/dataset/healthyride-trip-data. Our dataset ranges from 1st October 2016 to the 31th December 2016 and includes 11,324 trips taken from 466 bikes from 52 stations in the Pittsburgh region. On average a trip lasted 46 minutes with a maximum length of 1.92 days and the shortest ride lasting just 60 seconds.

1.thumb
Show Advanced Options

Station

There are 50 bike stations in Pittsburgh in 2016 Q4 (which is different from the result in the bike rental data) with an average of 18.04 racks (min = 12, max = 35) in 2016 quarter4. 37th St & Butler St and 

Federal St & E North Ave, S Euclid Ave & Centre Ave and Centre Ave & Kirkpatrick St are the least resourced with 12 racks while Centre Ave & PPG Paints Arena and North Shore Trail & Ft Duquesne Bridge have the most racks (35 each station). The next large resourced racks (with 21 racks) are at Ross St & Sixth Ave (Steel Plaza T Station), Bigelow Blvd & Fifth Ave and 37th St & Butler St.

111 01.thumb
Show Advanced Options

From the location and rack number map, we can see 3 areas have stronger healthy bike resources than others–downtown, Oakland and Shadyside.

Station Activity

The following bar charts show the total number of trips started from or end up at which stations and the average trip durations for the stations. 

From1.thumb
Show Advanced Options
To1.thumb
Show Advanced Options

Compare the maps of racks in the station with the trips start from the stations, some large stations have a larger number of trips but some are not. 

So following the exploration of the stations, this network map shows the correlation between the use of the stations and the resources of stations. Is there a misdistribution of bike resource? Where the bikes are most needed but the stations don't have that many racks?

Show Advanced Options

The map shows some interesting findings:

3 most used (most trip numbers) stations are 10th Street & Penn Ave, 21st Street & Penn Ave and Forbes Ave & Market Square. These 3 stations happen to have most return trips as well.

3 most resourced (21 bike racks) stations are 37th Street& Butler St, Ross St&6th Ave and Bigelow Blvd & Fifth Ave.

If we study the trips start from them separately as following images. We found that the most used stops are not most resourced and the trips starting from these 3 stops cover larger travel radio in all directions.

1.thumb
Show Advanced Options
2.thumb
Show Advanced Options
3.thumb
Show Advanced Options

Meanwhile, the trips starting from 3 most resourced stations are one direction or one area concentrated. Although they all have relatively large number of trips, their service coverage is not so wide.

Thus, we see an imbalance between use and resource that indicates a potential better distribution of bike stations and racks. For example, Ross St&6th Ave station has the most racks in downtown, but Forbes & Market Square station has most users and more trips from this station end in Oakland or Shadyside. Why not try to allocate more racks in Forbes & Market Square station? I believe this kind of problem exists in other areas. By comparing the stations one by one, the healthy ride can come up a better strategy of redistribution of bike resource.

4.thumb
Show Advanced Options
5.thumb
Show Advanced Options
6.thumb
Show Advanced Options

Temporal Activity    

Following are the monthly trips and daily trips in the last 3 months of 2016. The monthly trip numbers decreased with month sharply which is definitely related to the weather. The daily trips also have a large relationship with weather. For example, the temperature sharply dropped on Dec 21 and there was a storm so the trip numbers had a sharp drop too.

Month.thumb
Show Advanced Options
Day.thumb
Show Advanced Options

Since the graph shows a clear phenomenon that the trips decrease as the weather become colder at the end of the year, the following animation gives a better representation of this change. We can see the pop-up bike checkouts become less and less as the date moves towards the end of the year.

Show Advanced Options

To better elaborate this pattern, we can compare single days in each of the 3 months.The following animations show the bike checkouts on a day in October, November and December.

Show Advanced Options

Lastly, the checkout matrix gives an overall sense of the bike checkouts in these 3 months. We see Boulevard of the Allies & Parkview Ave station and S 12th St & E Carson St station have a larger checkout number in the morning from 7am-10am and we can infer that more people check out bikes at these stations to work in the morning. From late afternoon to the evening, the checkouts tend to increase which probably because people come off work.

Grid.thumb
Show Advanced Options

Future Work

What's the relationship between the protected bike lanes and the use of HealthyBike stations? Can HealthyBike data guide the planning of the bike lanes in the city?

Supplementary datasets: BikePGH's Pittsburgh Bike Map Geographic Data–https://data.wprdc.org/dataset/shape-files-for-bikepgh-s-pittsburgh-bike-map
Next Steps: (1)Mapping the trip traces based on Google best routes (assume the bikers follow the routes) (2) Represent the number of trips with the thickness of the traces (3) overlay the trace map with Pittsburgh protected bike lanes map (4) find potential relationship between the healthy bikes traces and protected bike lanes and make suggestions of where to add more bike lanes in planning process

Feedback

1. Look at the least resourced and least used stations

2. Where is the central station that links the trips across the city

3. Imbalance within areas, for example, the most used station along Liberty Ave has really few racks.

4. Weather correlation with the checkouts

5. Checkout matrix for "the day" in each month.

Drop files here or click to select

You can upload files of up to 20MB using this form.