Intention
The motivation of this preparatory project is to understand the Healthy Bikes data better. This particular endeavor will set the basis for a deeper dive into a query and serve as ground work for the same.
The data set presented deals with a quarter (Q3) of the bike share data of 2016. As part of the preliminary analysis, SQL scripting was used to obtain a basic statistical summary of the data using the postscript based Carto server. Some of the analyses, in particular the graphs were conducted in Microsoft Excel.
The trip duration ranged from 1 minute (clearly someone who abandoned the idea and hence an outlier) and 1.96 days. On average people however rented the bike for 1.03 hours. The bikes seems to have been used (both picked up and dropped off) more or less throughout the day with pickups at such times as 11:30pm and 12:44am and drop off times at around 11:47pm and 01:22am.
The number of racks available per station (and hence an assumed number of bikes available) ranged between 12 & 35 with the average hovering at 18.04.
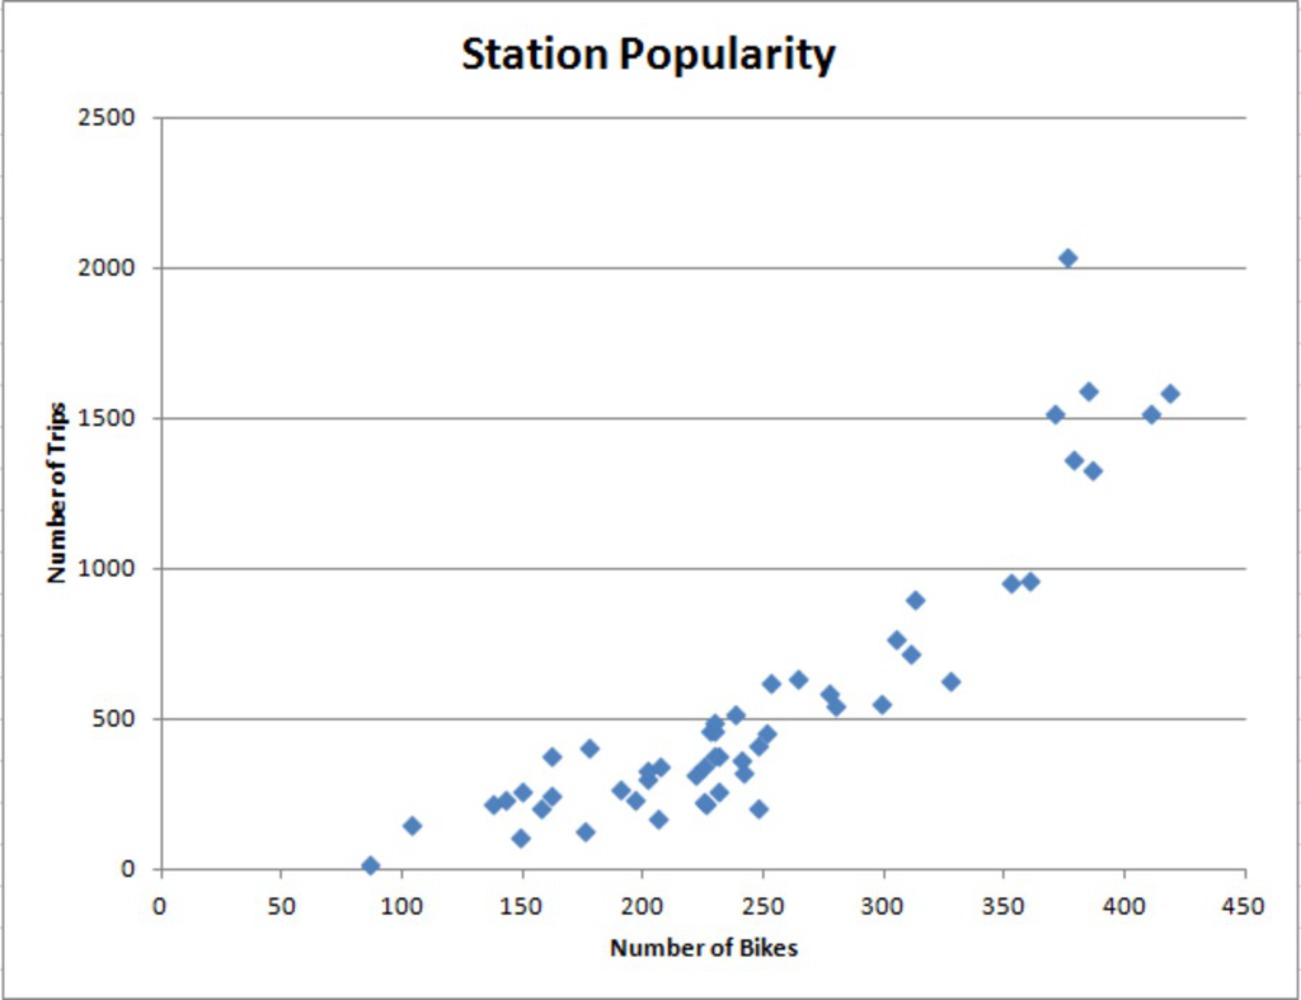
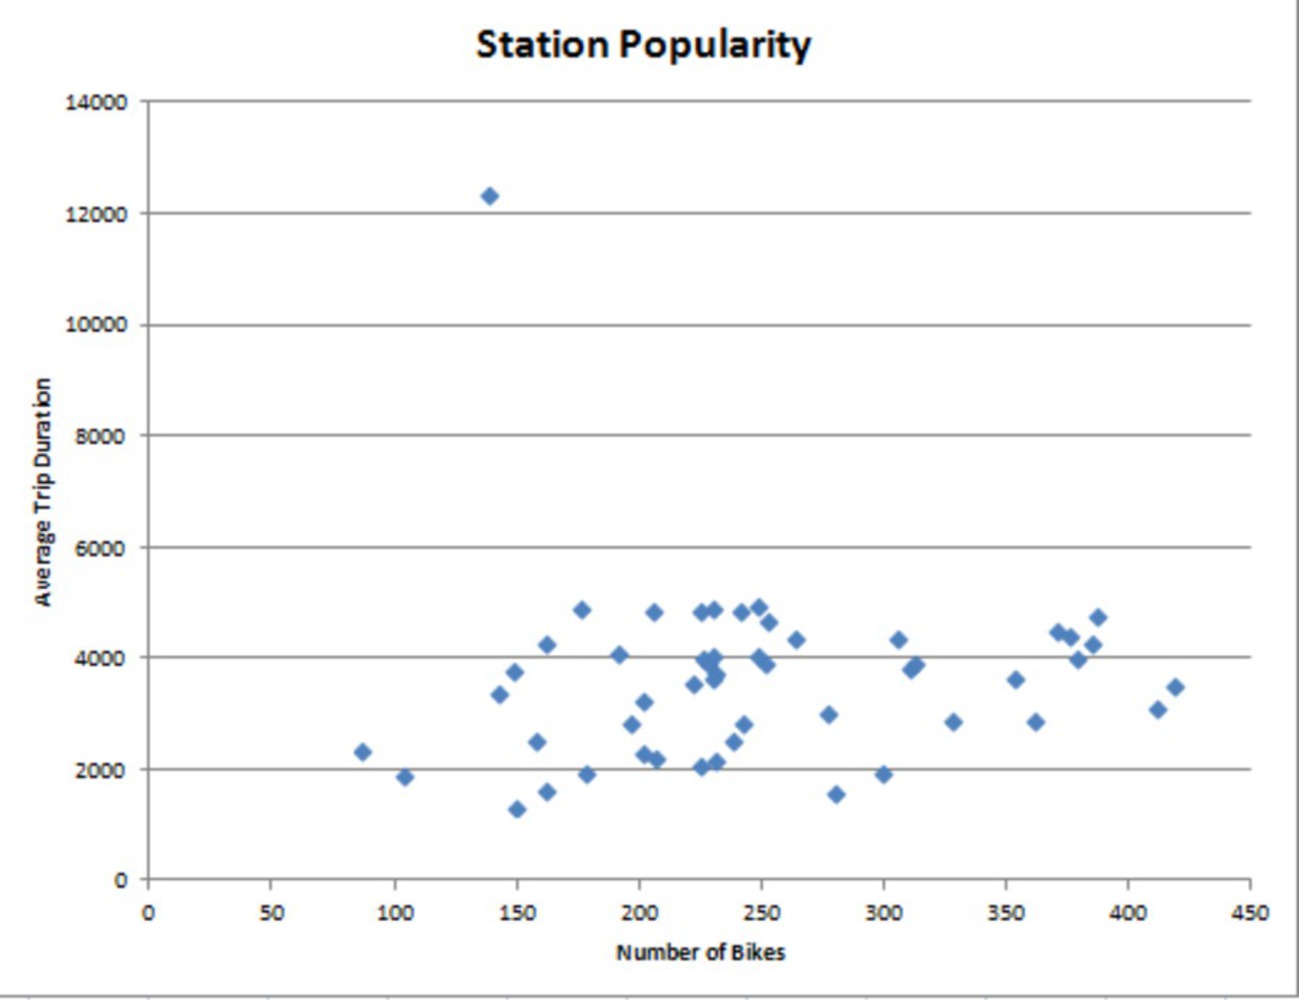
The popular stations seem to be S 27th St & Sidney St. at Southside Works (1,769 pick ups and 2,038 drop offs) and Liberty Ave & Stanwix St (1,408 pick ups and 1,598 drop offs). It was interesting to see however that there were substantially more drop-offs than pick ups. It was also fascinating to see that while it is natural for the number of trips to grow with bike availability, the correlation was exponential. The duration of the trips however did not show any such correlation. The only outlier for trip duration was Healthy Ride Hub which exceeded the successor by double.
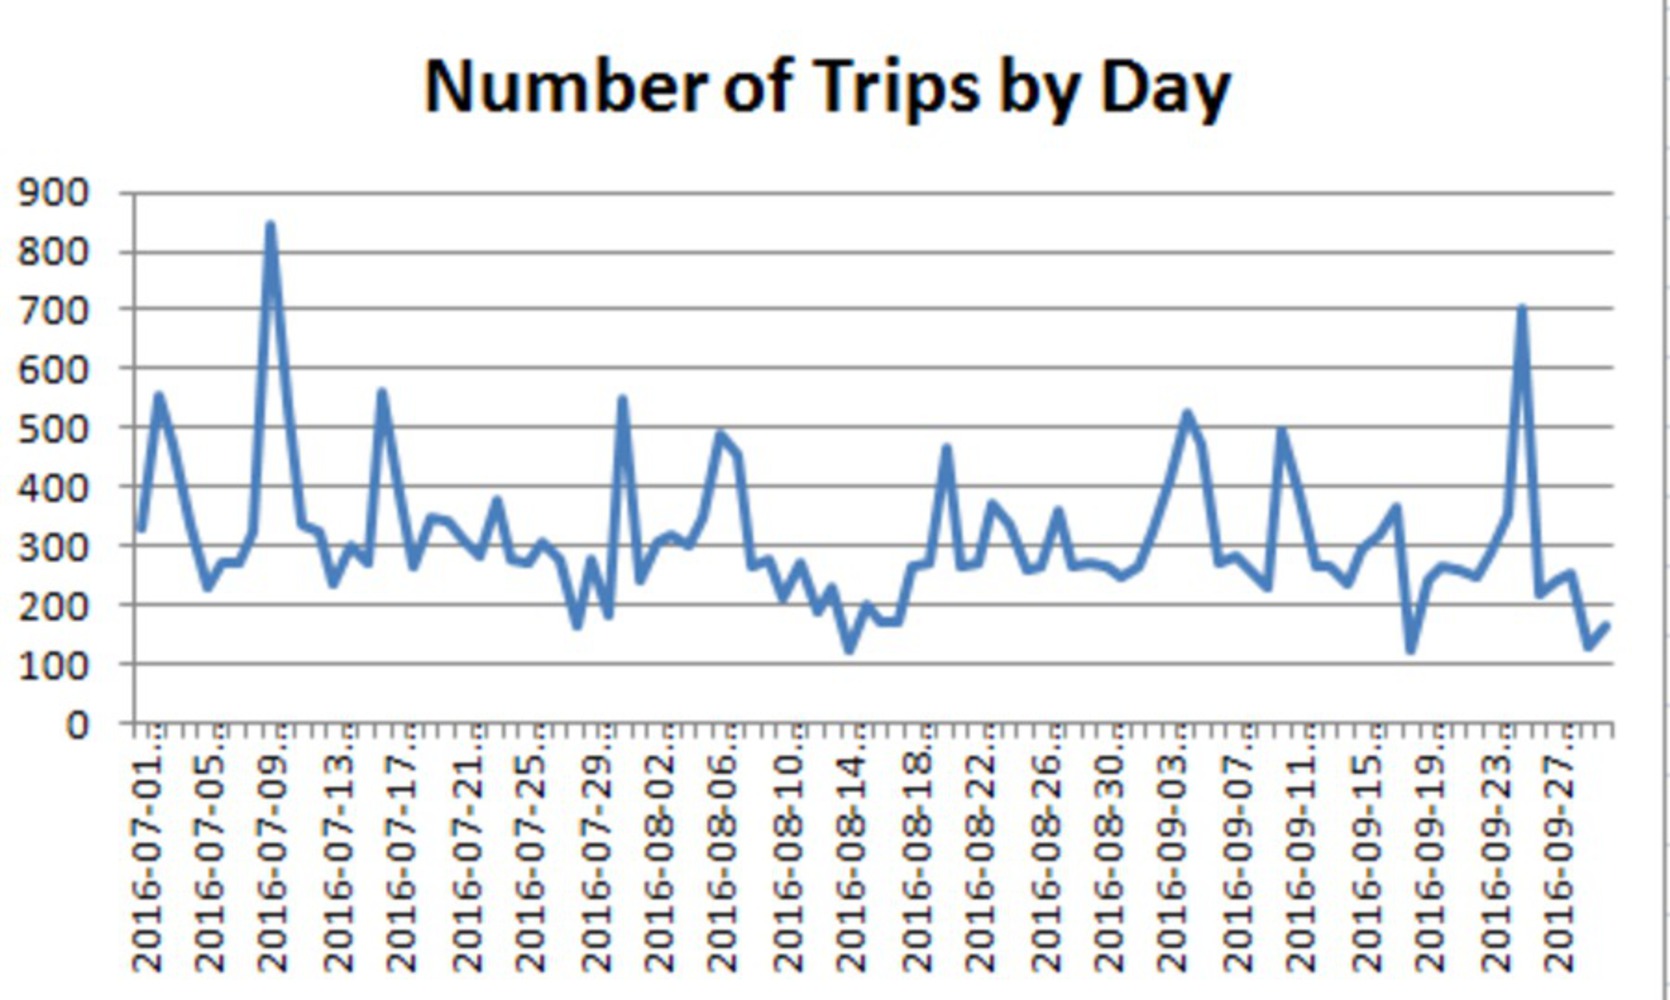
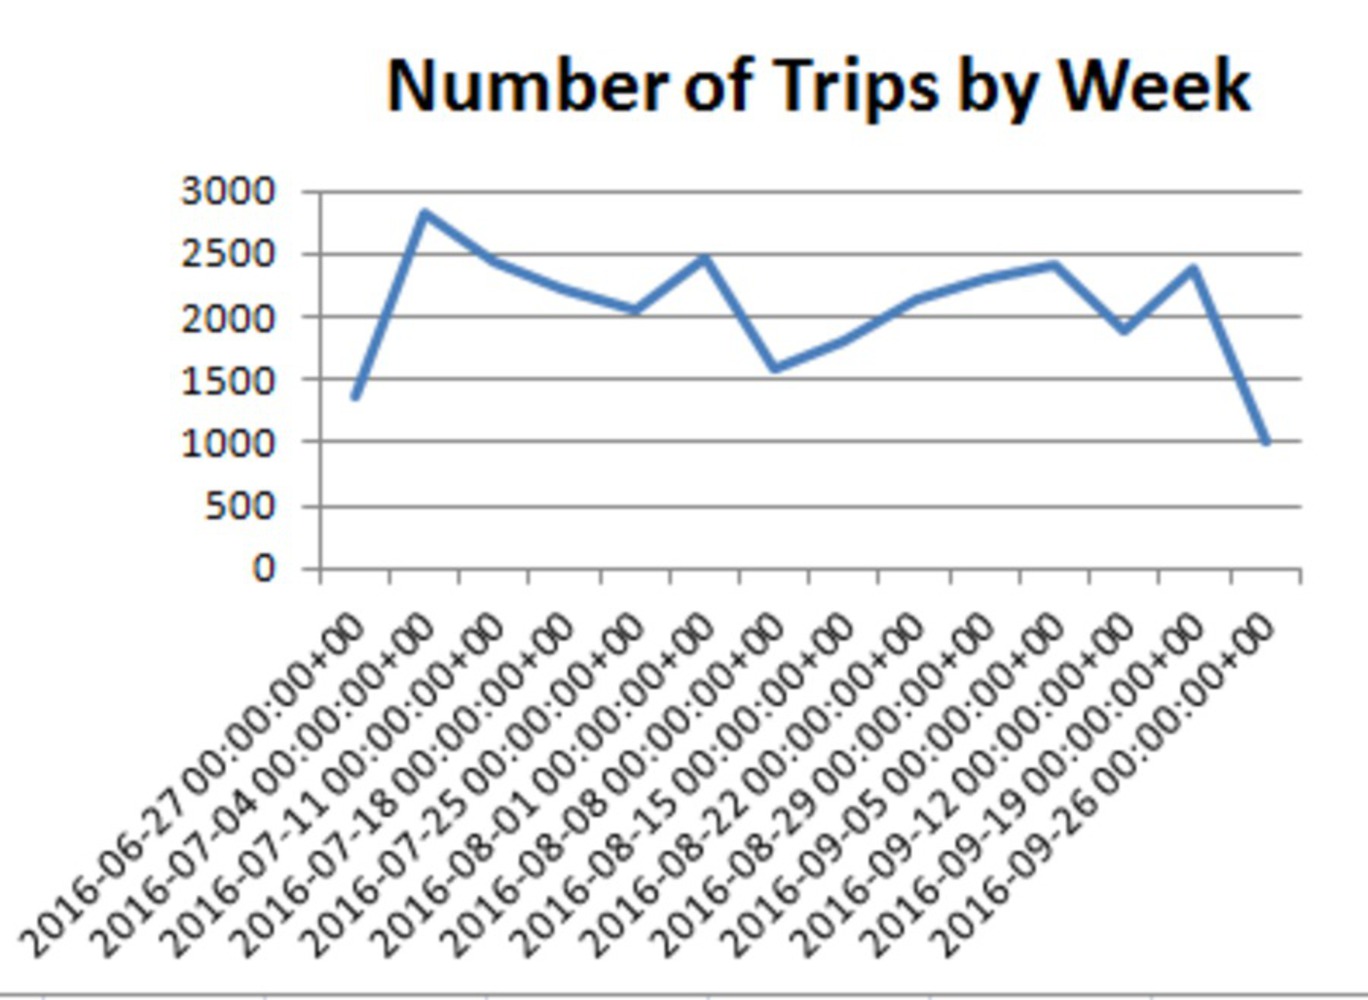
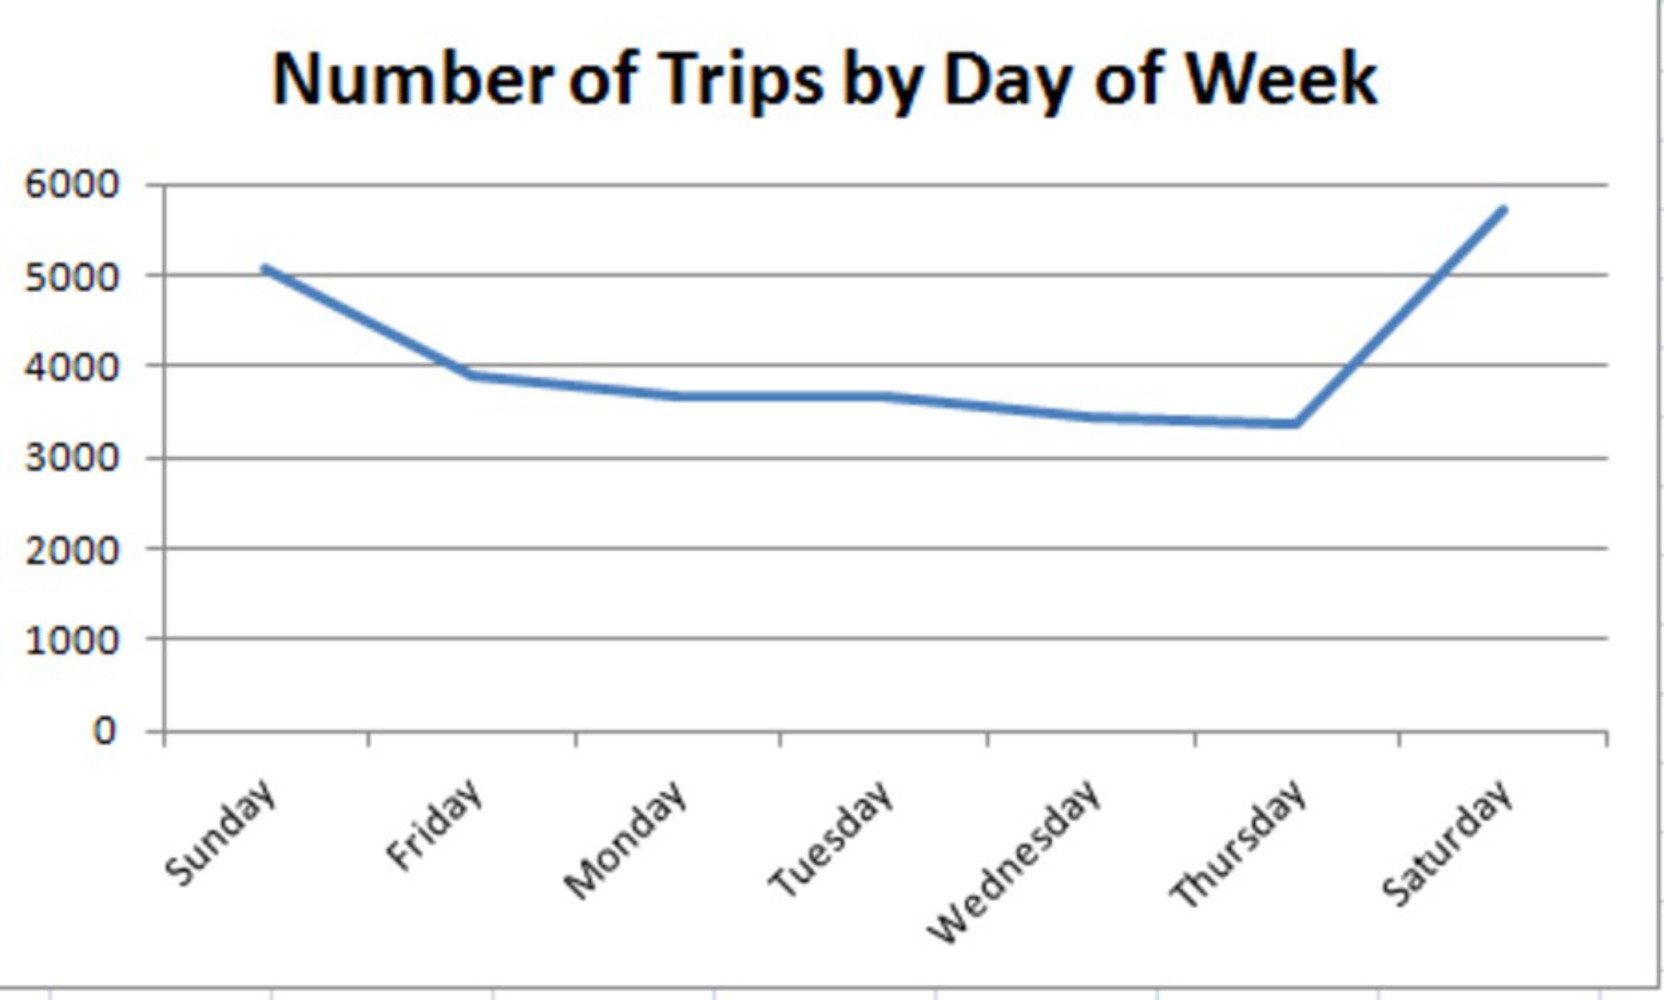
As far as time is concerned, July seemed to be the most popular of the summer-to-fall transition months with 10,874 trips. September followed by 9,196 trips an August brought in the rear end with 8,772 trips. When daily trips are analysed, most peaks can be attributed to weekends.
I hope to take the study done in the Social City module further and be able to better understand the way in which real estate functions beyond those that we see in dry formats of land use and zoning. Using Social Media data, I was able to better understand the nature of use of real estate properties in Pittsburgh by overlapping it against 'use'. I intend to use a similar layer to overlap on the current 'Moving City' data and be able to understand that despite the impressive number of bike shares available and its promotion, is commuting to work via bikes or bike share programs viable? As green as this mode of transport is, is it truly possible to be able to work downtown and be able to bike there?
I think it would help if I understood the break off points in the data better. Which is to say that the data presented shows three months (July, August, September of 2016). However, the transition into July and out of September would better explain and contextualize the peaks and dips in the data.
You can upload files of up to 20MB using this form.