Back to Parent

Outcome


Intention

I want to exploring the Healthy Ride bicycle trips generated in OpenStreet PGH events (May 28th, and June 25th) to see the location correlationship between cycling trips and event spaces(open streets) and other venues around the city. It would be good to see whether there is a concentration of trip destinations patterns throughout the time of the event, and location of the event space.

Dataset

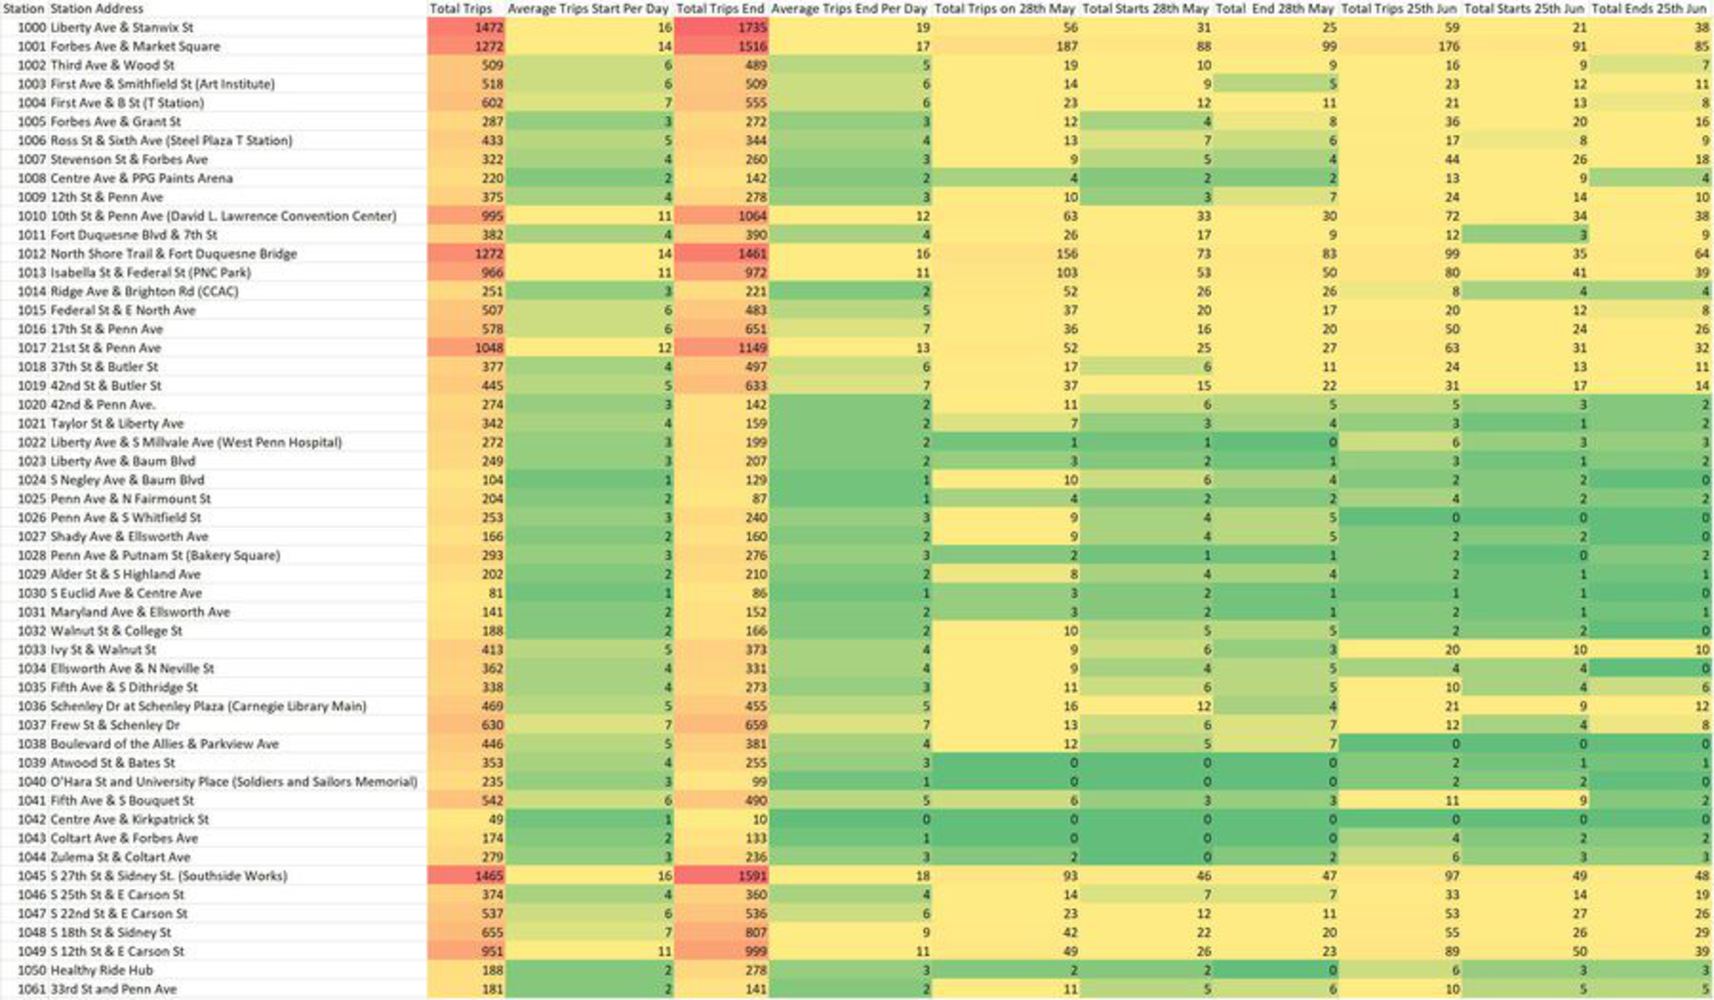
I used the 2017 Q2 Health Ride Rental Data from South Western Pennsylvania Regional Data Center, and filtered out dataset to only show cycling trips generated during the event days in May, 28th and June, 25th. These were two day the Openstreets PGH event happened. Also, I have added the venue location data from Foursquare.

Initial Analysis

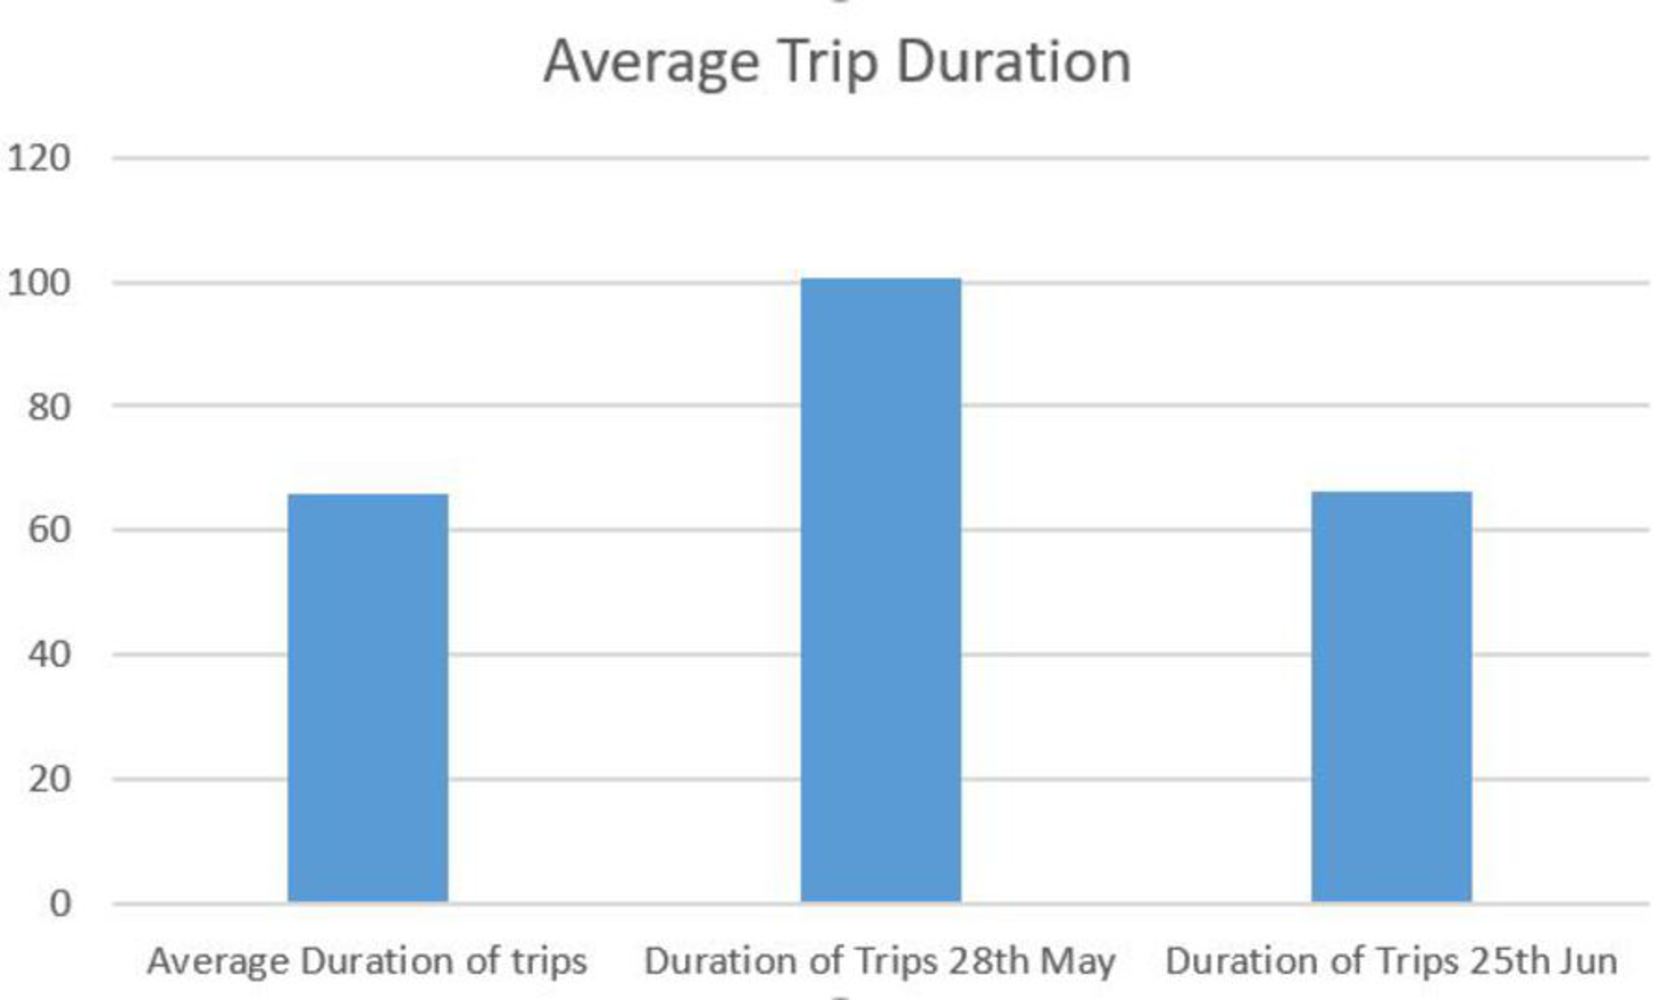
There were 1337 total trips generated in two events. 678 trips were generated on 28th, May's Openstreets event and 659 on 25th, June. The average trip duration was 4991 seconds, which was about 83 mins. The average cycling duration was long than regular average trip duration from 4/1/2017 to 6/30/2017, which was 65 mins on average. It indicated a increased ridership during the event.

Show Advanced Options

Popular stations in through out the Q2, 2017. The size of circle represents the overall usage of each station. The heavily used Liberty Ave & Stanwix  St, which was used as a destination station.

Usage.jpg.thumb
Show Advanced Options

Exploration

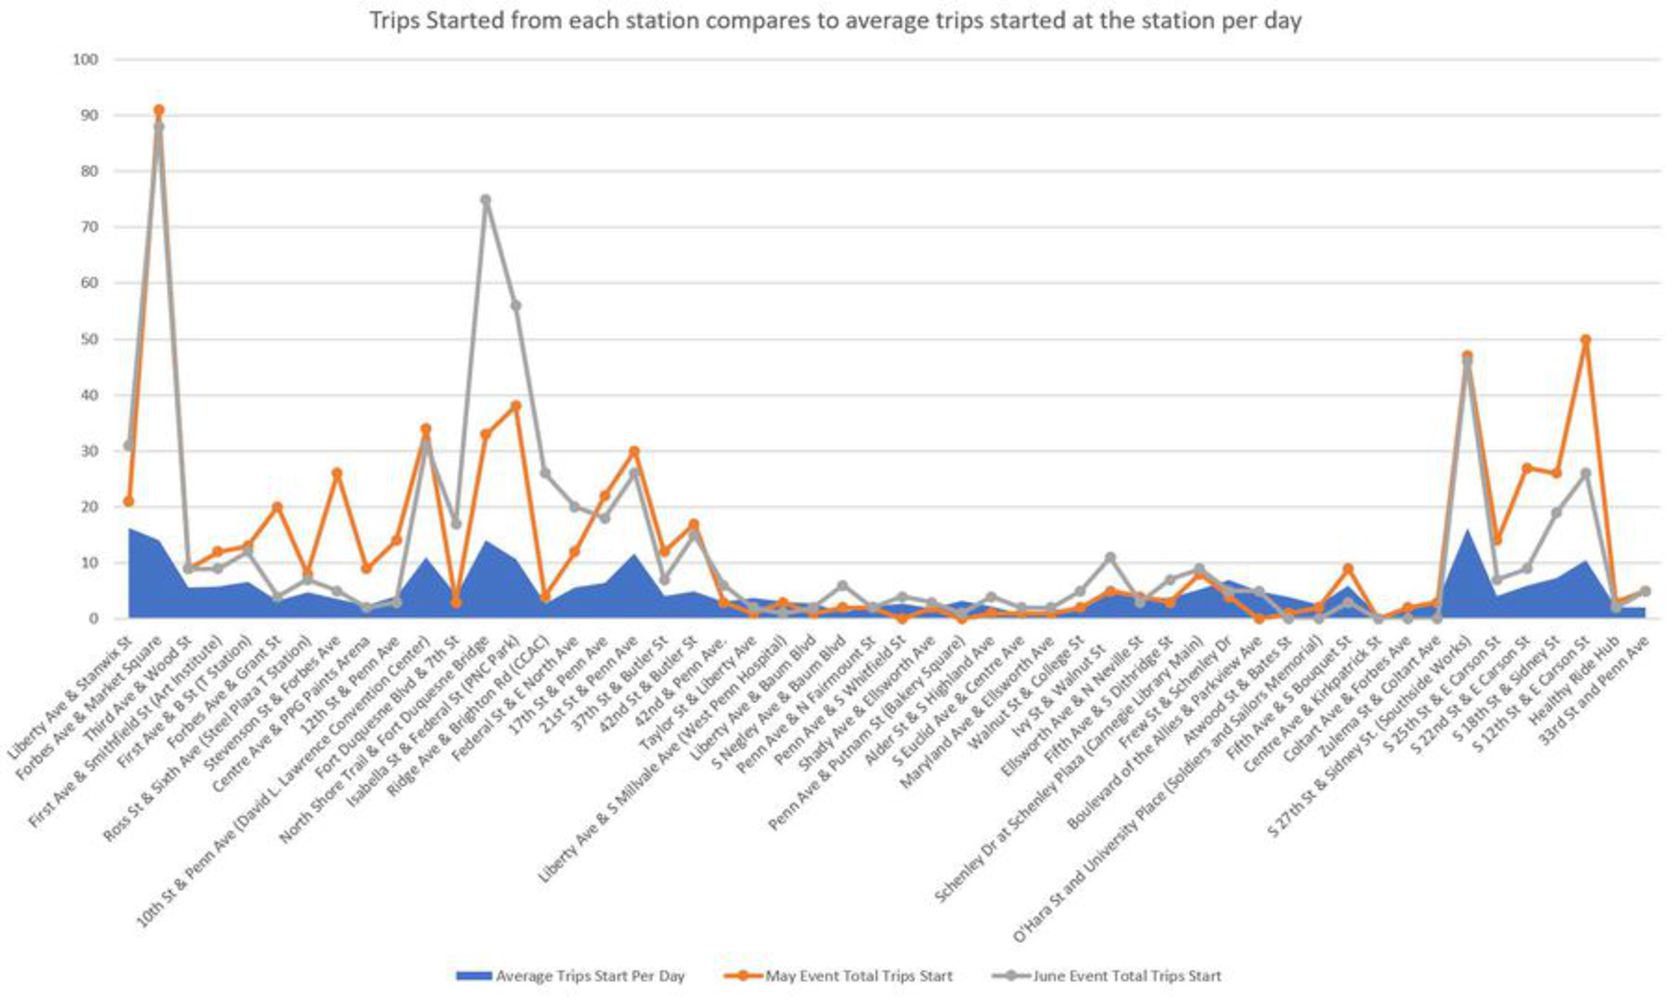
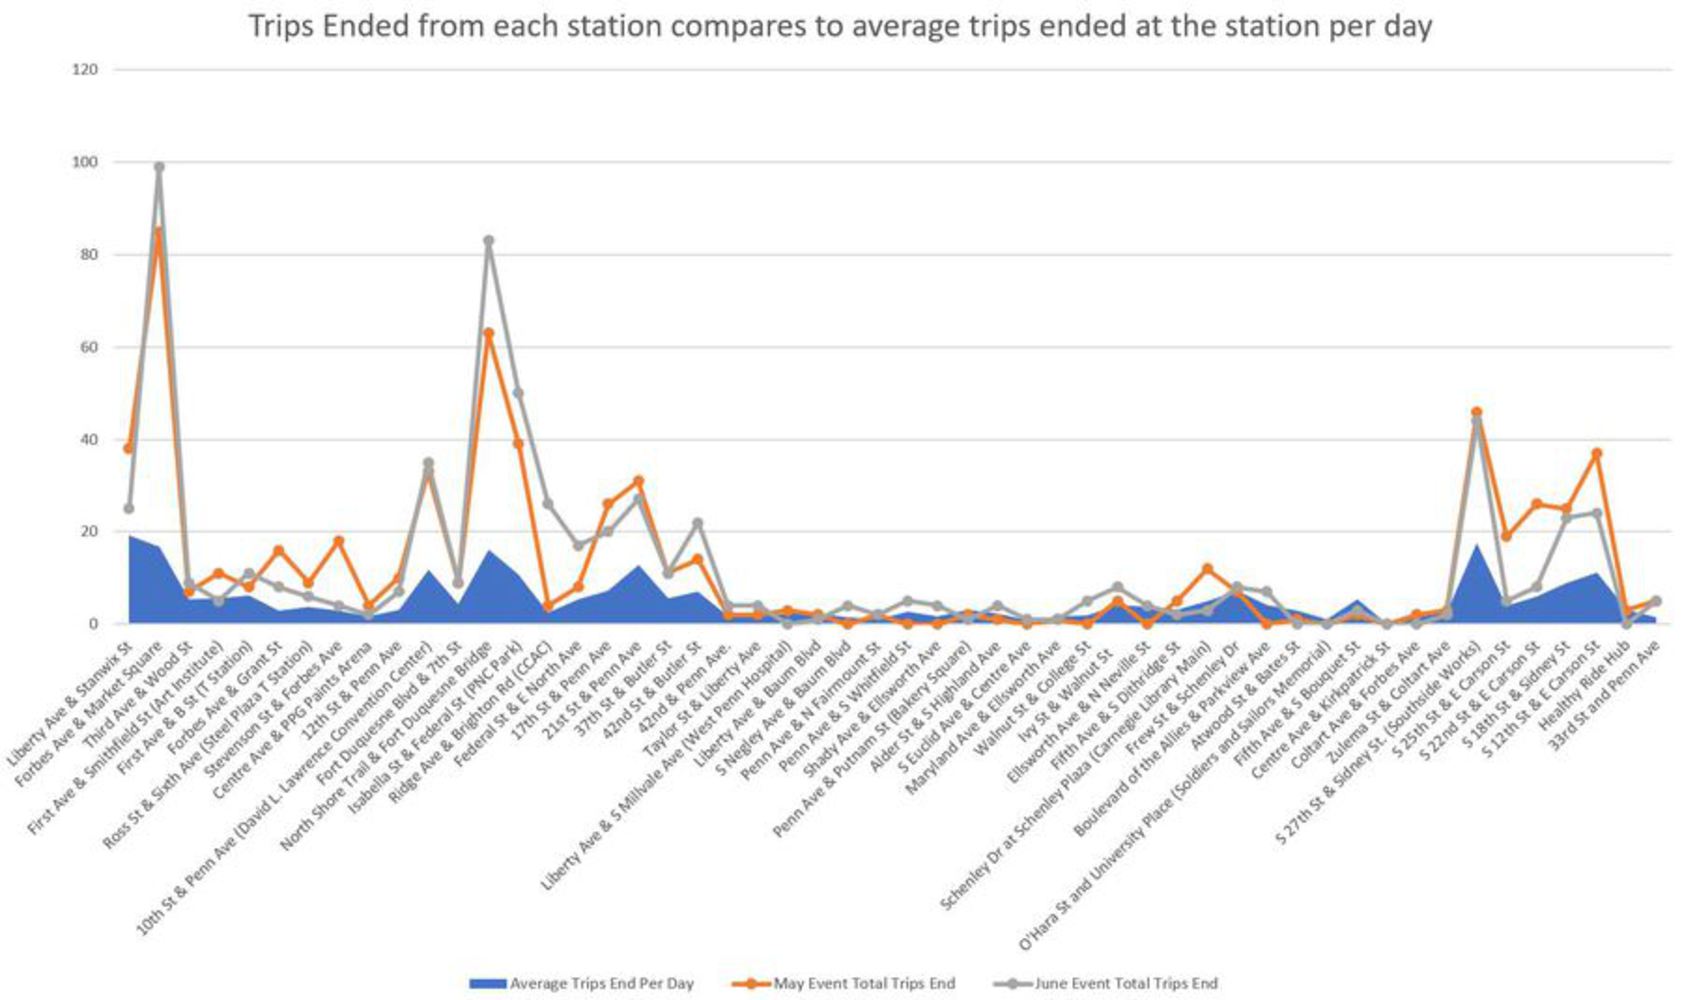
The overall usage of the certain locations of the bike share program followed the regular days' pattern pretty much. Certain locations in downtown commercial district, and Strip area's stations were heavily used. Additionally, the events on both days boosted the Healthy Ride Bike share usage significantly.

Show Advanced Options

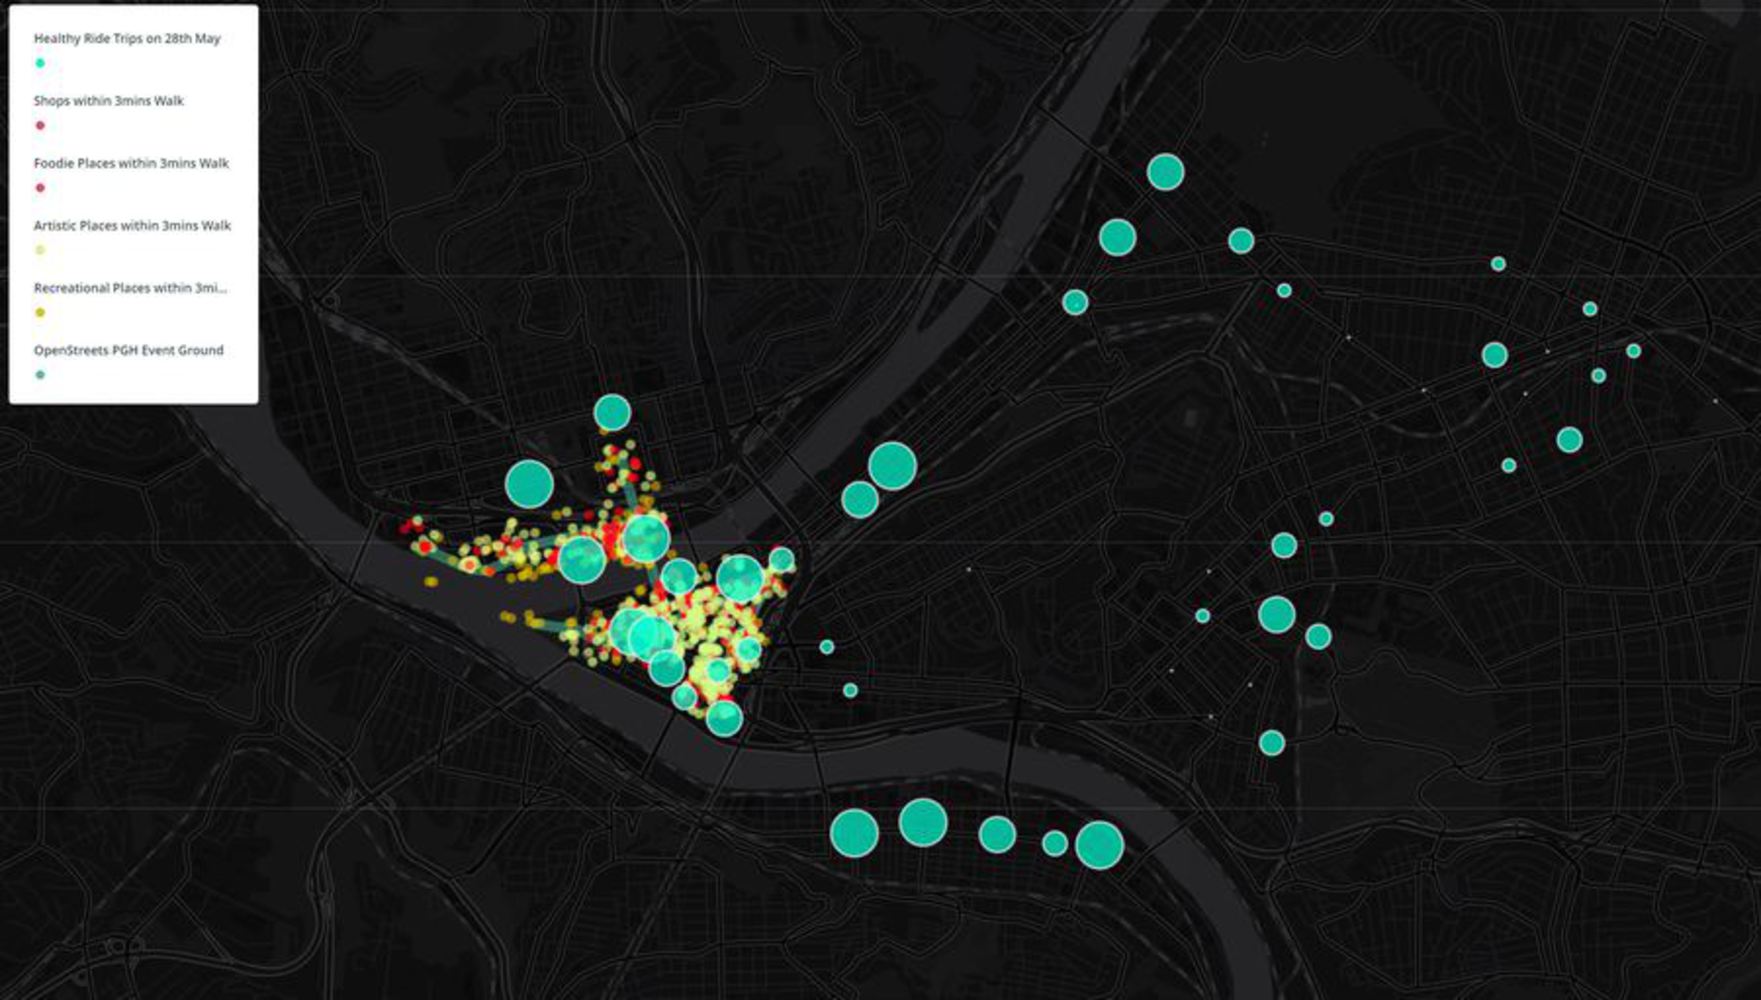
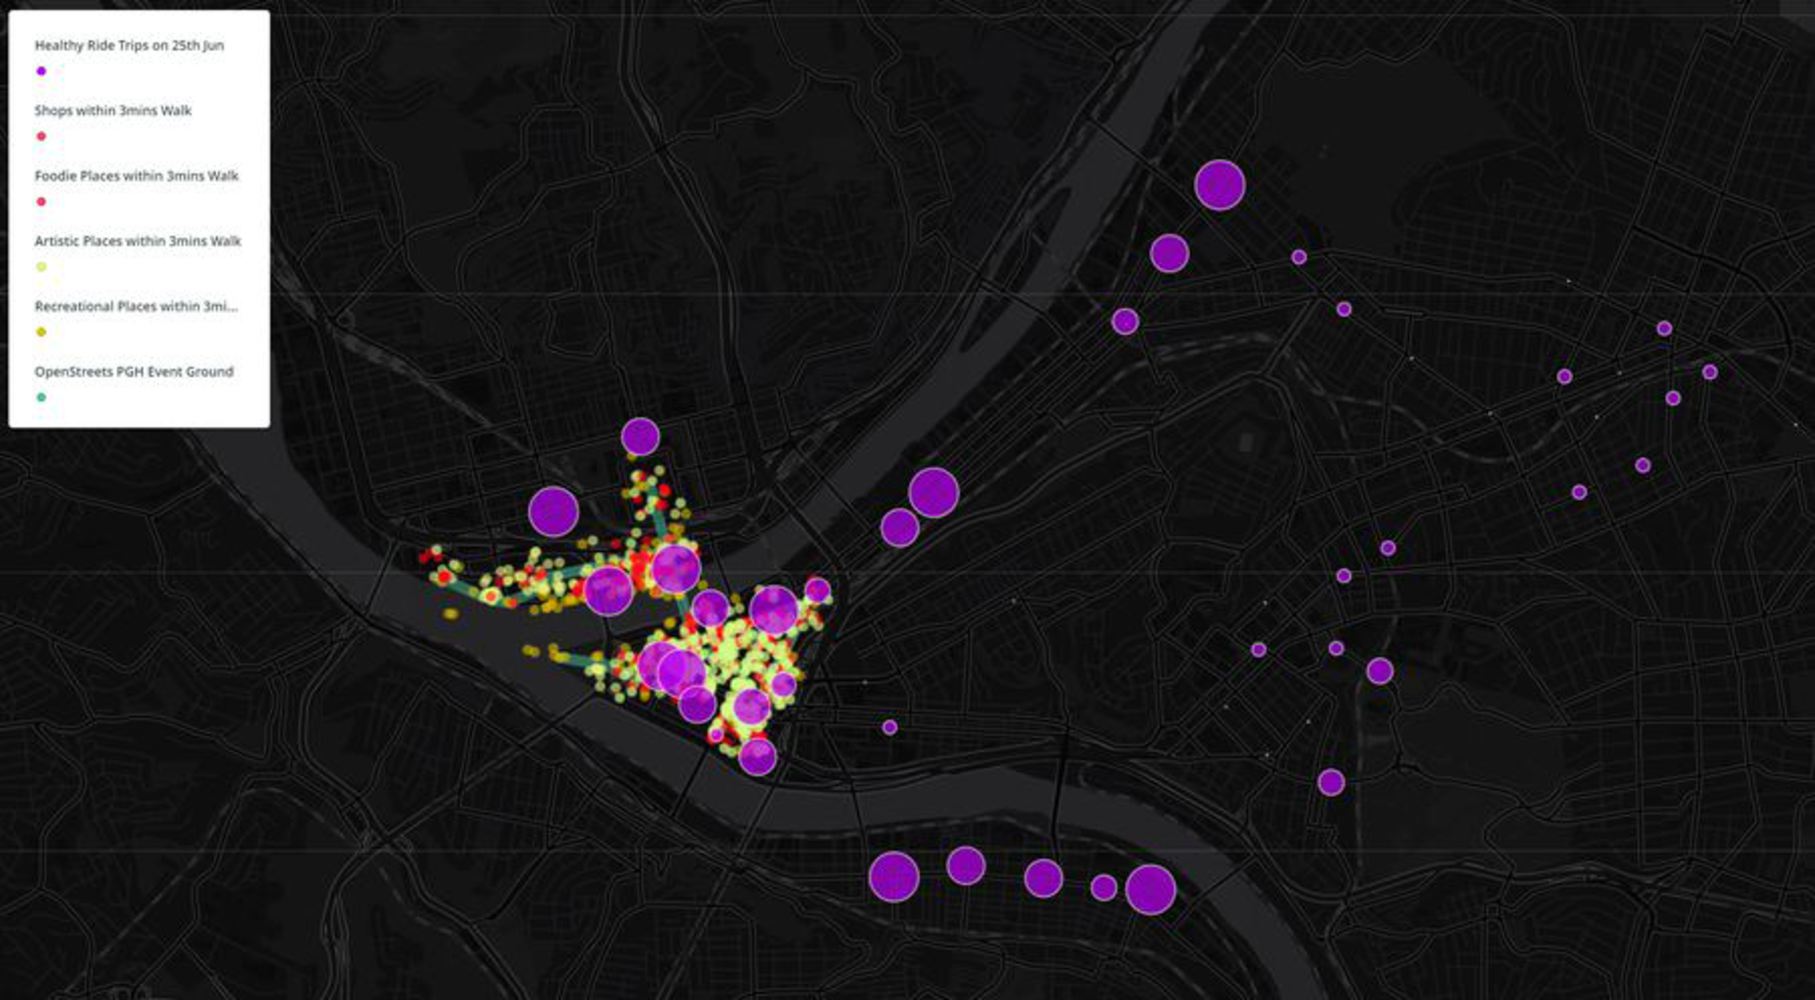
I used the existing venue data to sort out different venue places within 3 mins walk (660 ft) distance to the OpenStreet PGH event routes, including foodie places, shops, recreational places, and artistic places. I can see there was a overlay between event day, including 28th, May and 25th, June, trip locations with the existing popularity station locations.

28th.jpg.thumb
Show Advanced Options
25th.jpg.thumb
Show Advanced Options
1.jpg.thumb
Show Advanced Options
2.jpg.thumb
Show Advanced Options
3.jpg.thumb
Show Advanced Options
4.jpg.thumb
Show Advanced Options
Average trip duration.jpg.thumb
Show Advanced Options

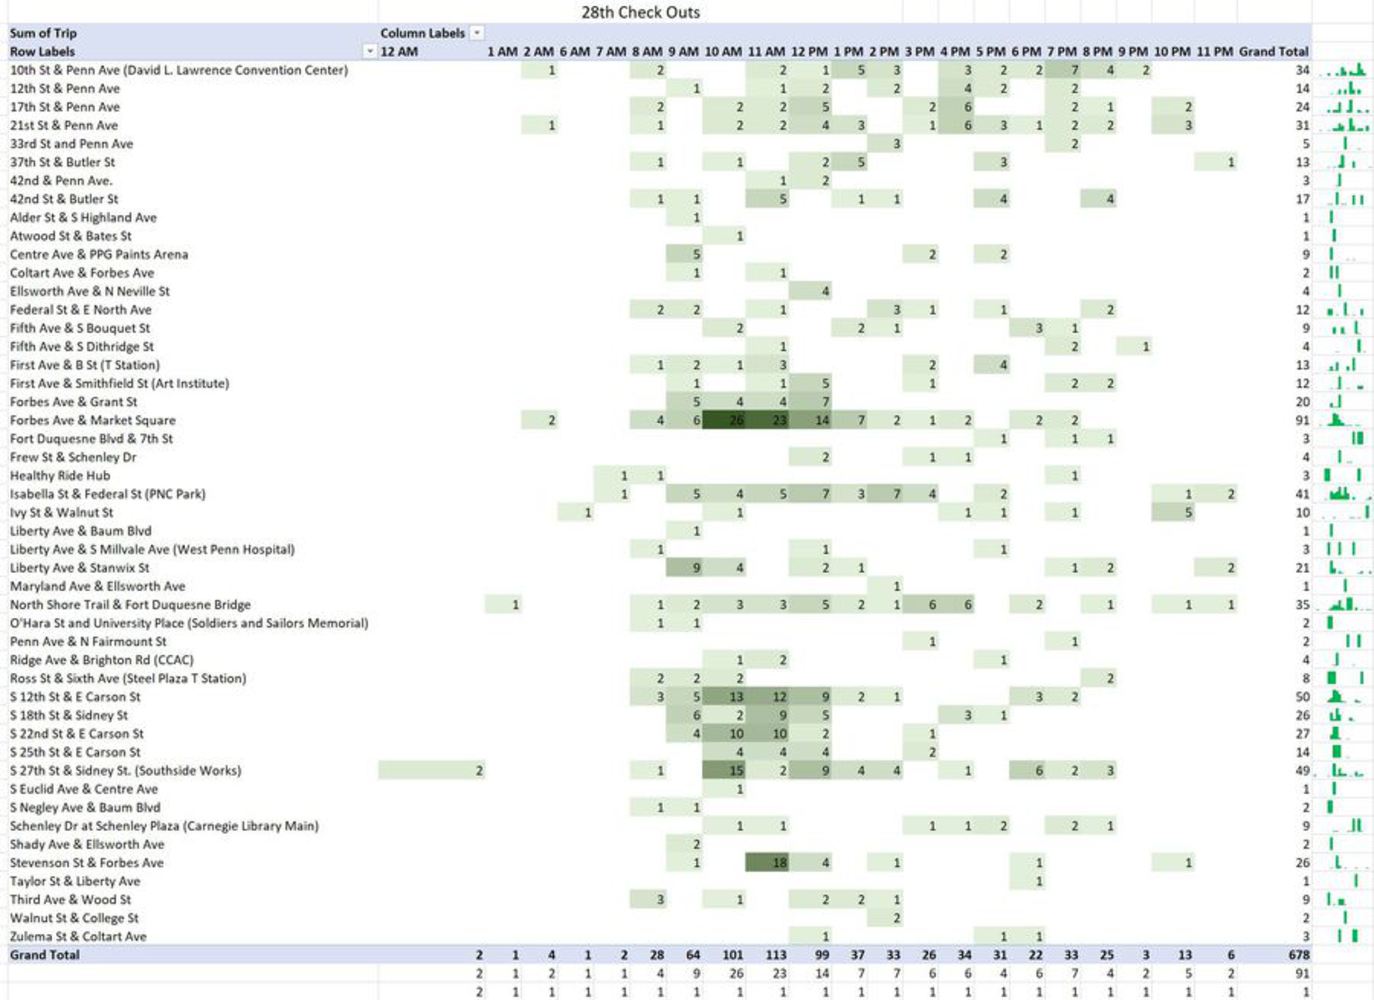
The average trip duration has significant increase on 28th's OpenStreets PGH, however, the trip duration on 25th, June was quite similar to regular day's average trip duration. Altough the trip generated on both day were close, 678 on 28th, May and 659 on 25th Jun. Thus, I selected 28th to further look into the data.


Show Advanced Options
Checkouts.jpg.thumb
Show Advanced Options
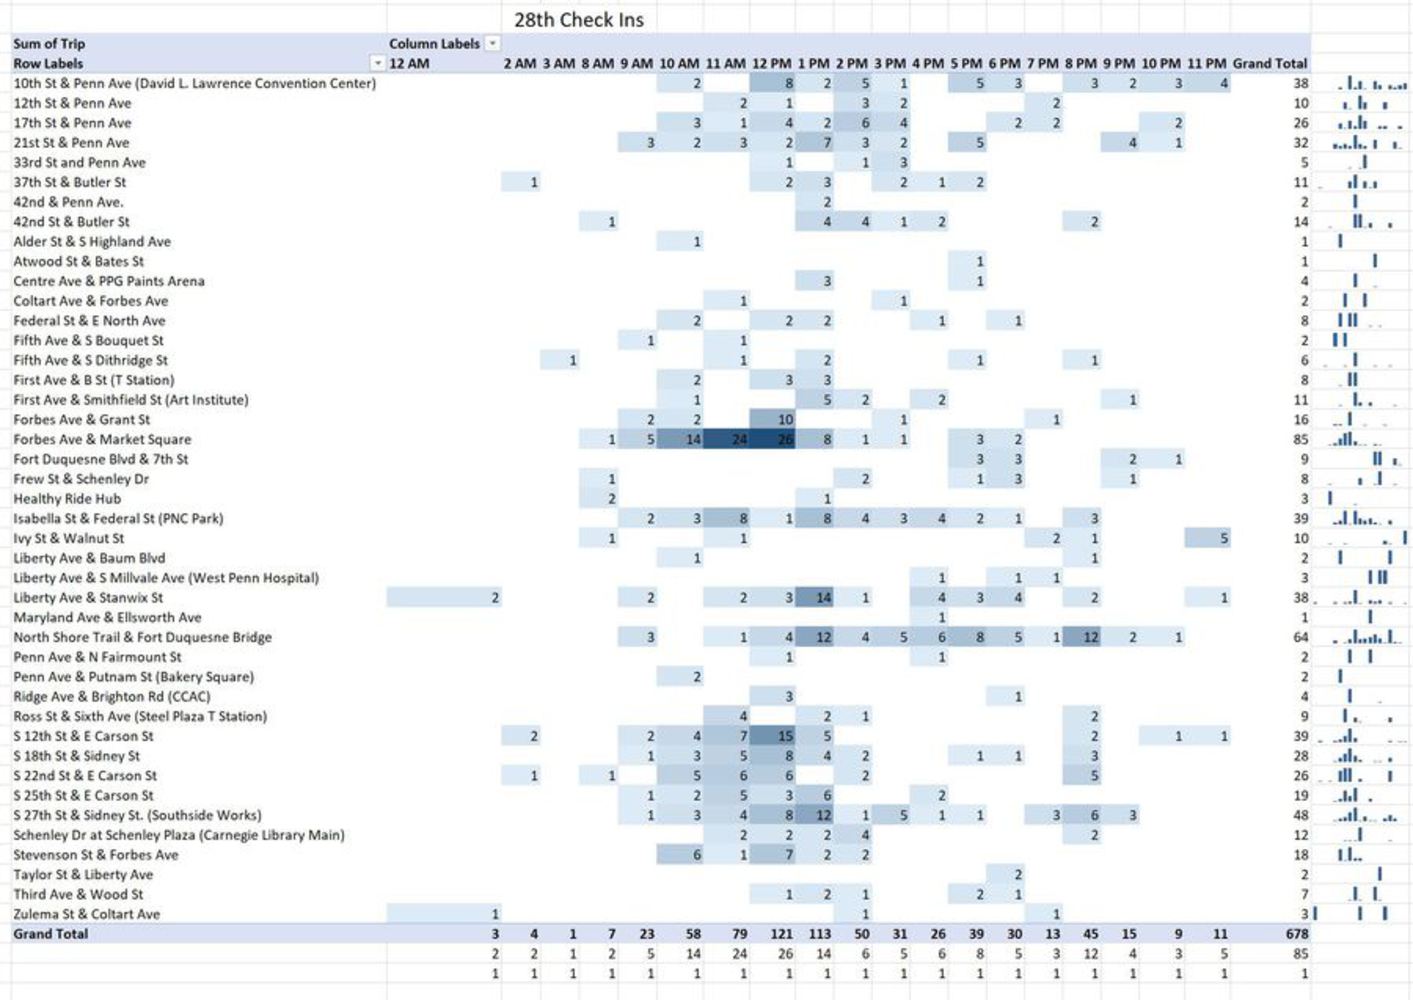
Checkins.jpg.thumb
Show Advanced Options

Future Work

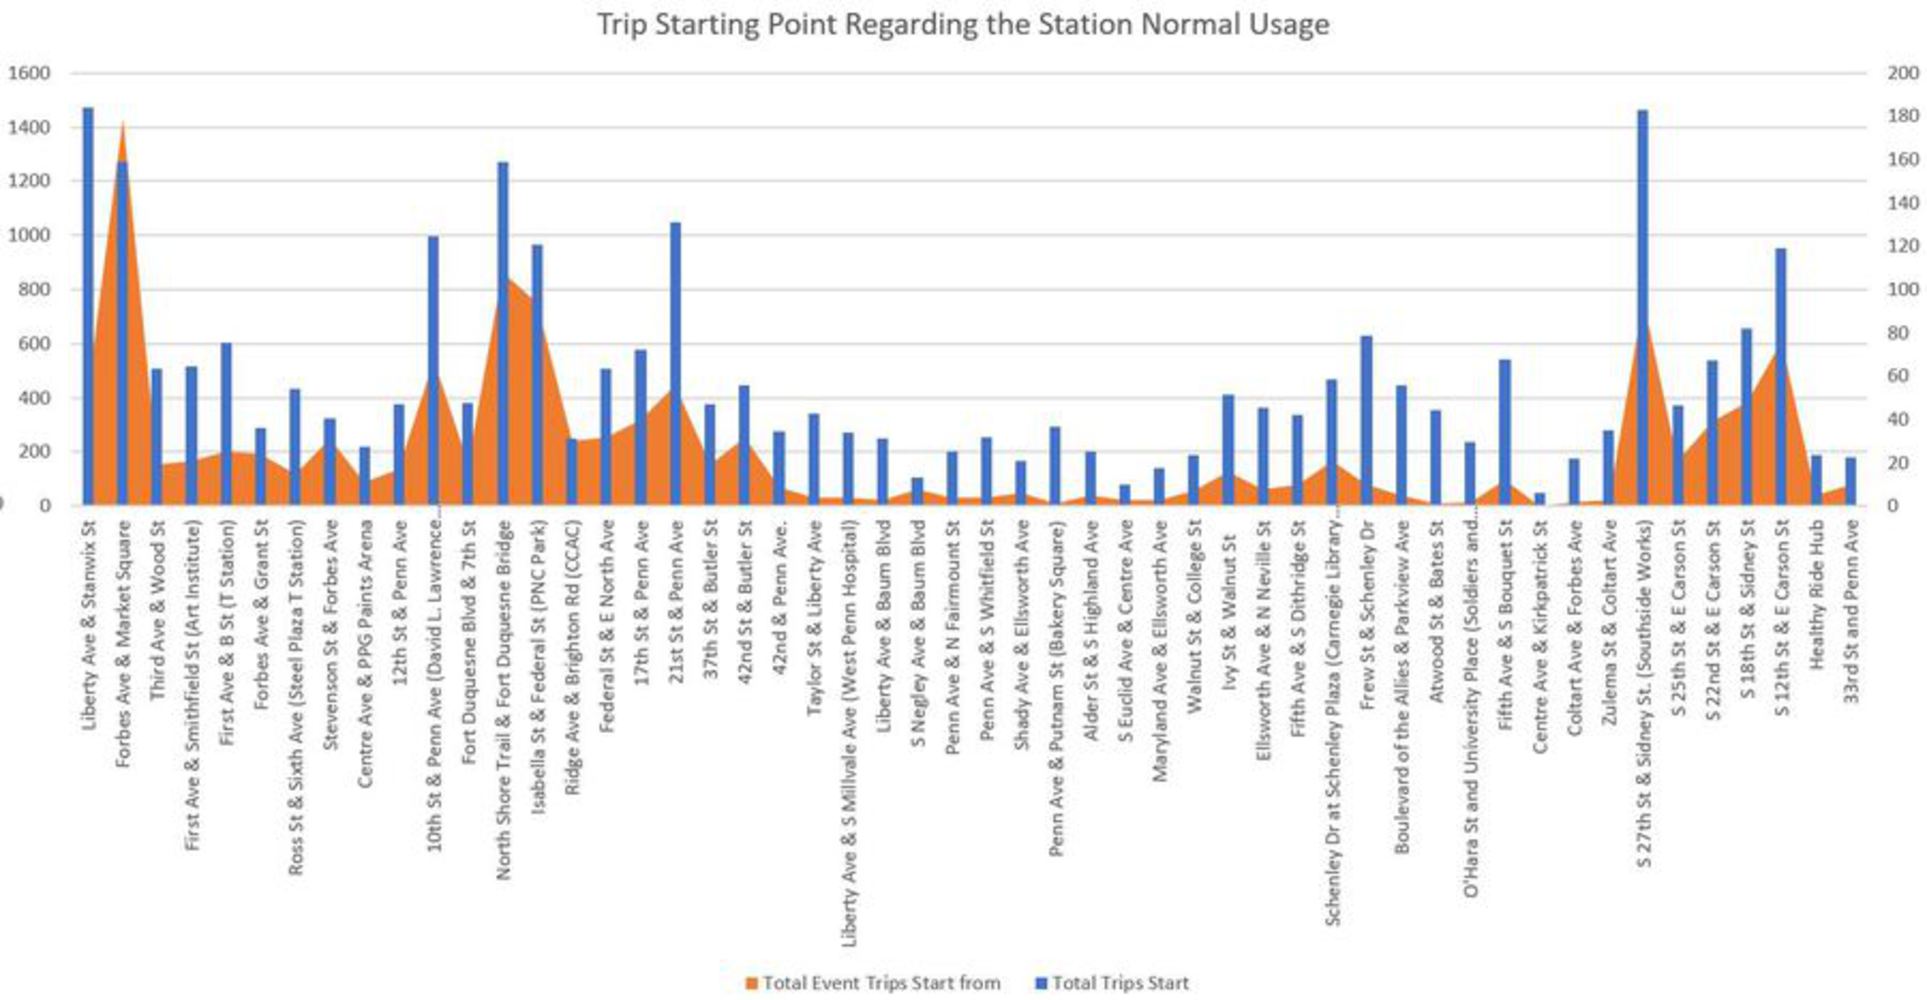
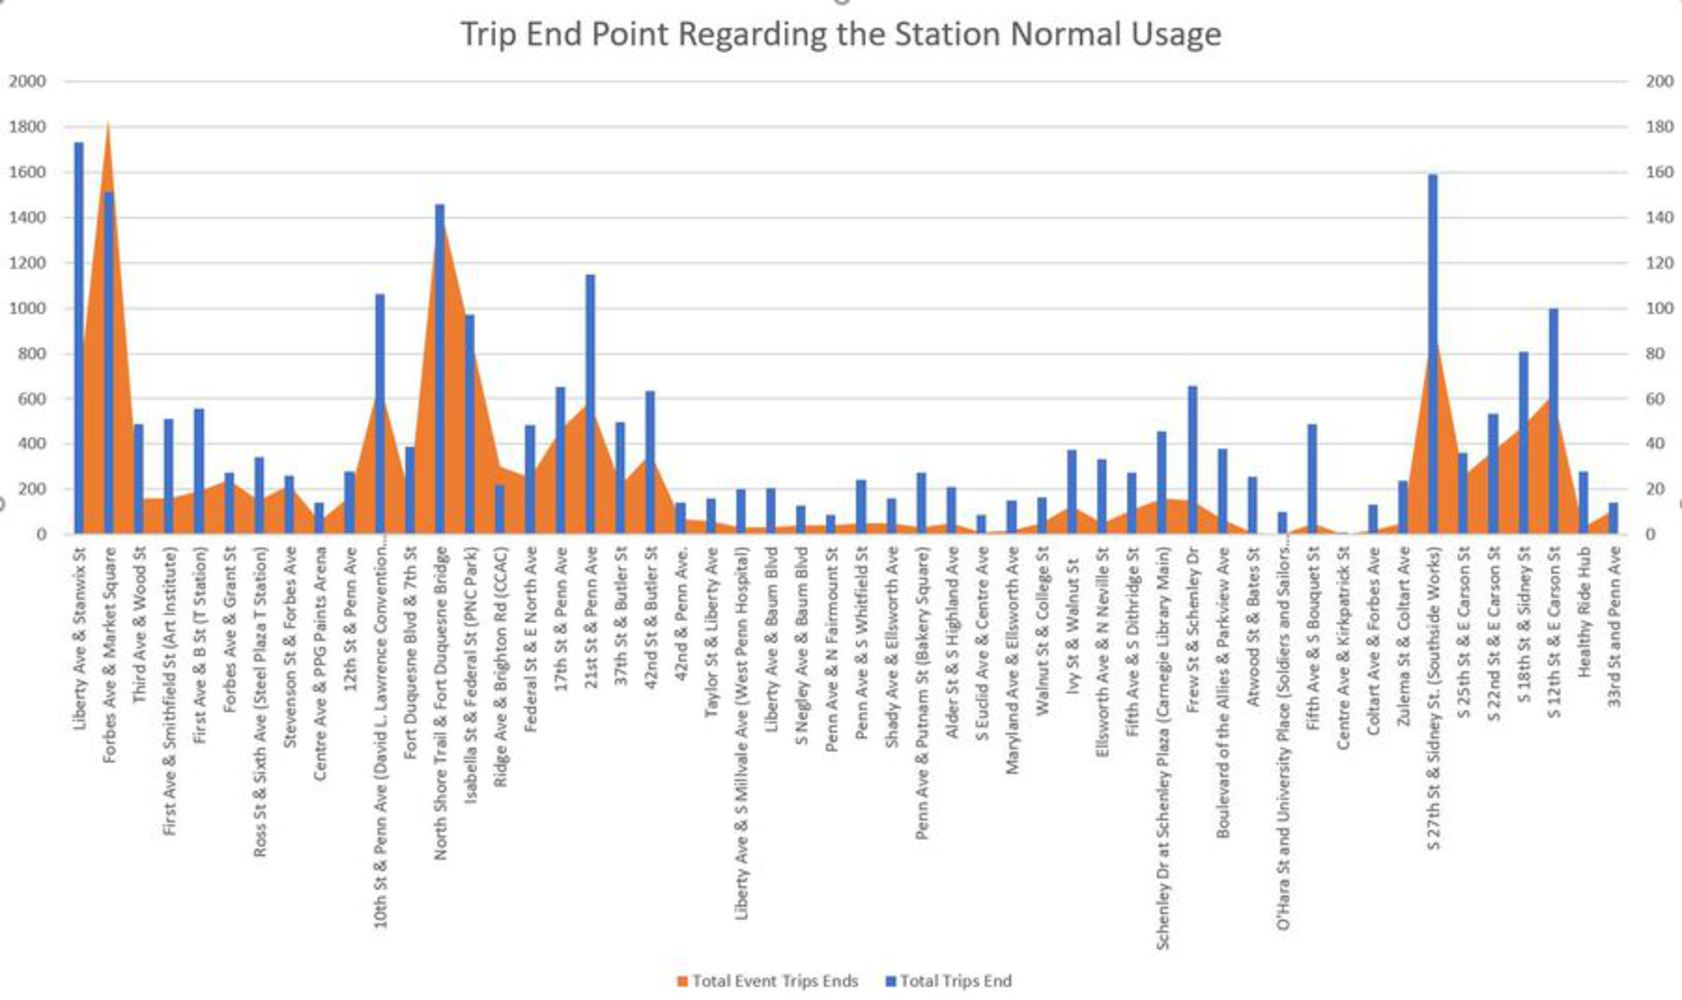
The research reflects the event promoted the cycling culture and Healthy bike rides during the events by generate more trips and increased the duration of the trips. The check ins and outs had certain concentrations at a few stations in commercial districts. The data wasn't enough to reveal other patterns, regarding the the relationships between residential and commercial districts' stations.

It would be nice to compare the trips generated during the weekend with the trips generated during events dates, and see how these type of pedestrian friendly events is promoting the healthy ride activities. Also, it would be better to add directional visualization to the map to show the trips from which part of city to the other locations, and how time change reflects the trip directions. 

Drop files here or click to select

You can upload files of up to 20MB using this form.