Back to Parent

Outcome


Introduction

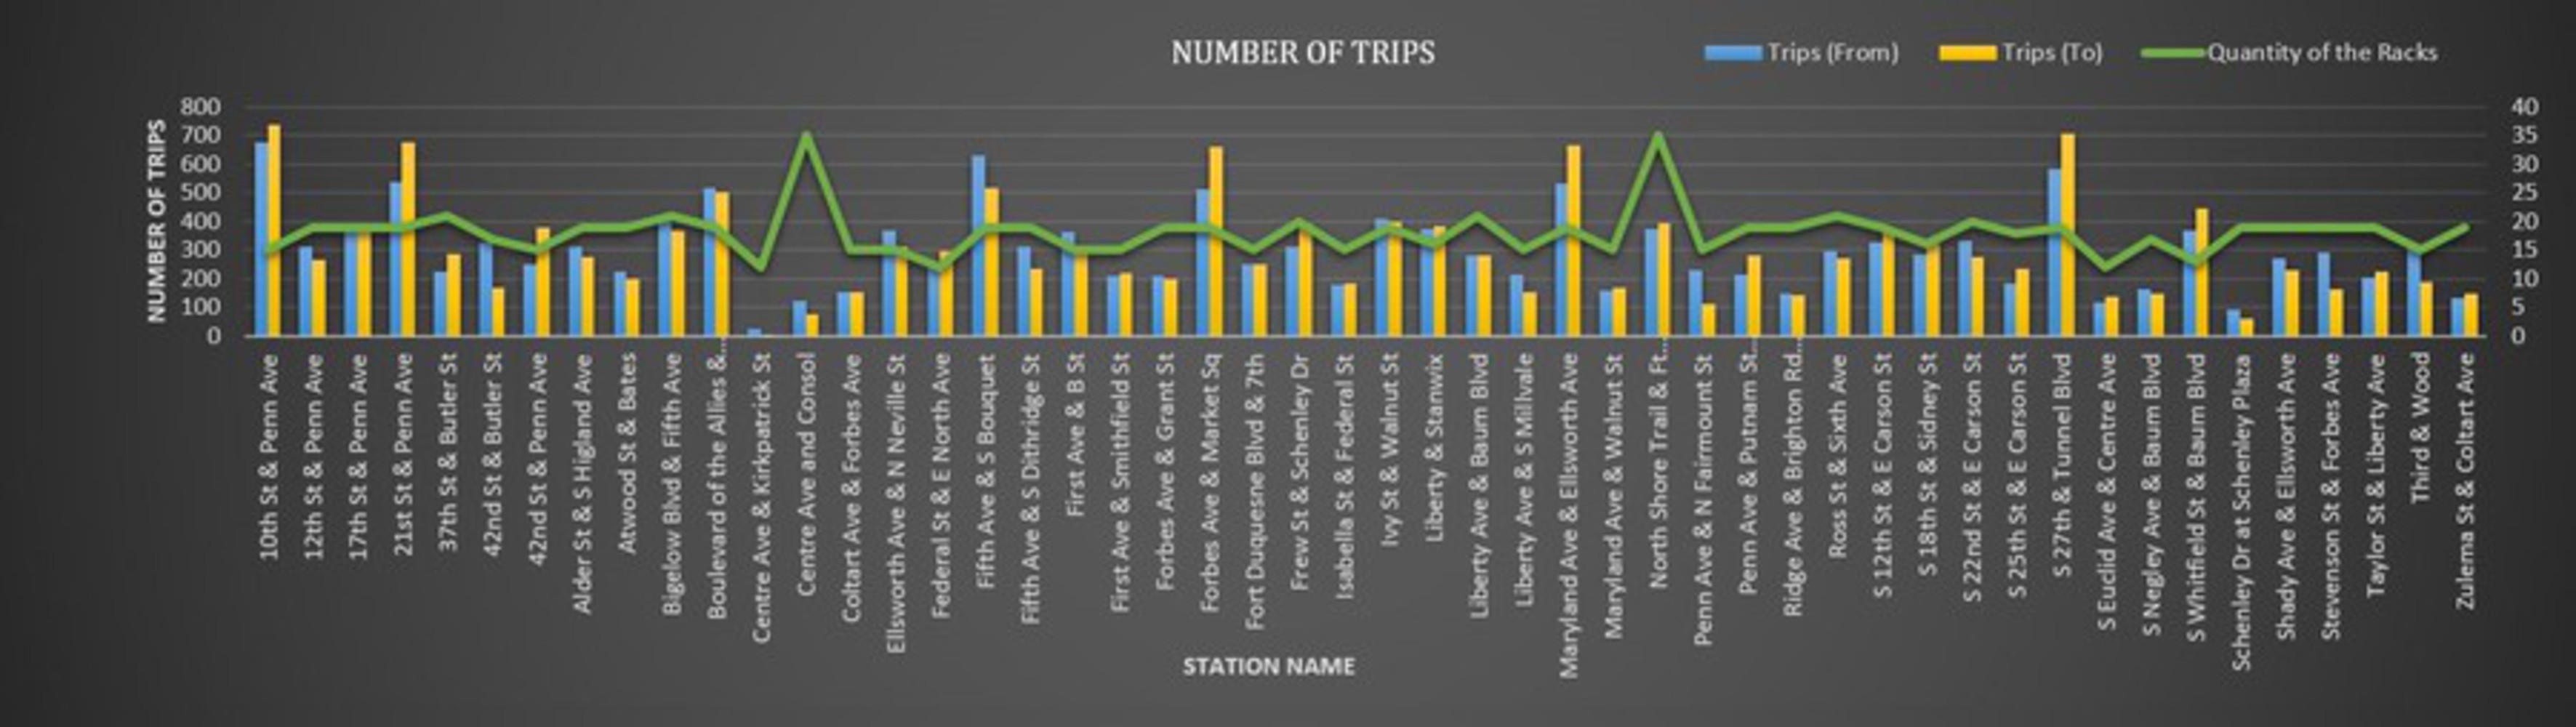
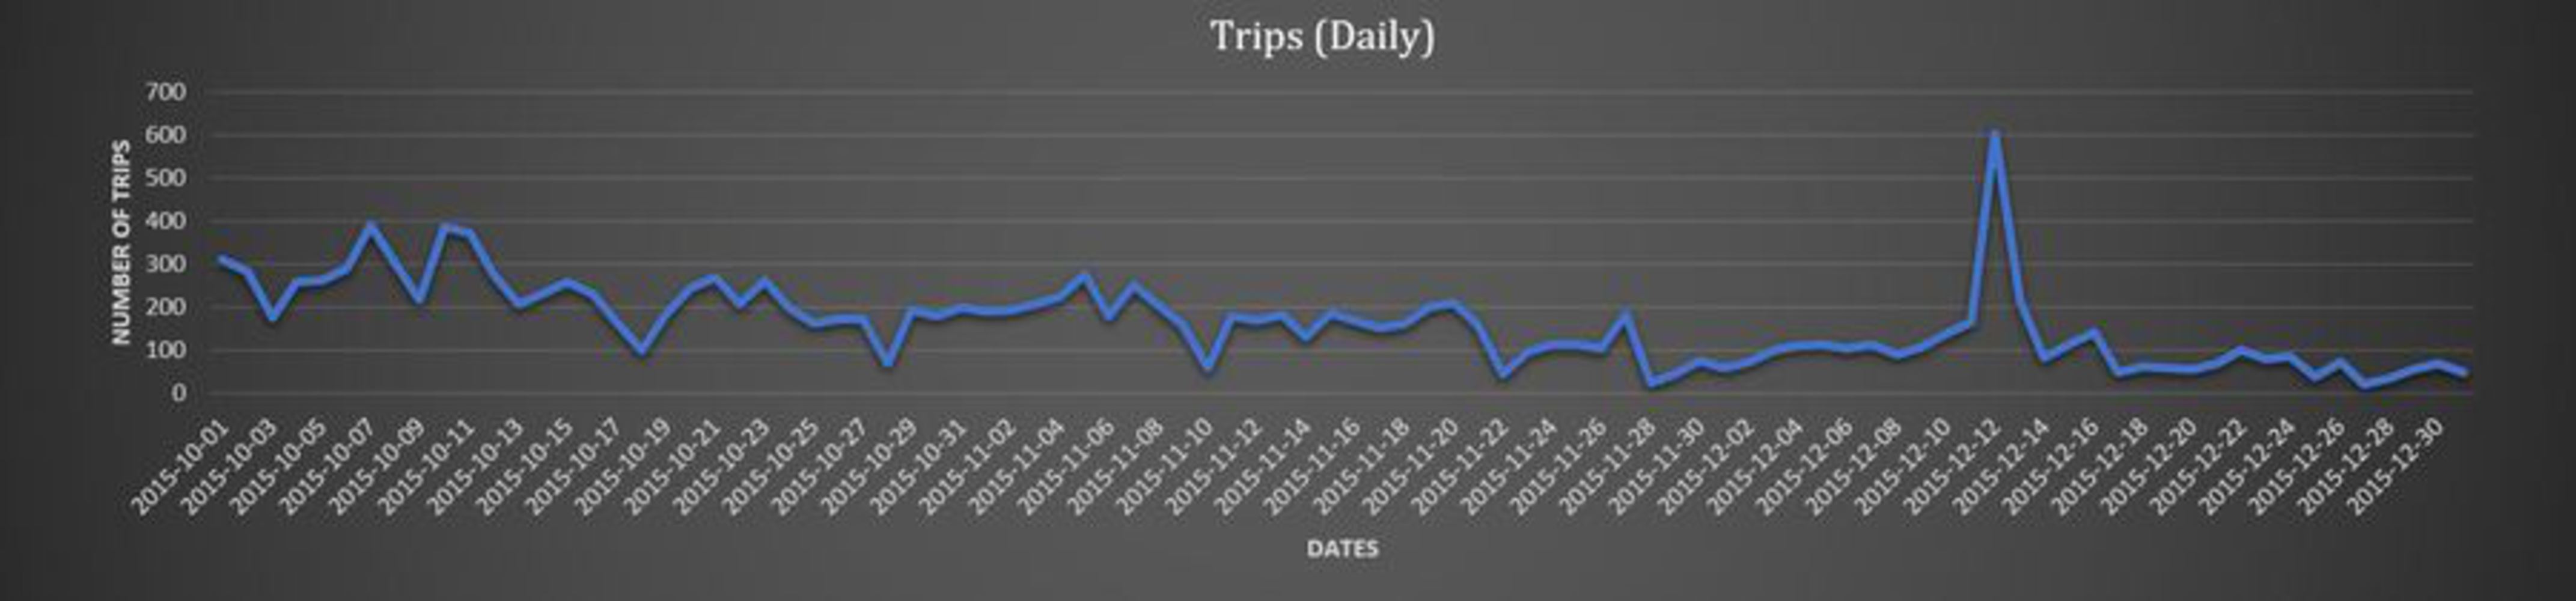
I have used Healthy Ride Trip datasets from the Western Pennsylvania Regional Data Center (WPRDC). I am currently analysing the data for the fourth quarter of 2015. Some of the interesting findings have been – total number of trips made (15134) during the three months using as many as 487 different bikes over 50 bike stations. Here is the link for the database:

https://data.wprdc.org/dataset/healthyride-trip-data

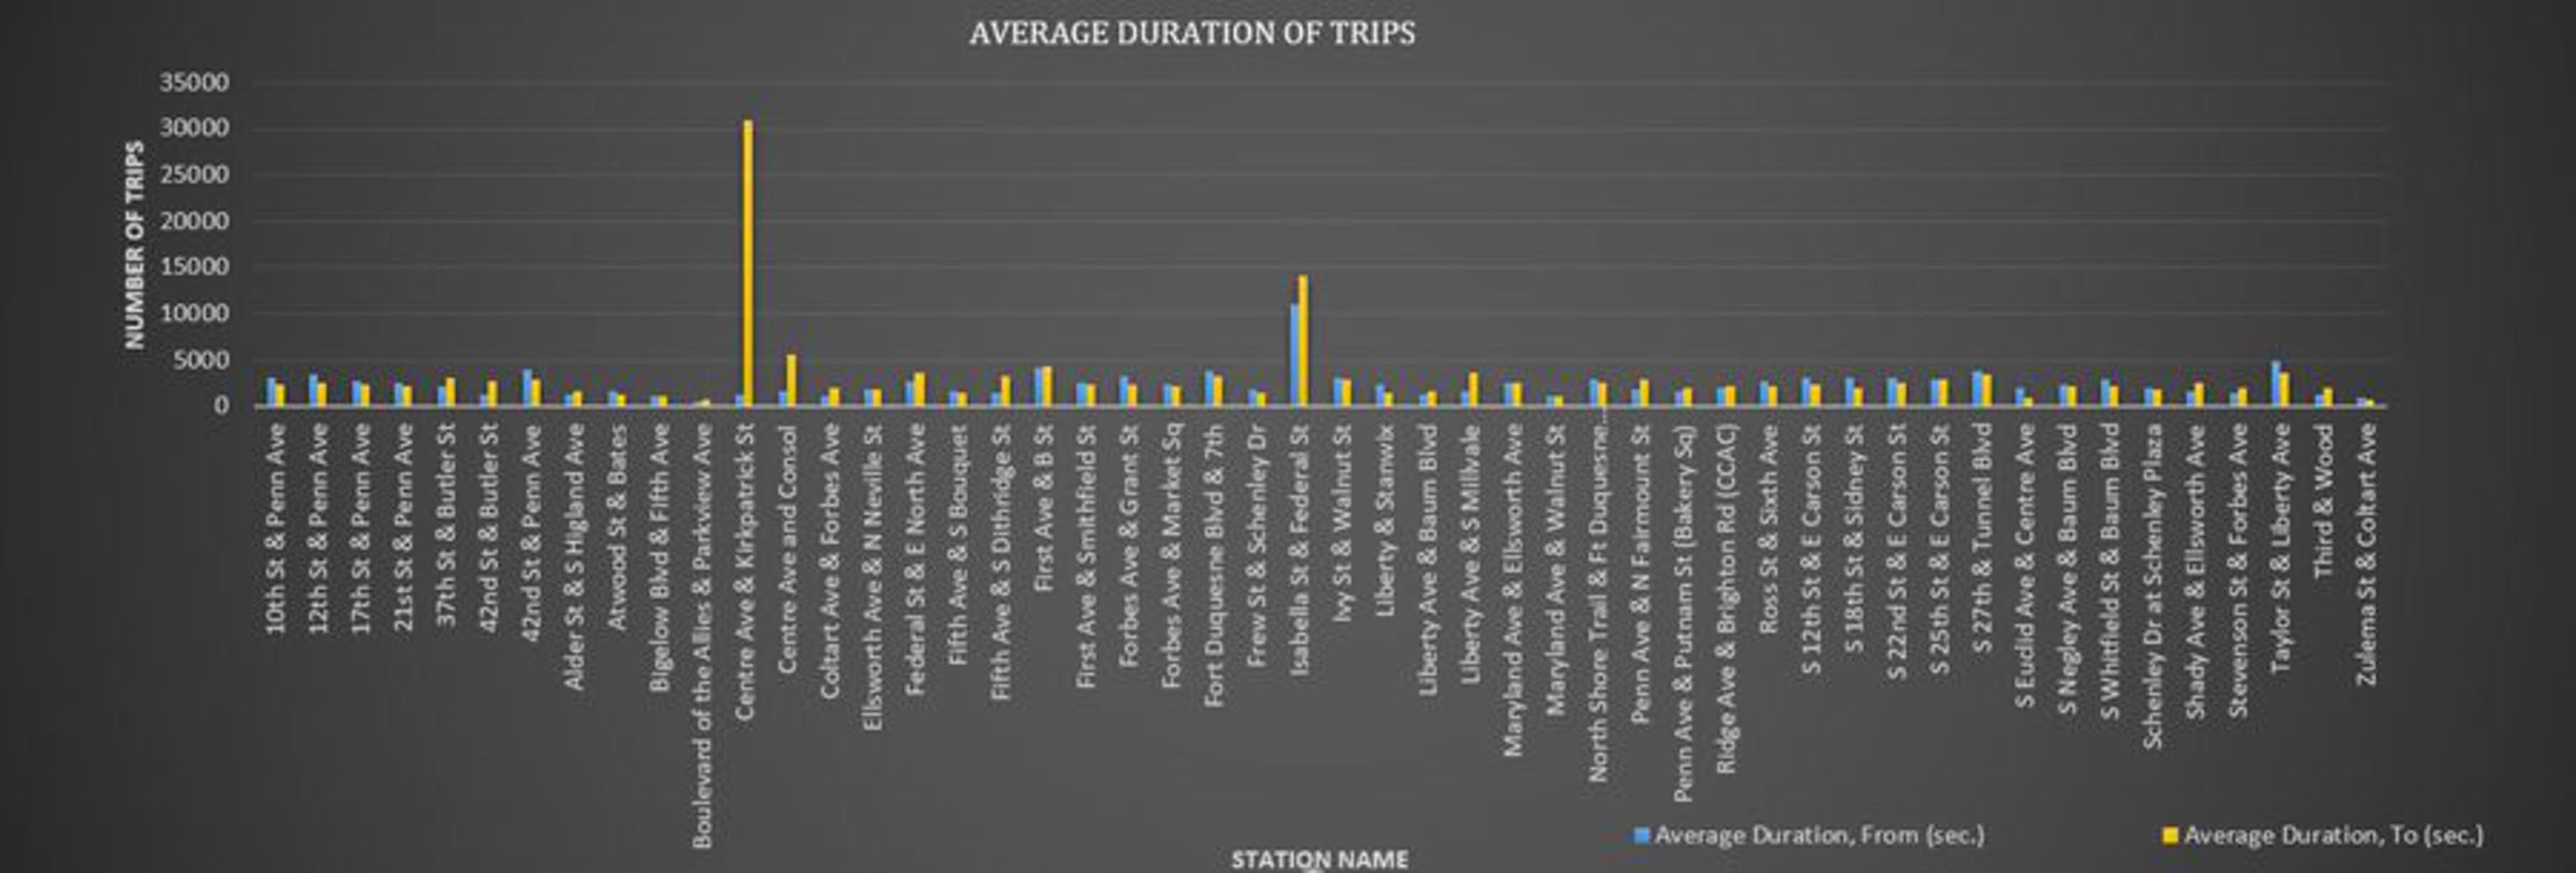
Also, a detailed analysis showed that range of the duration of a trip takes anywhere between 60 seconds and 1.95 (or approximately 2) days with a mean of 2458 seconds (41 minutes). The outliers could be because of different reasons – people with duration of less than 2-3 minutes may have tried out a bike and might not have found some problem and therefore returned the bike to the nearest station. Also, the people who rented a bike for more than a day might have been tourists trying to ride around the city. 

Analysis

Here are the different bike stations around the city caricatured based on the total number of racks available. There is a total of 50 bike stations with the rack quantity ranging from 12 to 35 and the average of 18 racks.

Carto station locations.jpg.thumb
Show Advanced Options

The following graphs show the number of trips and the average trip duration originating or ending at a particular bike station. The general trend shows that the inflow and outflow at any station was comparative. Few stations like 10th Street & Penn Ave, 21st Street & Penn Ave, etc. had very high flows while there was hardly any activity on the Center Ave & Kirkpatrick Street. Also, strangely the station on Center Ave & Consol has got the highest number of racks however, the flow of trips is pretty low. Another graph shows the duration of trips taken from/to a station. The dataset has got two outliers – the bikes going to Center Ave and Kirpatrick has got extremely high outflow. Also, there seems to be a high amount of activity on Isabella St & Federal St.

Number of trips.jpg.thumb
Show Advanced Options
Duration.jpg.thumb
Show Advanced Options

The following graphs show monthly, daily and weekly variations in terms of the bike trips taken. As we would assume the number of trips decrease with the advent of winter. Some of the outliers witnessed in the day-to-day analysis was a high number of trips on 12th December, 2015. The reason could be a Pittsburgh Pirates game that weekend. Also, during a week from 21st December to 28th December, it rained continuously for a week and that’s why the total number of trips were low. Another analysis showing the preference for taking a bike ride on a particular day of the week shows that people prefer biking on a Saturday.

Monthly.jpg.thumb
Show Advanced Options
Weekly.jpg.thumb
Show Advanced Options
Daily.jpg.thumb
Show Advanced Options
Drop files here or click to select

You can upload files of up to 20MB using this form.