Back to Parent

Outcome


Intention

"Pittsburgh has become the first city in the country to offer free bike-share memberships to people who take the train or bus." Molly Hurford, October 2017.

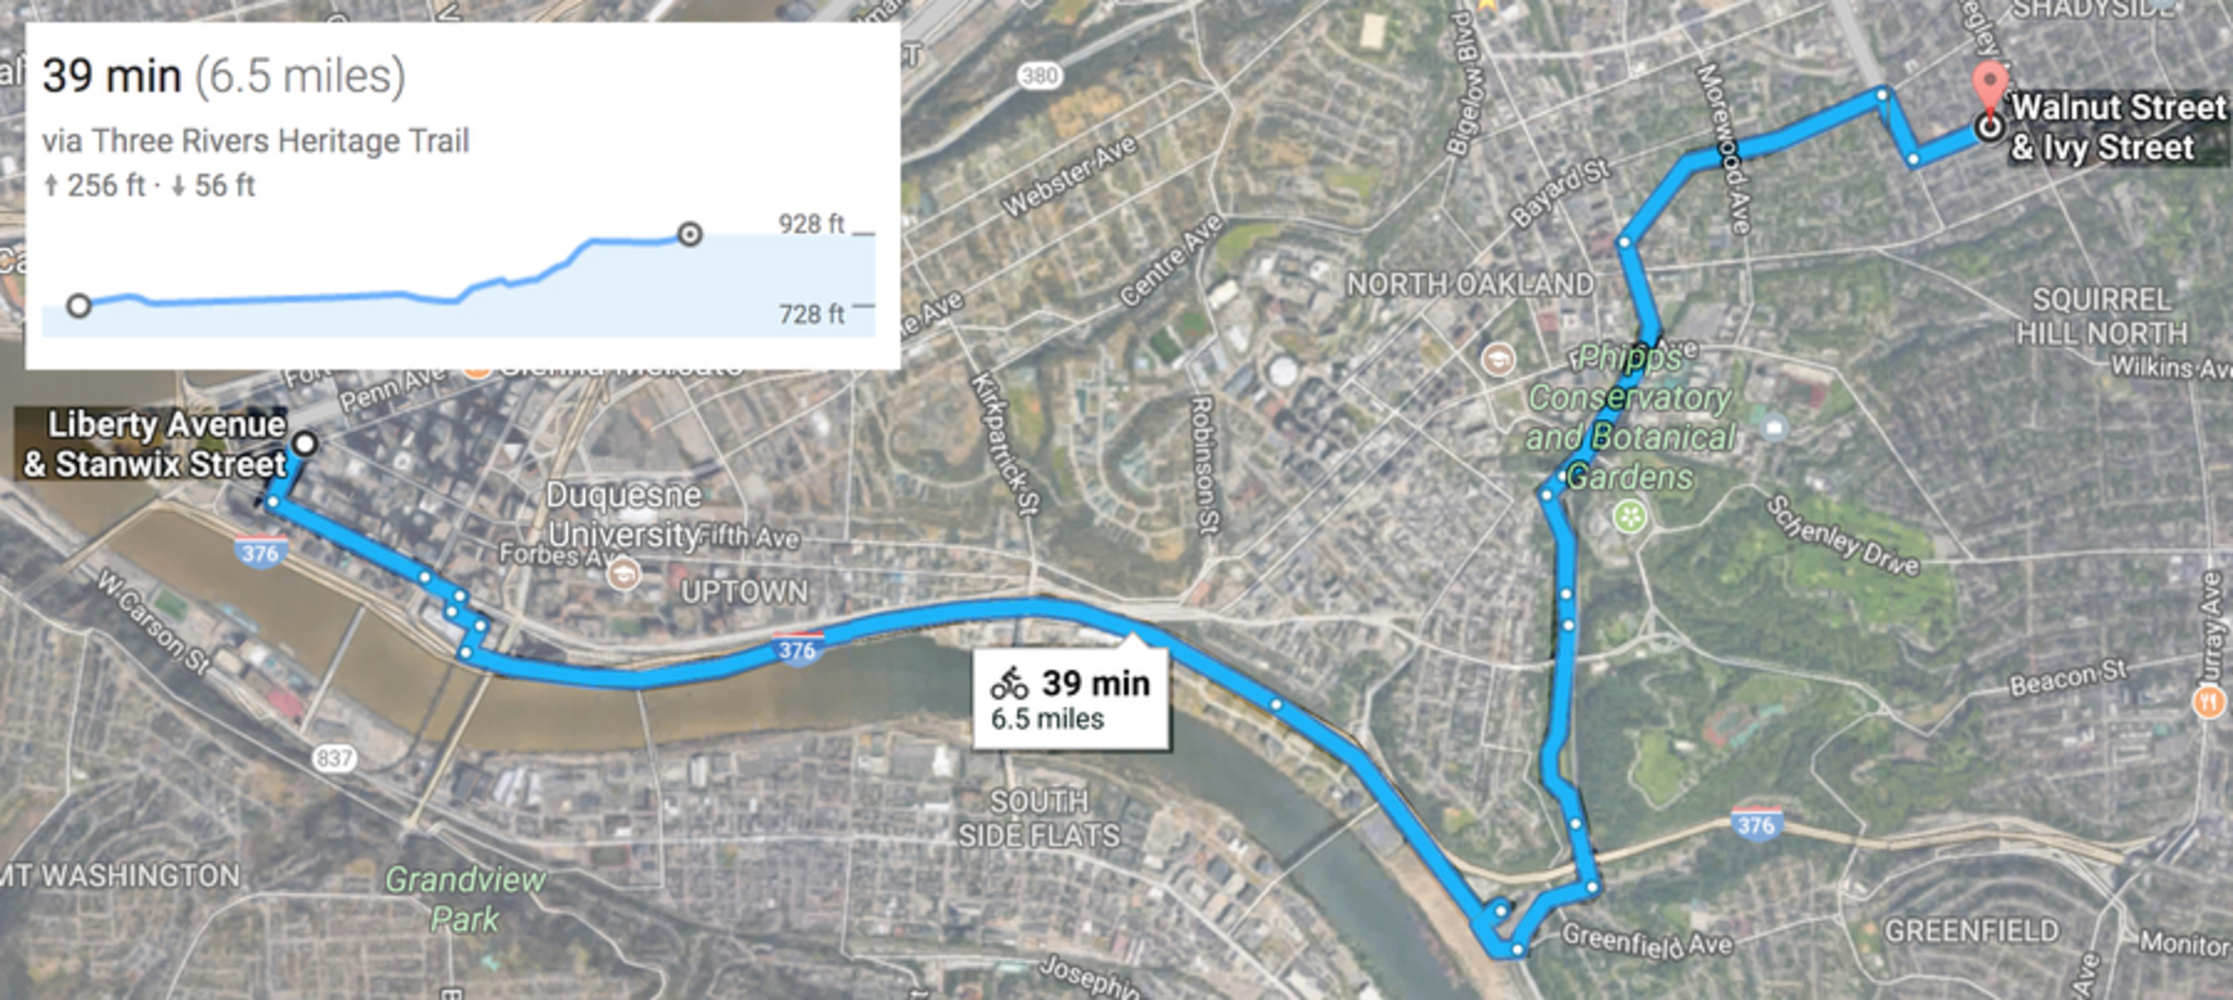
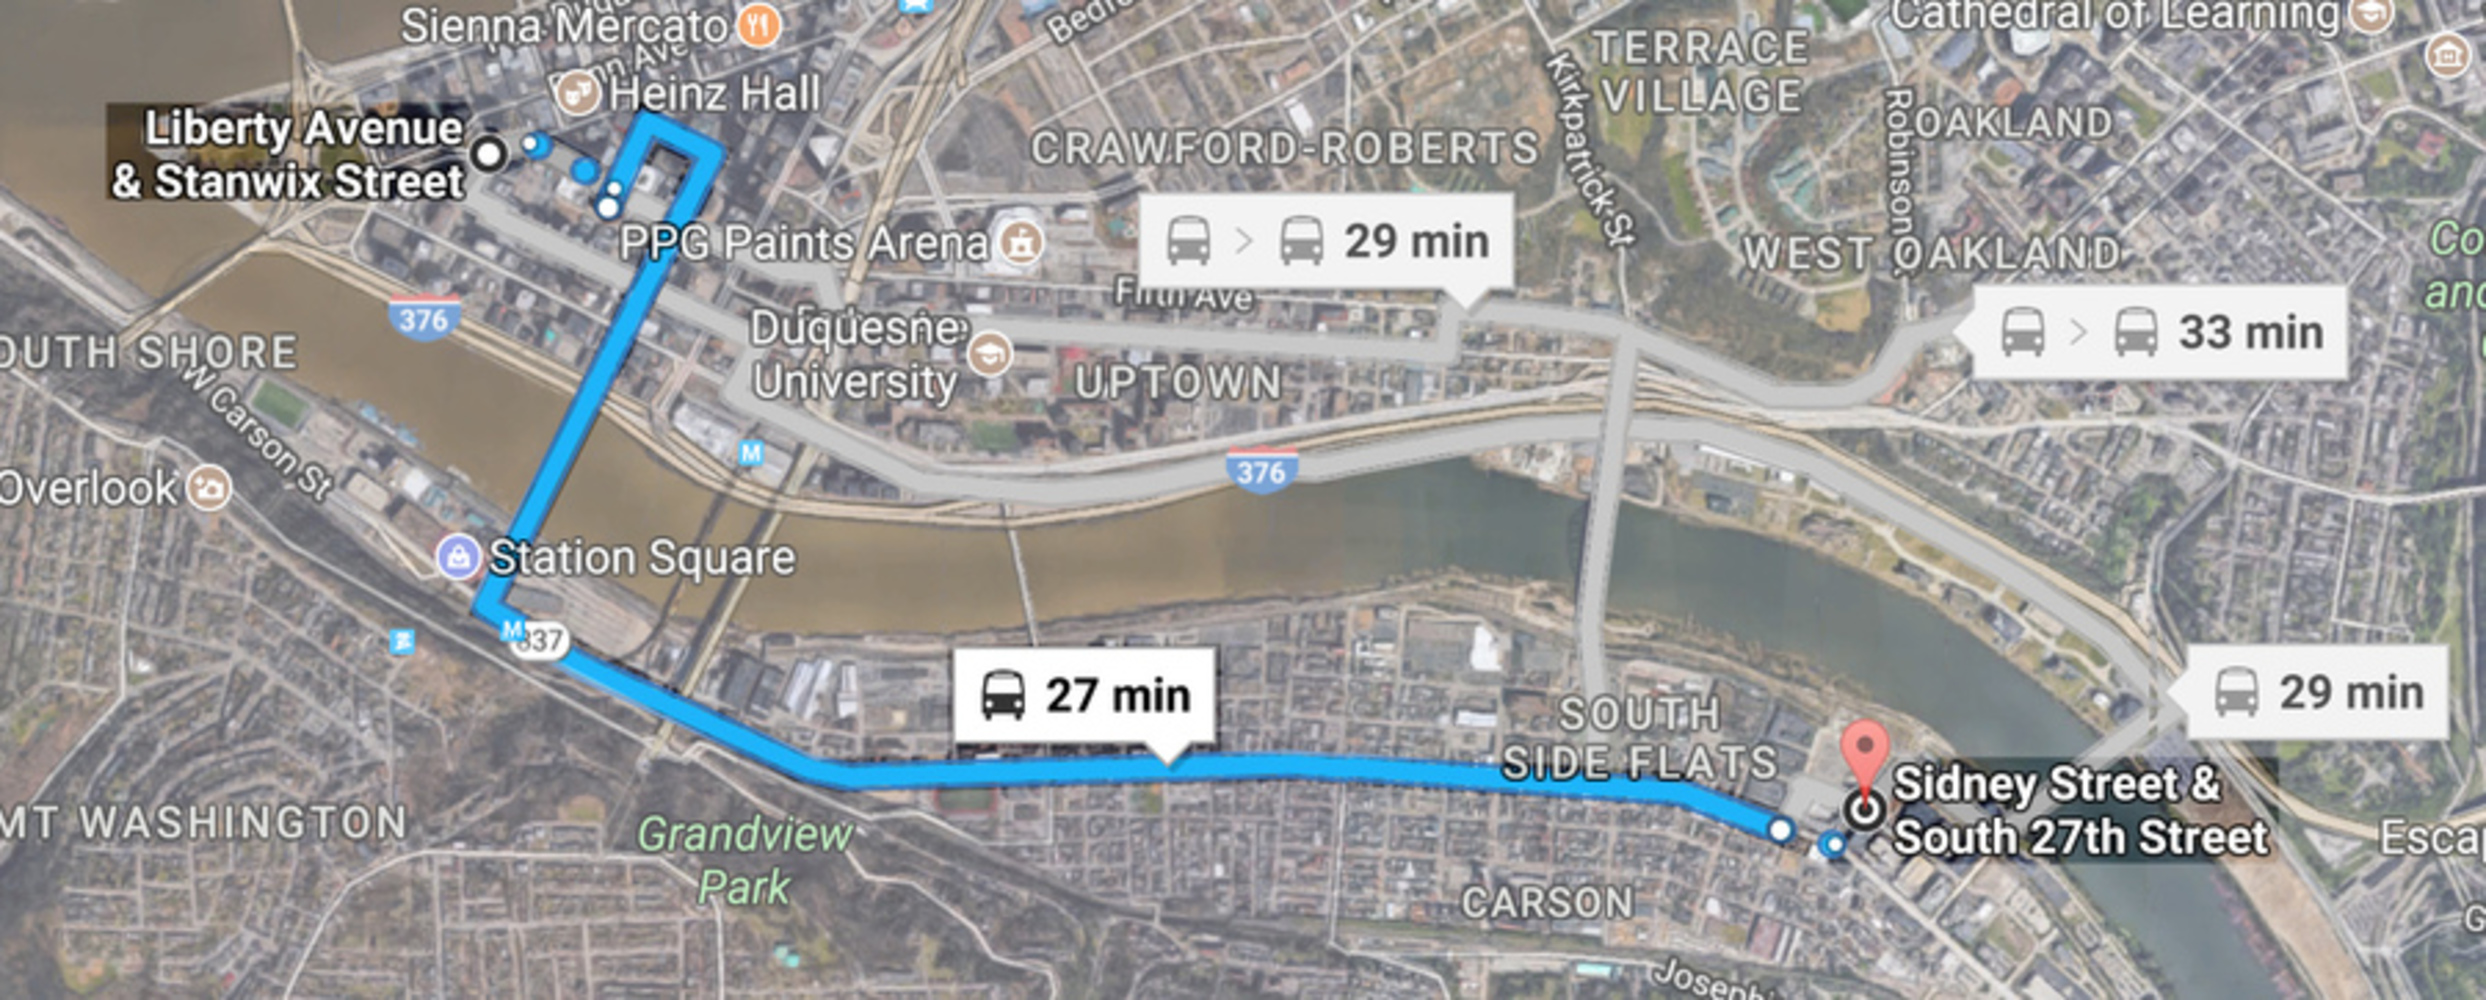
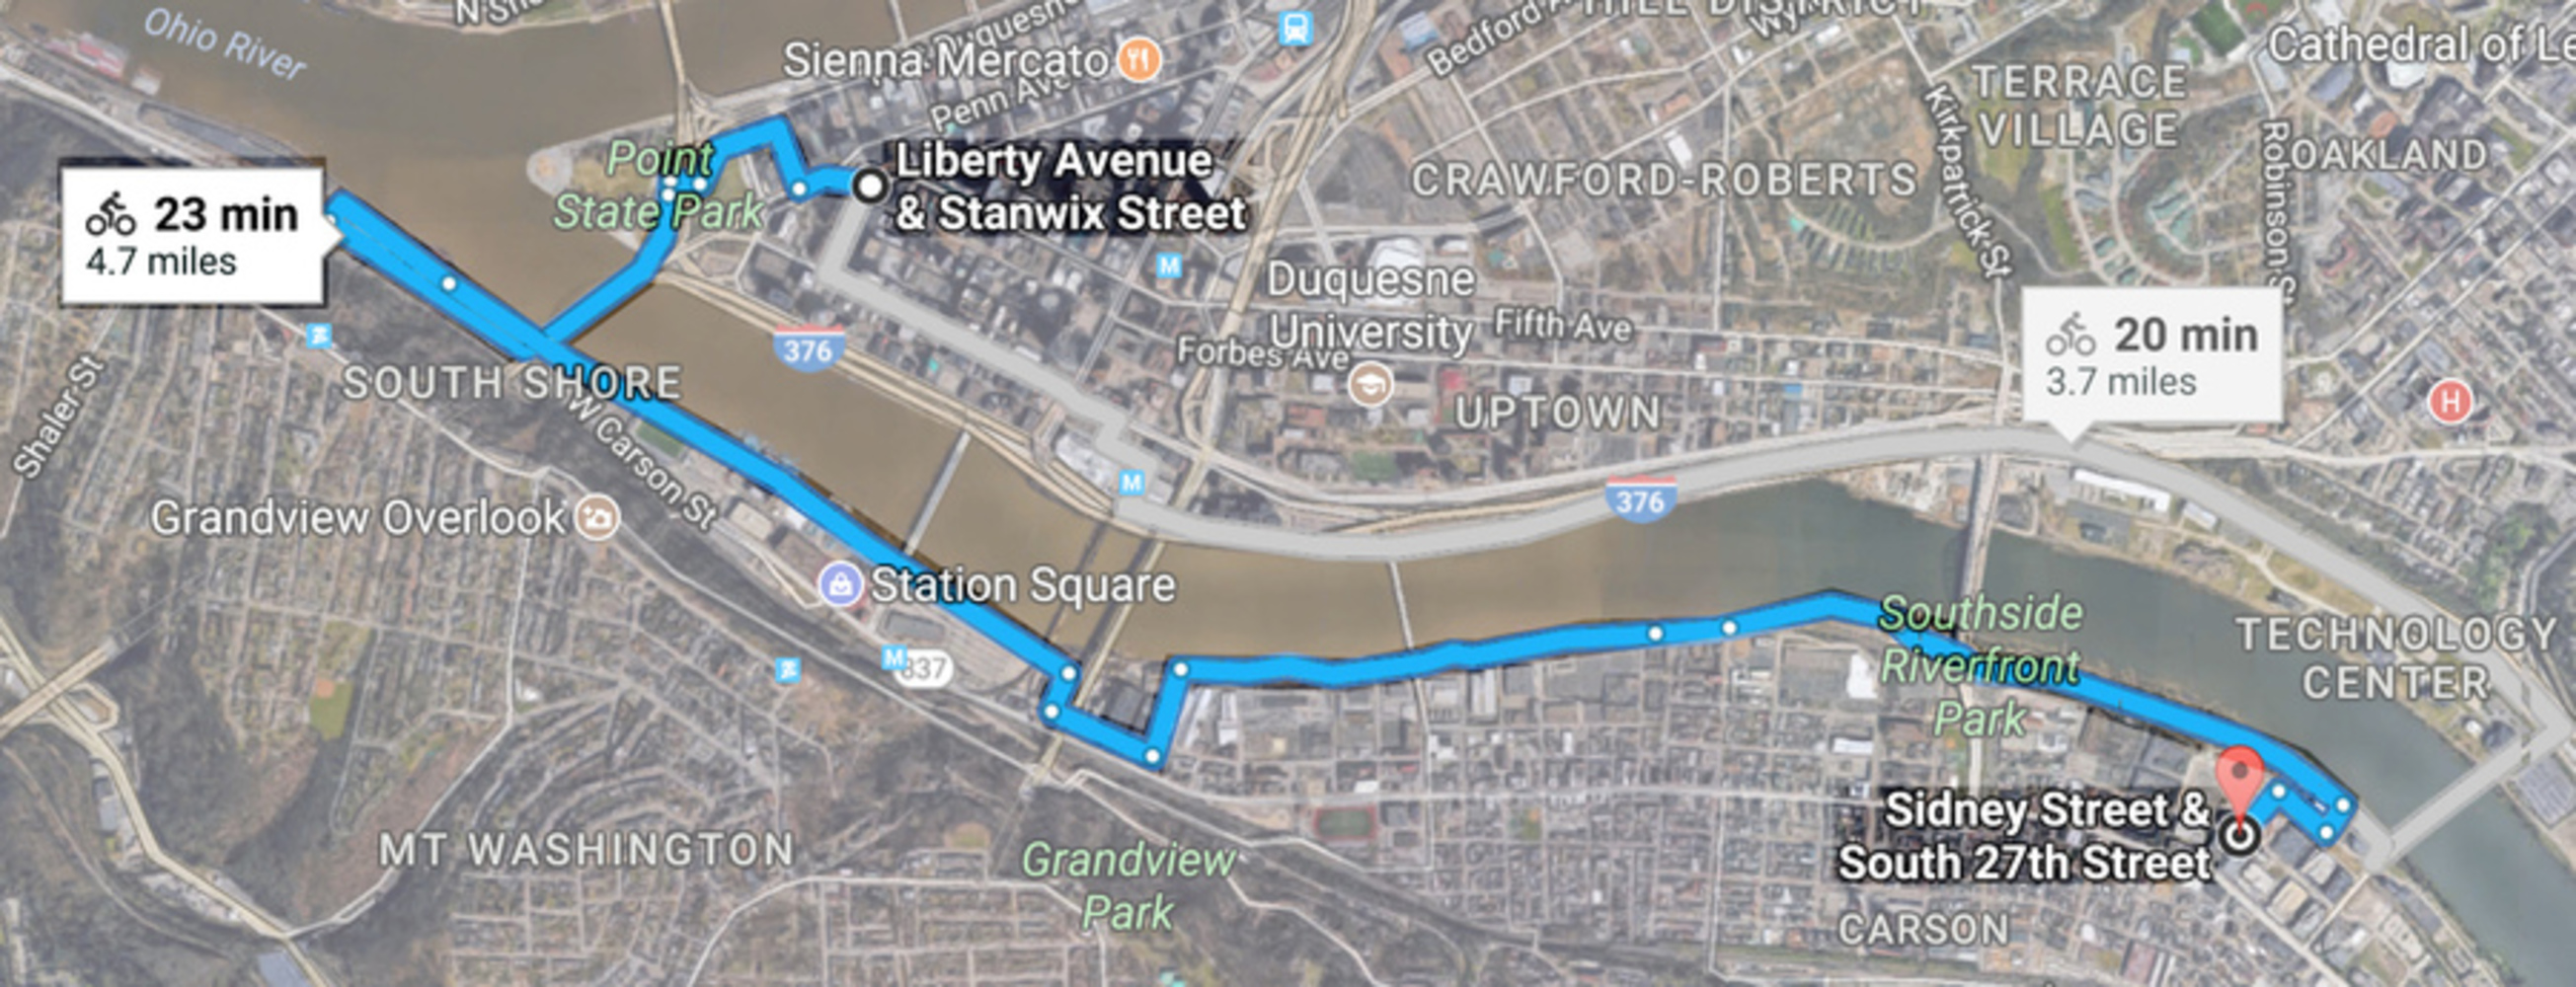
Pittsburgh is a hilly city, crossed by rivers, creeks, and valleys that produce a unique urban landscape, but this characteristic is very hard to move through the city not using a private car. The reasons are because traverse the city on a regular basis becomes a challenging-unmotivating journey even if you are a healthy person. At the same time, many neighborhoods lack reliable transportation options since is costly to maintain bus routes with not enough people using it. 

Healthy Ride and the Port Authority of Allegheny County have moved forward to unify their systems and make it user-friendlier between them. There is a program named "Bikes on Transit" that enables bike users to use a bus by mounting their bike in a bike rack located in front of buses. At the same time, Healthy Ride offers 15 minutes free rides to ConnectCard users.

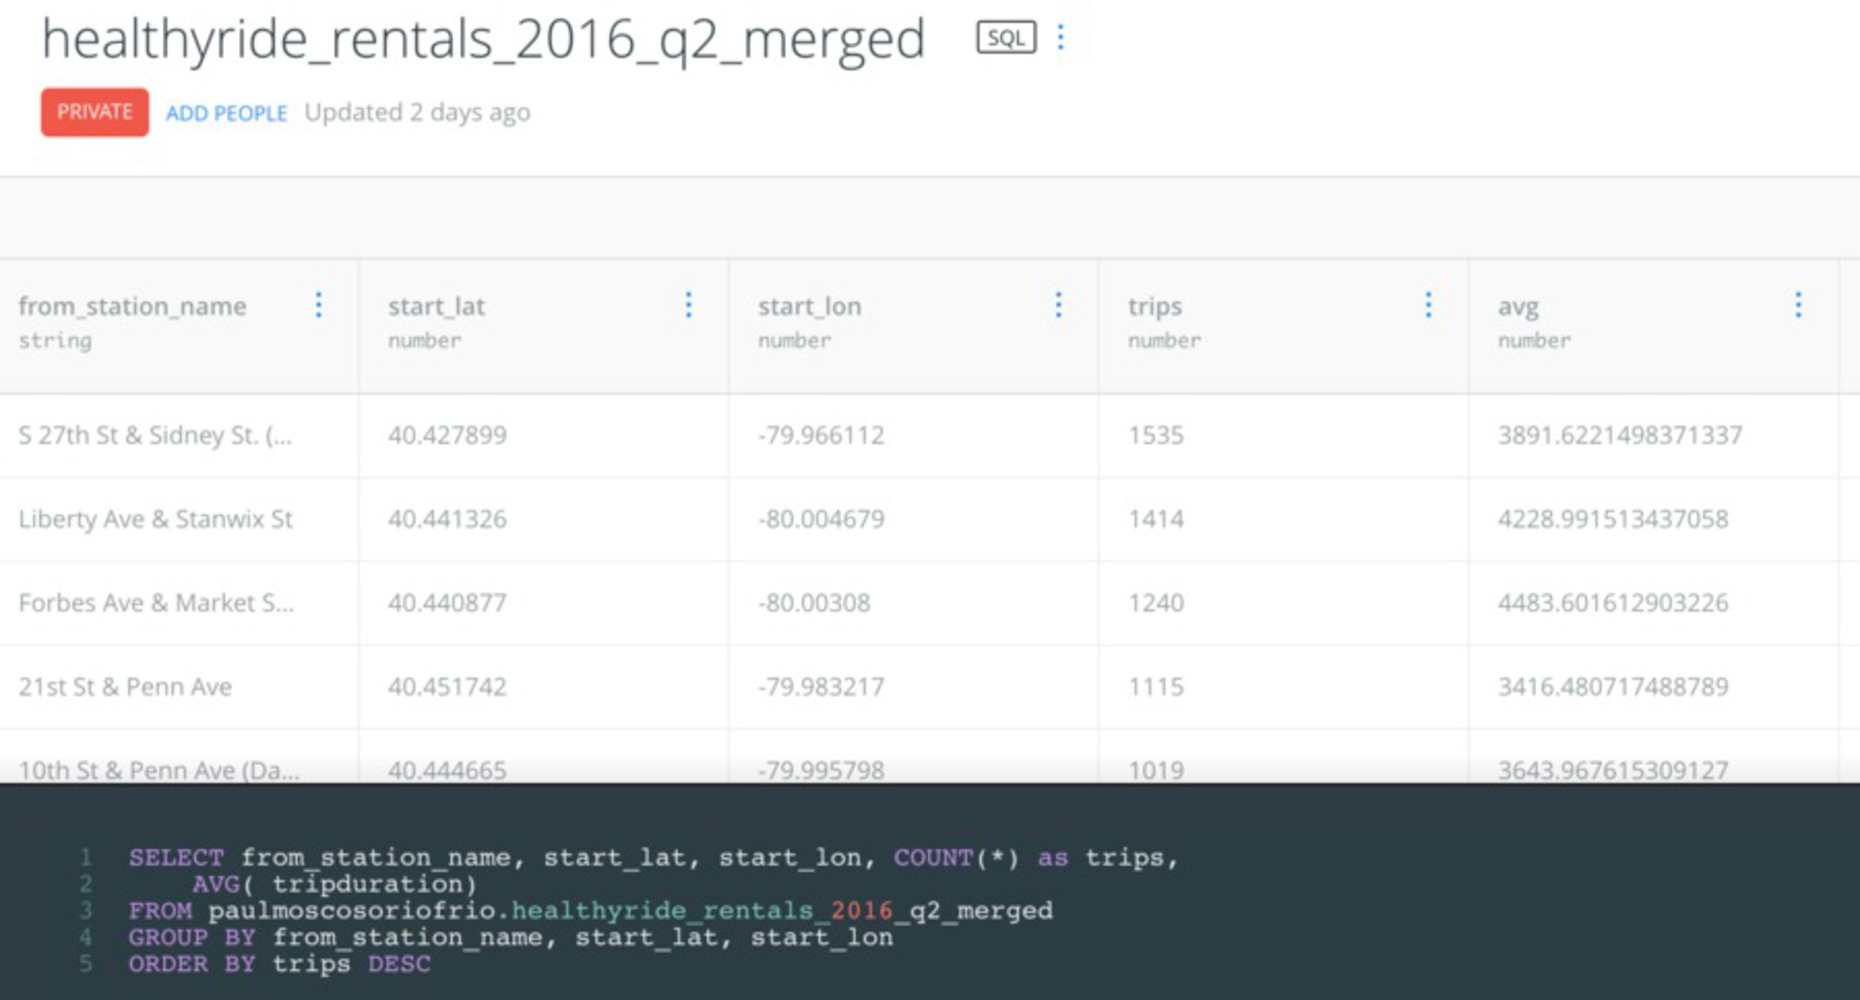
I am curious about the repercussions that a joint effort between the bike sharing operator and the transit agency of the city would have once their systems have become user-friendlier and interconnected. This is a first attempt to understand if open data on bicycles usage can show any pattern or clue about this potential connection already and if so can become a useful tool for police-decision making. 

Source:https://www.bicycling.com/culture/pittsburgh-gives-free-bike-share-memberships-to-public-transit-riders

http://www.portauthority.org/paac/RiderServices/BikesonTransit.aspx

https://www.youtube.com/watch?v=gnRX9vv8NXc&feature=youtu.be 

Dataset

I used a dataset made available by the Western Pennsylvania Regional Data Center (WPRDC) for the Healthy Ride Trip Data. 

The dataset "healthyride-rentals-2016-q2" ranges from 1st April 2016 to the 30th June 2016 and includes 26,373 trips taken from 493 bikes from 51 stations in the Pittsburgh region. On average a trip lasted 57 minutes with a maximum length of 1.94 days and the shortest ride 1 minute.


In the dataset "healthyridestations2016" there are 50 bike stations in Pittsburgh with an average of 18.12 racks (min = 12, max = 35). North Shore Trail at Ft Duquesne Bridge and Centre Ave & Conso PPG Arena are the two stations with more racks and S Euclid Ave & Centre Ave, Centre Ave & Kirkpatrick St, and Federal St & E North Ave are the three stations with least racks. 


Using open data of rental bikes in the second quarter of 2016 I will try to dig up through the information to find if these bike journeys already operated in tandem with buses front-mounted bike racks from the Port Authority. The data provided has the time duration of the trips and the two points from where they started and finished the journey. The idea is by calculation the speed of those trips I can potentially found if any of those had used the "Bikes on Transit" system because if the speed per hour exceeds 11-12 mph, which is considered the average riding speed in the city, would indicate the user could use another mean of transportation to move in the city. 


Source: 
https://data.wprdc.org/dataset/healthyride-trip-data

https://data.wprdc.org/dataset/healthyride-stations     

https://www.livestrong.com/article/413599-the-average-bike-riding-speed/ 

Initial Analysis

The initial idea was to find stations that can represent a potential usage of the "Bike on Transit" and the Connect Card features. With the first intention in mind, there is the necessity to prove the validity of the research through the data provided by WPRDC. So, which Pittsburghese characteristics should be shown? Which stations should be tested first? What kind of trip would you chose as a regular user of bike sharing and mass transit? 

After thinking about my own experiences I have chosen three possible scenarios. These are; a flat scenario, a topographic scenario, and a scenario with physical barriers. The stations taken not just satisfy these scenarios but also have a high number of trips. All of them are based on the condition that downtown is the destination. 

Img 7325.thumb
Show Advanced Options
Trips from station.thumb
Show Advanced Options
Trips to station.thumb
Show Advanced Options

From the initial analysis the result is:

- The most popular station in terms of destination in downtown is Liberty Ave & Stanwix St.

Scenario 1: The station chosen is 42nd St & Butler St because this trip is mainly flat and straightforward. 

Scenario 2: The station chosen is Ivy St & Walnut St because is in the middle of Shadyside (bedroom community) and the level relation between downtown and this point presupposes that the journey will be sloping.

Scenario 3: The station chosen is S 27th St & Sidney St. (Southside Works)  because the physical barriers of highways, bridges, and railroads are numerous which generates many stops and redirects.

Exploration 

The idea to identify three scenarios to probe different conditions in the seek of a valid chose for a regular user. So the assumption is that not new app or software is necessary, and the selection of the best choice for his/her daily commute should be based on the resources already available. Thus, Google maps are tested to see how a user can perform using bike sharing or a bus route from all three scenarios.

Tobus1.thumb
Show Advanced Options
Tobike1.thumb
Show Advanced Options
Tobus2.thumb
Show Advanced Options
Tobike2.thumb
Show Advanced Options
Tobus3.thumb
Show Advanced Options
Tobike3.thumb
Show Advanced Options

To understand these three scenarios, there is the necessity to pull out relevant information from the data. Using a SQL query, it is possible to locate the chosen stations, find the number of trips and the average time that each of this trips takes.  

Screen shot 2017 11 26 at 11.34.25 pm.thumb
Show Advanced Options
Screen shot 2017 11 26 at 11.34.00 pm.thumb
Show Advanced Options

Future Work

The final representation is a map of the three scenarios, the number of trips at scale and the average time (in minutes) in between these trips.

Show Advanced Options

Using the information given, analyzing and mapping it, it is possible to visualize the research question and put it in an objective matter for a broad discussion. According to the present visualization exercise, these are the following conclusions:

-Scenario 1: In a flat trip, an average bike trip using the data analysis is twice as seen in the internet search. But either bike or bus is equal regarding regular time according to Google maps. For this kind of condition, the regular user can profit from taking the bus or the bike at the same time. The "Bike on transit" feature makes the trip a simpler chose base on the climate or traffic condition of a particular day, and by forecasting in advance, it could represent an advance for the user. 

- Scenario 2: On a topographic trip, the average bike trip using the data analysis and the internet search takes the same time. Giving this similarity, the potential savings in time using a mix of bike and bus for overcoming the altitude difference is highly appreciated. 

- Scenario 3: On a trip with physical barriers, same as scenario 1, an average bike trip using the data analysis is twice as seen in the internet search. Giving that according to Google maps, the potential saving in time is equally effective, the question that a user should do is if the detours needed to trespass the barriers are better to take the bus. Here the question of climate or traffic is equally valid.

Final conclusions: Giving that the bike sharing and connectivity with the bus are relatively new programs, the possible outcome of the given data (second quarter of 2016) may be not entirely effective as of today. Extended and update data sets will be valuable for a future exploration. 

The potential change in the way people move in Pittsburgh could be highly productive when combining different means of transportation, and when the data can provide enough resources to make a good decision how to move in the city. I have chosen merely three scenarios out of the infinite possible outcomes connections between stations, and just assuming a traditional commute to downtown. Amplify this research to more places in the city, using update data, and doing it public would be very beneficial for everyone.


Drop files here or click to select

You can upload files of up to 20MB using this form.