Back to Parent

Outcome


Whose Healthy Ride?

Overview

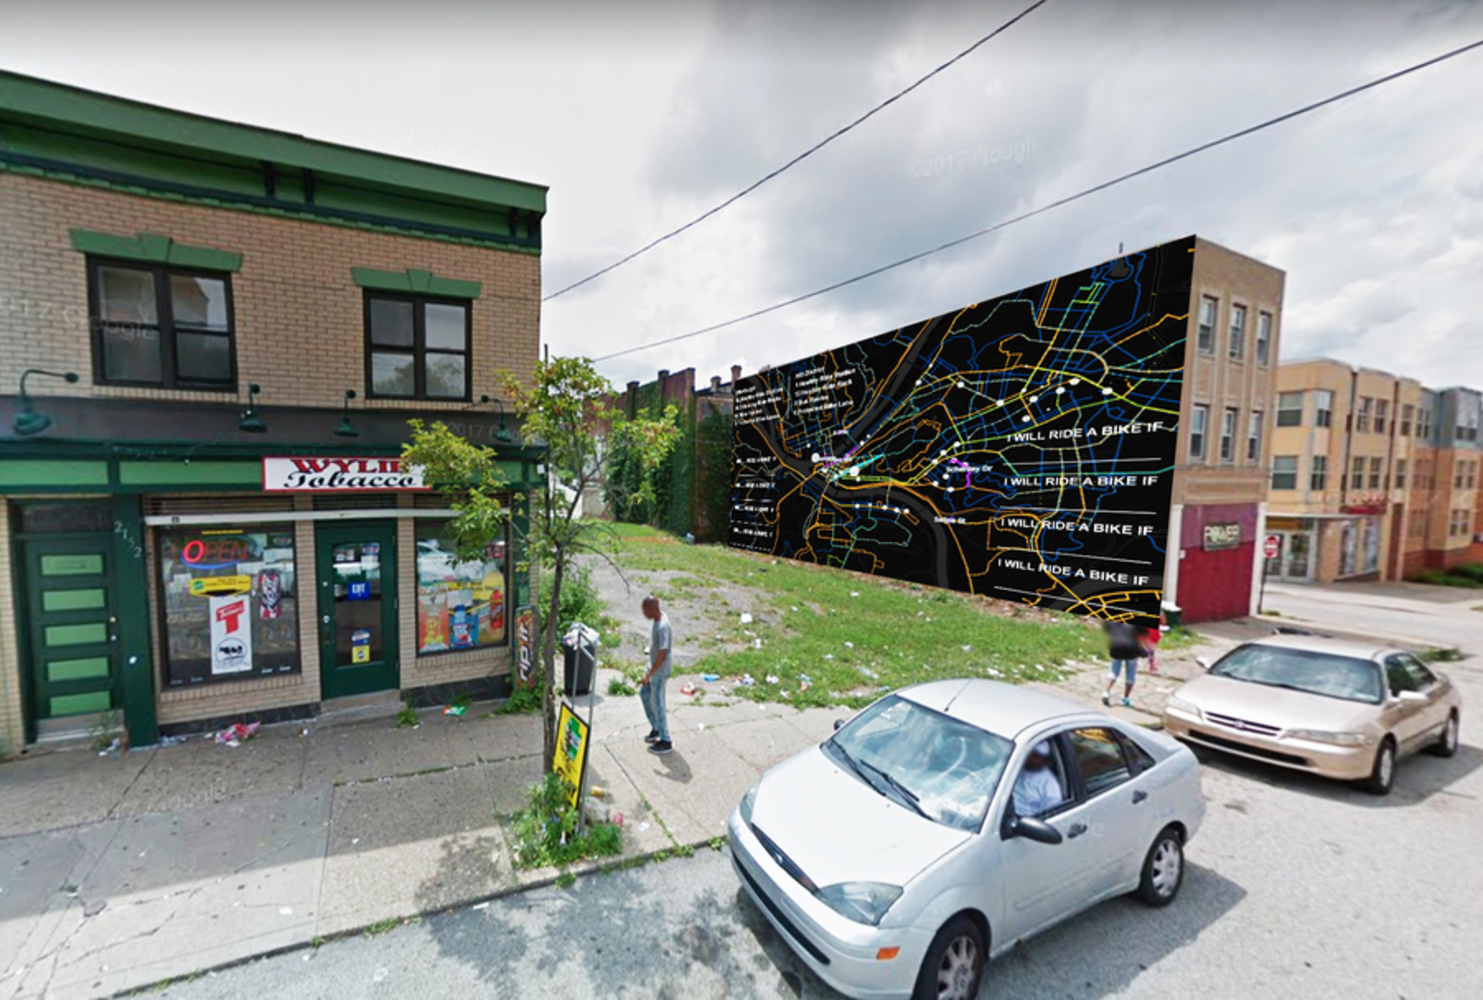
For the final project, I continued exploring where are the imbalances of bike uses vs bike resources and why. I intend to get the community involved in identifying where they see the imbalance and how they might advocate for reallocating the health ride bike resource.

The following analysis is composed of 3 parts: 1. Zoom into the most resourced bike stations and study the relation between stations and bike lanes; 2. Zoom out to see where are the least resourced area and explore the potential reasons of topography and public transit; 3. Identify the neighborhood that needs intervention mostly and the question that can be introduced to trigger community conversation.

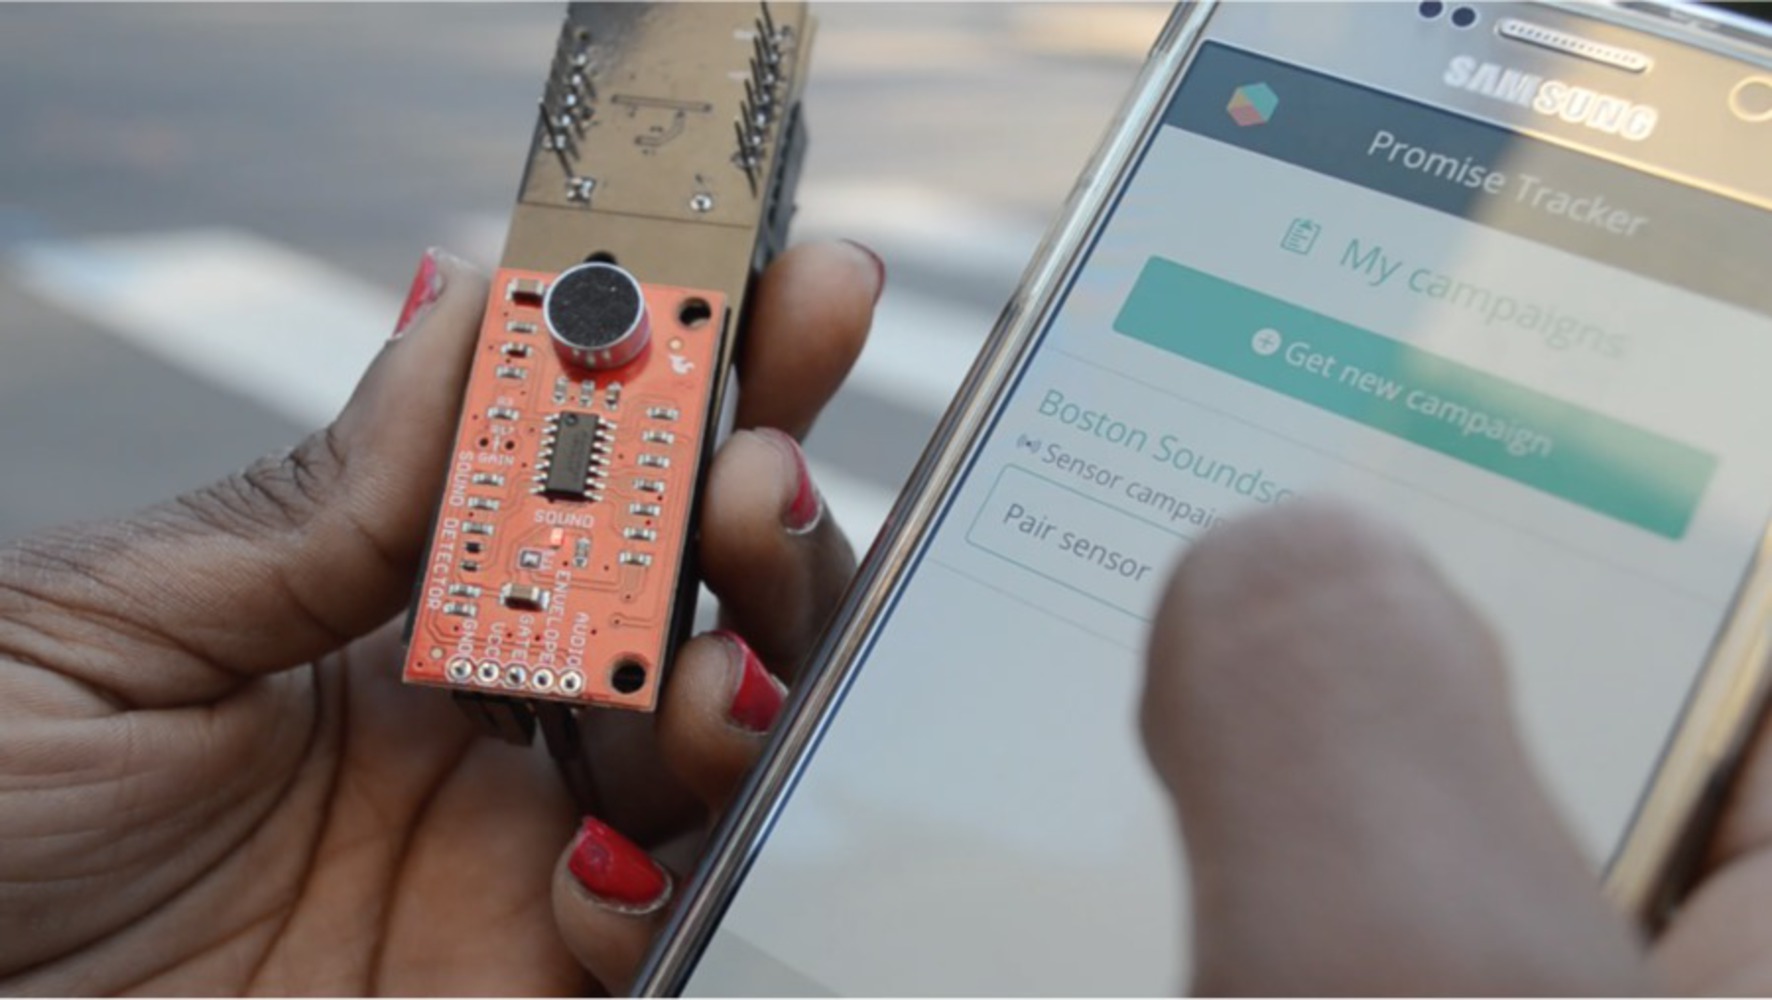
The steps I recommend to involve the community are 1. introducing the question to the community by data representation; 2. raising the community's awareness and get their direct input; 3. developing a long-term partnership with riders of the community and collect data for future research.

In this project, there are still challenges to consider if going further: 1. to visualize the issue in the way that all groups of people can easily understand; 2. to evaluate different community engagement approaches and have some test if possible; 3. to include a larger team of experts so that broader view can be covered.

Analysis

Step1.

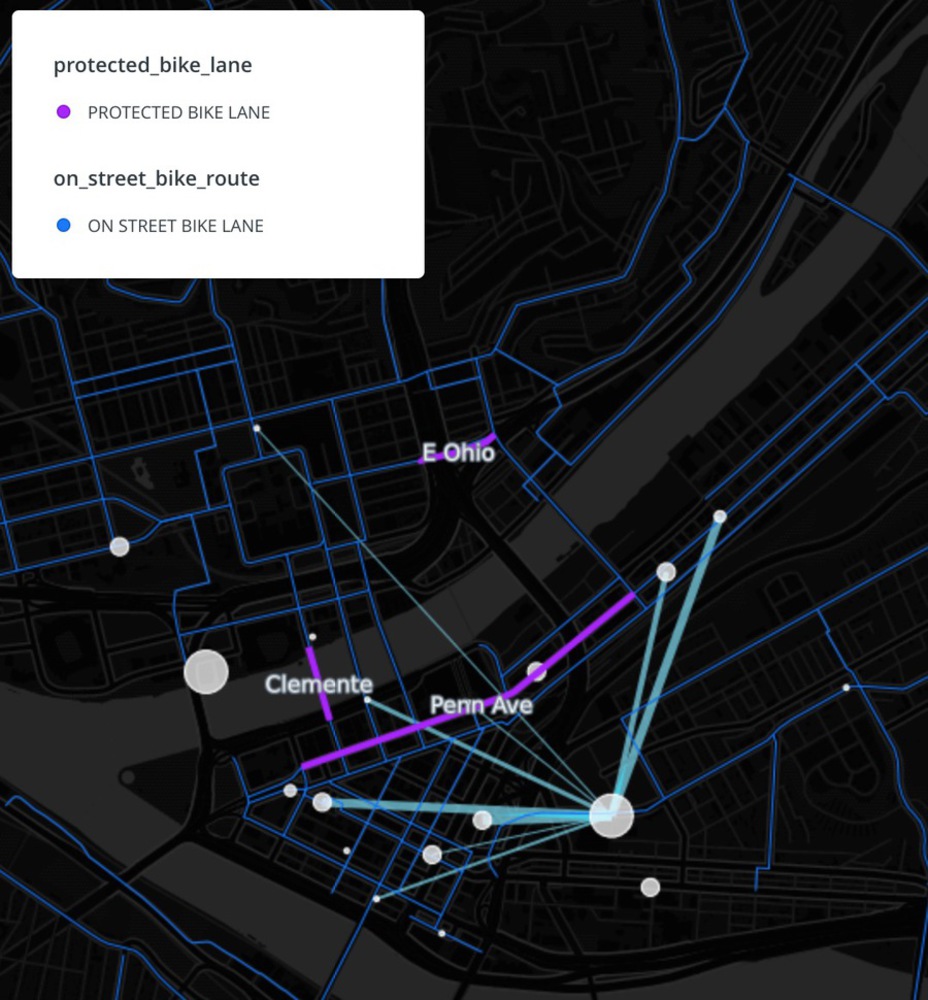
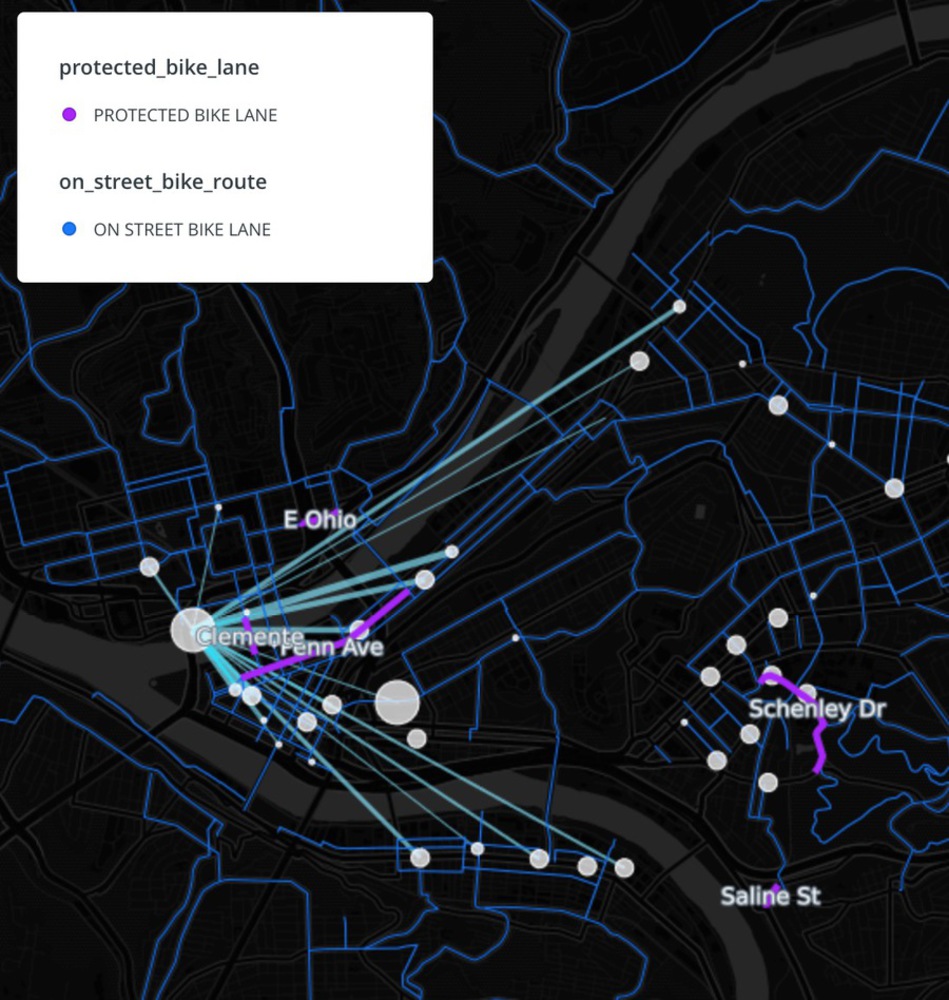
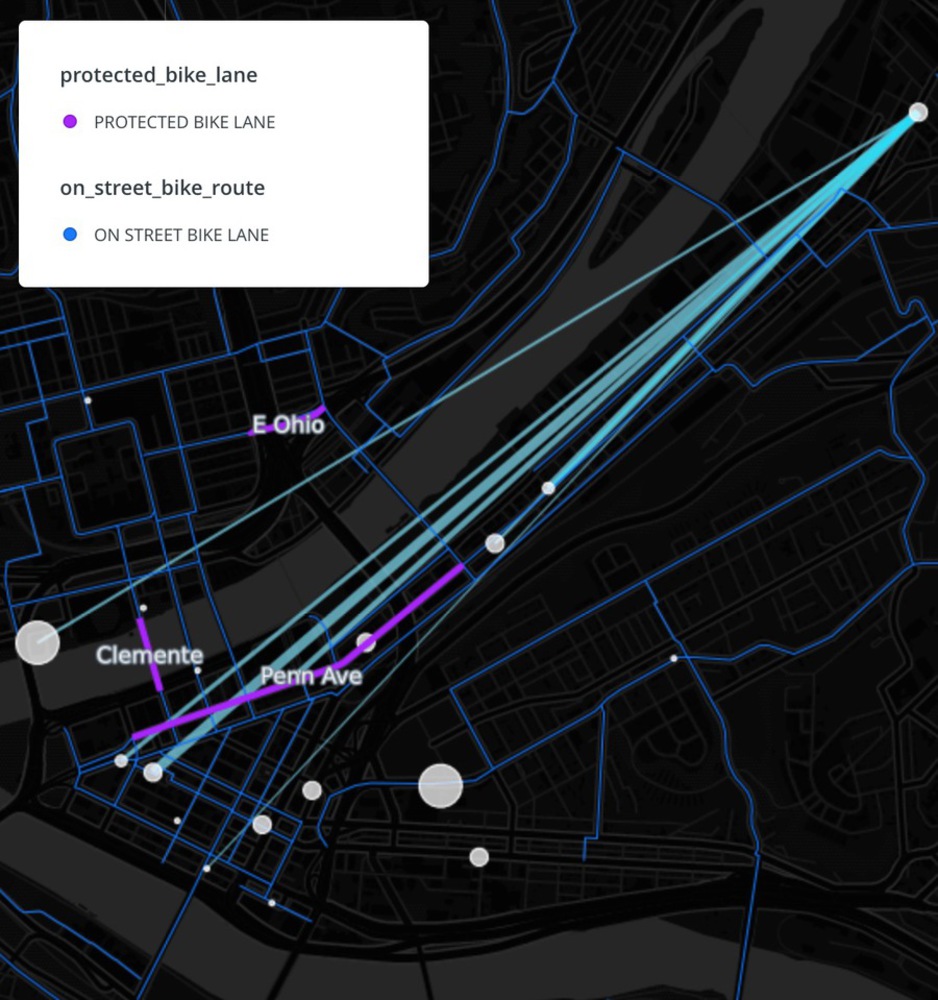
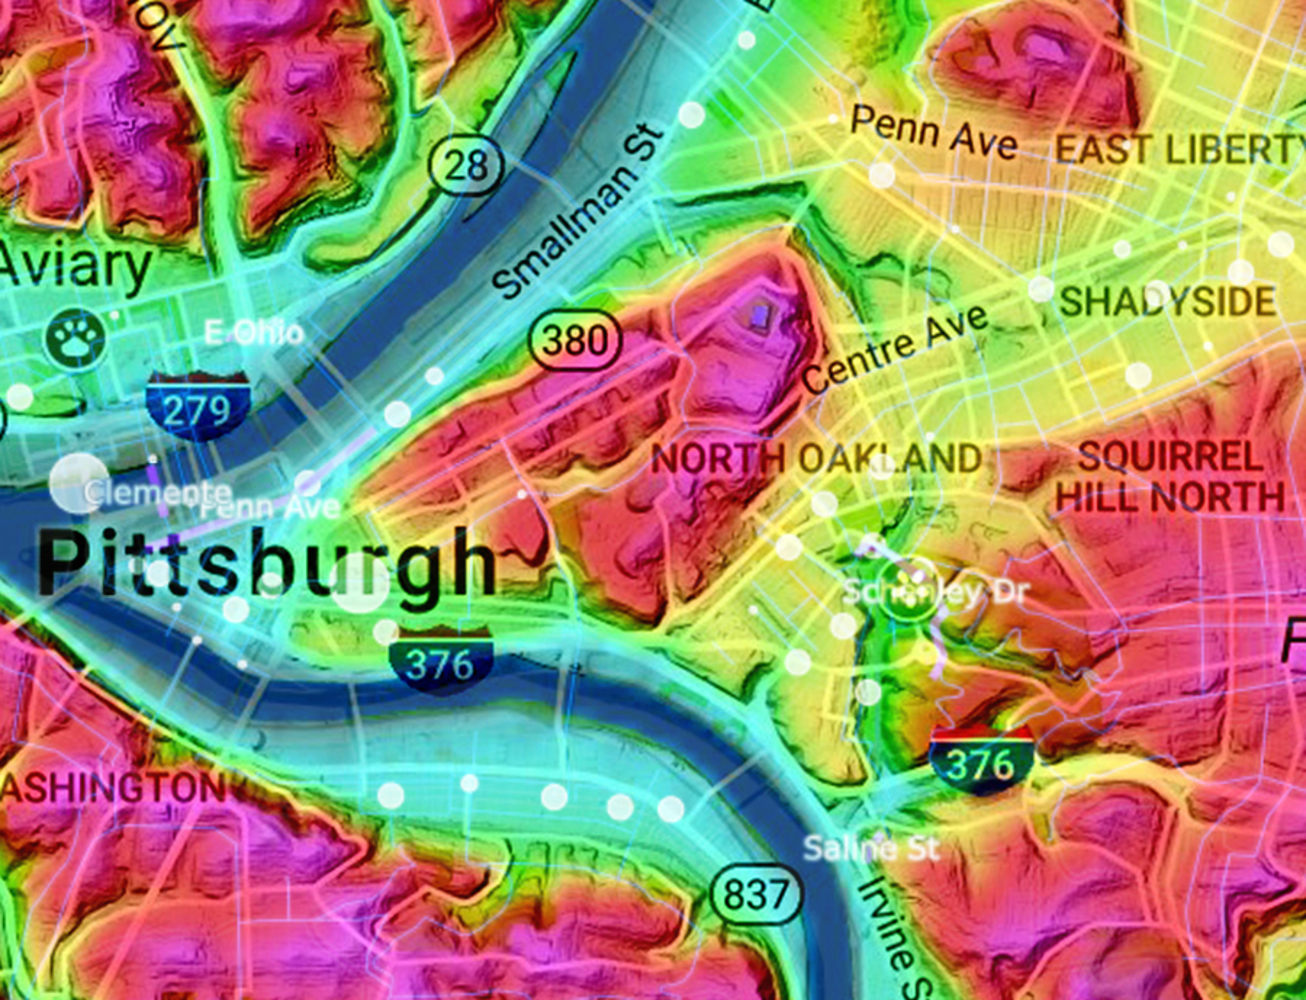
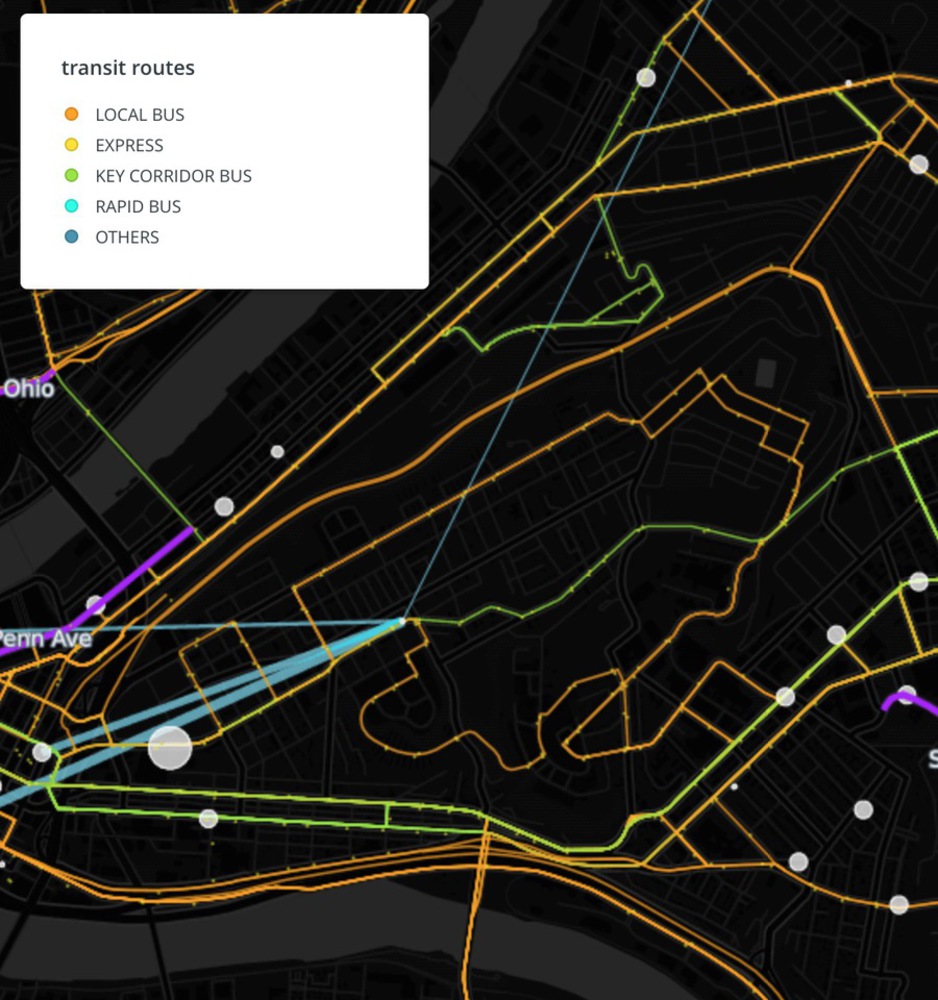
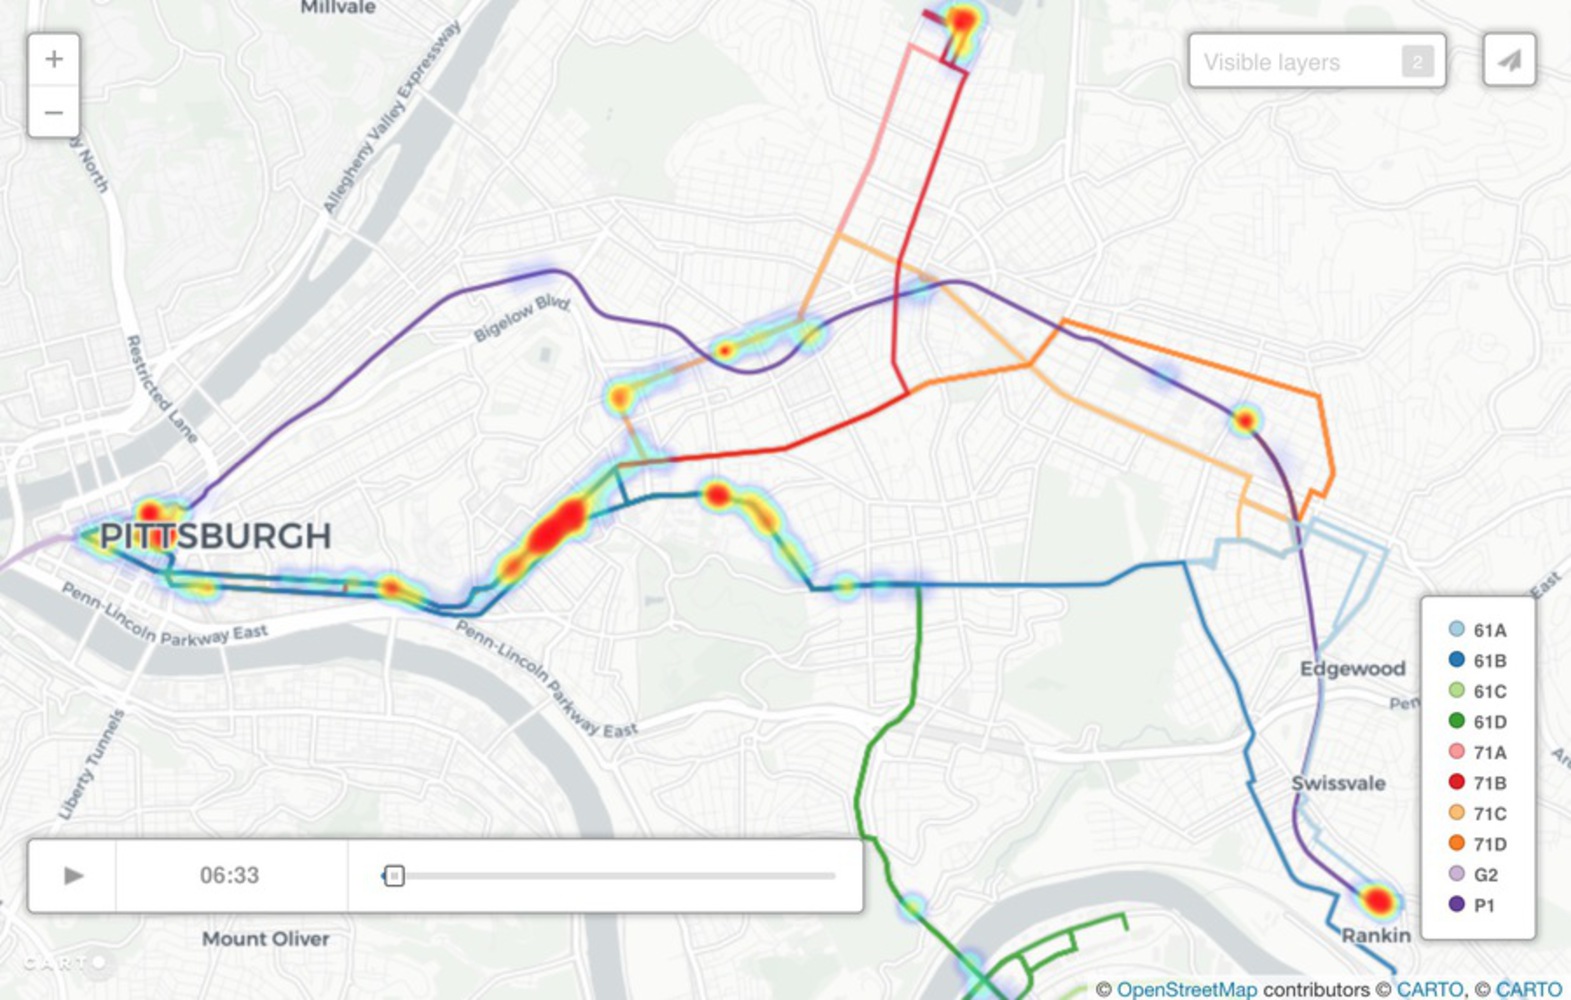
Based on the previous project, I decided to take a close look at 3 most resourced bike stations first. The trips from Centre Ave & PPG Paints Arena Station travel mostly to Downtown and Strip District direction. Biking from Centre Ave & PPG Paints Arena Station to 17th St & Penn Ave Station takes around 12 minutes while taking the bus is 19 minutes including transfer. These trips can take either protected bike lane or on-street bike lanes. Observing along with the Pittsburgh Bus Bunching map, these traveling directions also have more heavy traffic, so biking is faster for commuting.

1centre.thumb
Show Advanced Options

The trips from North Shore Trail & Ft Duquesne Bridge have a totally different situation. These trips are mainly coastal-favorite. The docking locations are concentrated along/close to the rivers. We can infer that there are two possibilities. Taking bus will take generally 10minutes longer(with at least one transfer) than biking so the commuters prefer the bikes, or these trips are made by tourists who want a sightseeing along the rivers.

2northshore.thumb
Show Advanced Options

The trips from 37th St & Butler St Station shows strong one-direction dominance. After overlaying the bike lane data, the reason behind that is obvious. Although taking bus has similar travel time as biking, the trips between these stations have better biking experience than in other areas of the city because of the bike lanes and elevation.

After exploring the advantages of the popular stations, the next step looks into the least resourced area and the reasons behind the gap.

331e4b30 94b9 42e2 8105 53564ead6cbb.thumb
Show Advanced Options

Step2.

Zoom out to the city area, we observe 2 dominant areas that barely have bike stations–Hill District and Squirrel Hill. Besides the obvious topography issue, what are the other reasons that lead to the least resource od bikes? Is this situation also related to public transit system?

Obviously, the 2 least resourced areas are both hilly and not the optimal place for biking. (Overlay with topography) Another analysis from Bike Pittsburgh also shows that the bikes end up piled up at lower elevation stations while the higher elevation ones are left empty. (Stations color-coded by elevation)

Does the physical situation necessarily equal to the needs? 

Gap.thumb
Show Advanced Options
Topo.thumb
Show Advanced Options
02e401be ec6b 4656 a41a 56b9508eb5ac.thumb
Show Advanced Options

Step3.

There is an obvious public transit gap in Hill District area. Only 3 bus routes are going through the neighborhood and the only bike station in this area has 12 racks. Almost all the trips from the Hill District station headed to the downtown area. We can imagine that if there are more bike stations to serve the community along with the bus system, the stations should be placed on high elevation area and probably will need extra work to bring the bikes back from the low elevation stations. Now come to the question for the community member: will you use the bikes if there are more stations? will you ride to another side of the city, like Shadyside and Squirrel Hill? what are the requirements you have to allow your biking from your neighborhood?

Hilldistrict.thumb
Show Advanced Options

Actors

The data analysis involves different groups of actors: Healthy Ride Comapany, non-profit orgnization like Bike Pittsburgh, governmental agency like Port Authority and the residents, not only the users but also people who don't have access to the bikes. 

In the community engagement process, Bike Pittsburgh can serve as an active advocator and educate the community knowledge of biking. Healthy Ride can collaborate with Port Authority to better balance the resources of bikes and public transits. 

According to Esri Tapestry Segments, 35.6% of Hill District residents are 'social security set' and 21.2% are 'city commons'. The population is either depending on social security or is single-parent homes. Their major transportation way is by bus. The residents in such neighborhood really need a plateform to act and have their voice heard.

Hilldistrict222.thumb
Show Advanced Options

Engaging place

Strategy 1–Data and Issue

By investigating different layers of data and building the correlation between dataset, the visual representation introduces the problem to the community. Taken Pittsburgh Bunching as an example, if the bike resource can be visualized to a real-time tracking map, then people can easily observe how the bikes are traveling and distributed. To make sure the public has easy access to the analysis is also a chance to introduce the issue and let the public realize the issue more easily. 

Ed9271c6 5a47 4a2e 9a01 178b805371d9.thumb
Show Advanced Options

Strategy 2–Community Input

This strategy refers to Candy Chang's community artwork. Before I Die uses a chalkboard as a conversation space. It encourages the community members to think about their relationship with death and each other. The chalkboard can also become a canvas to show the bike resource analysis and get the community's response in a collective way. The canvas can be a chalkboard but can also be graffiti, flyer, digital screen etc. The questions for the community have the flexibility to change according to different stages of analyses. Writing down the residents own ideas is also a process to build their sense of ownership towards the project.

Before i die nola house front 1000x602.thumb
Show Advanced Options
Before i die nola writing 1000x602.thumb
Show Advanced Options
Proposal 01.thumb
Show Advanced Options
The Hill District of Pittsburgh is probably one of the most outstanding examples in Pittsburgh of neighborhood deterioration...About 40 percent of the Hill District's residents live below poverty level. – George Evans

If tracing back to the history of the neighborhood, transportation inequity is just one aspect of the social justice issue in Hill District. By putting up the chalkboard/graffiti in the vacant lots, parking lots and next to the only bike station, this strategy also serves as a platform where the residents can pay more attention and fight for their equal access to public facilities.

Untitled 1.thumb
Show Advanced Options

Strategy 3–Future Collaboration

In the future, hopefully, the open dialogues with the community will make residents feel free to collaborate in the long run. The long-term partnership with the community will allow the acquisition of more data inputs. Like Promise Tracker, the community will document their movement by themselves. With the sensors built in the phones or on the bikes, it's able to record where people are heading to from this neighborhood and what are other transportation ways they are taking. This strategy requires more technology support so a larger team with different expertise needs to be formed.

Screen shot 2015 11 02 at 5.26.31 pm 1024x578.thumb
Show Advanced Options

Data sources:

(1) Healthy Ride Trip & Station Data

https://data.wprdc.org/dataset/bike-rack-locations-downtown-pittsburgh

https://data.wprdc.org/dataset/healthyride-trip-data

(2) BikePGH's Pittsburgh Bike Map Geographic Data

https://data.wprdc.org/dataset/shape-files-for-bikepgh-s-pittsburgh-bike-map

(3) Pittsburgh Topography/Contour data

https://www.arcgis.com/home/item.html?id=d0520a19fe874639bc633831953dc91c

(4) Port Authority of Allegheny County Transit Routes & Stops

https://data.wprdc.org/dataset/port

https://data.wprdc.org/dataset/port-authority-of-allegheny-county-transit-stops


Precedents:

(1) Pittsburgh's Bus Bunching Bad News Bears http://bunching.github.io/

(2) Candy Chang– Before I Die; Community Chalkboards http://candychang.com/work/

(3) Promise Tracker http://promisetracker.org/


Related news:

(1) “Why Would Someone Climb Pittsburgh's Steepest Hills On A Healthy Ride Bike? To Prove It Can Be Done” http://wesa.fm/post/why-would-someone-climb-pittsburghs-steepest-hills-healthy-ride-bike-prove-it-can-be-done#stream/0

(2) “Pittsburgh's Healthy Ride not so healthy, but changes are on the way” http://www.post-gazette.com/local/city/2017/07/17/healthy-ride-pittsburgh-bike-rentals-bikeshare-programs-pa/stories/201707170010

Drop files here or click to select

You can upload files of up to 20MB using this form.