The Tech
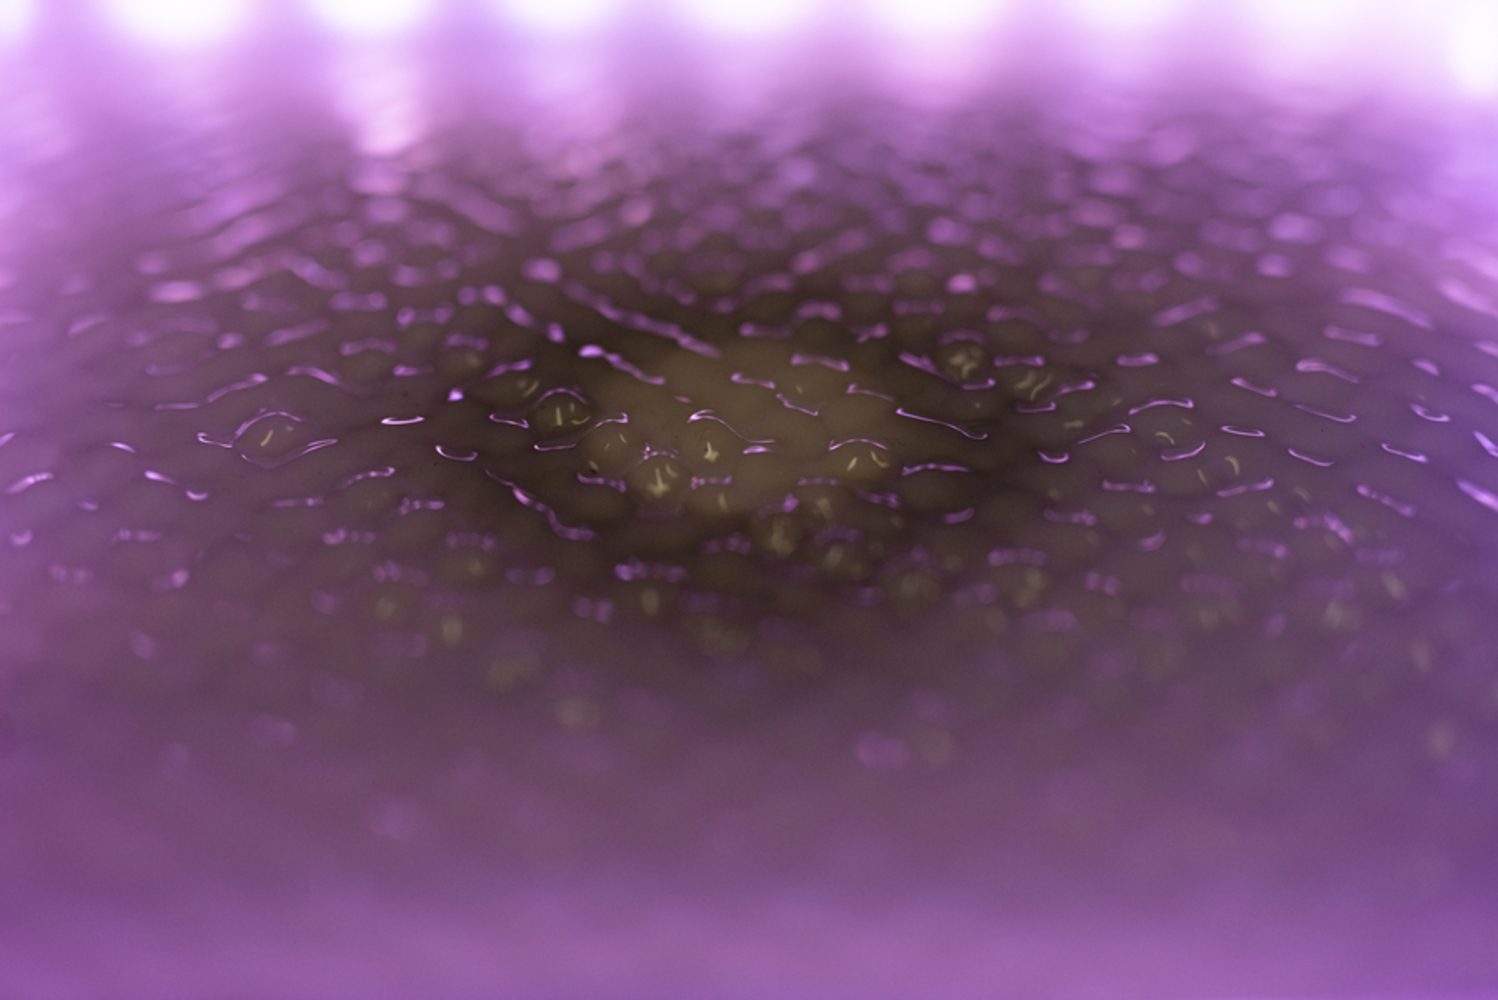
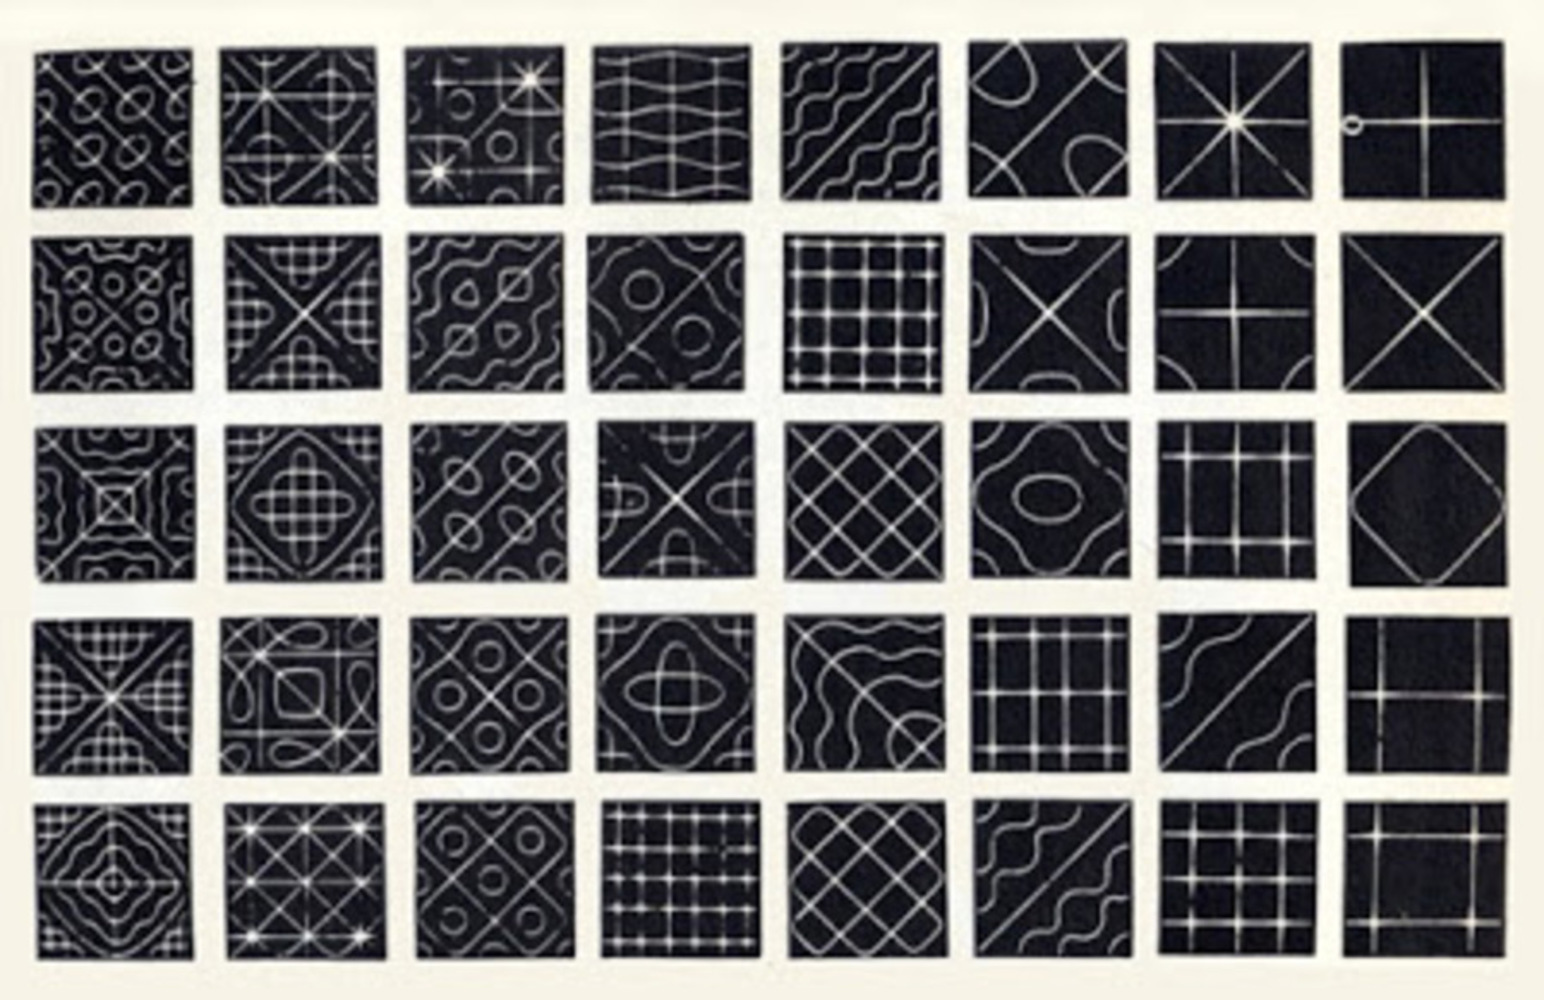
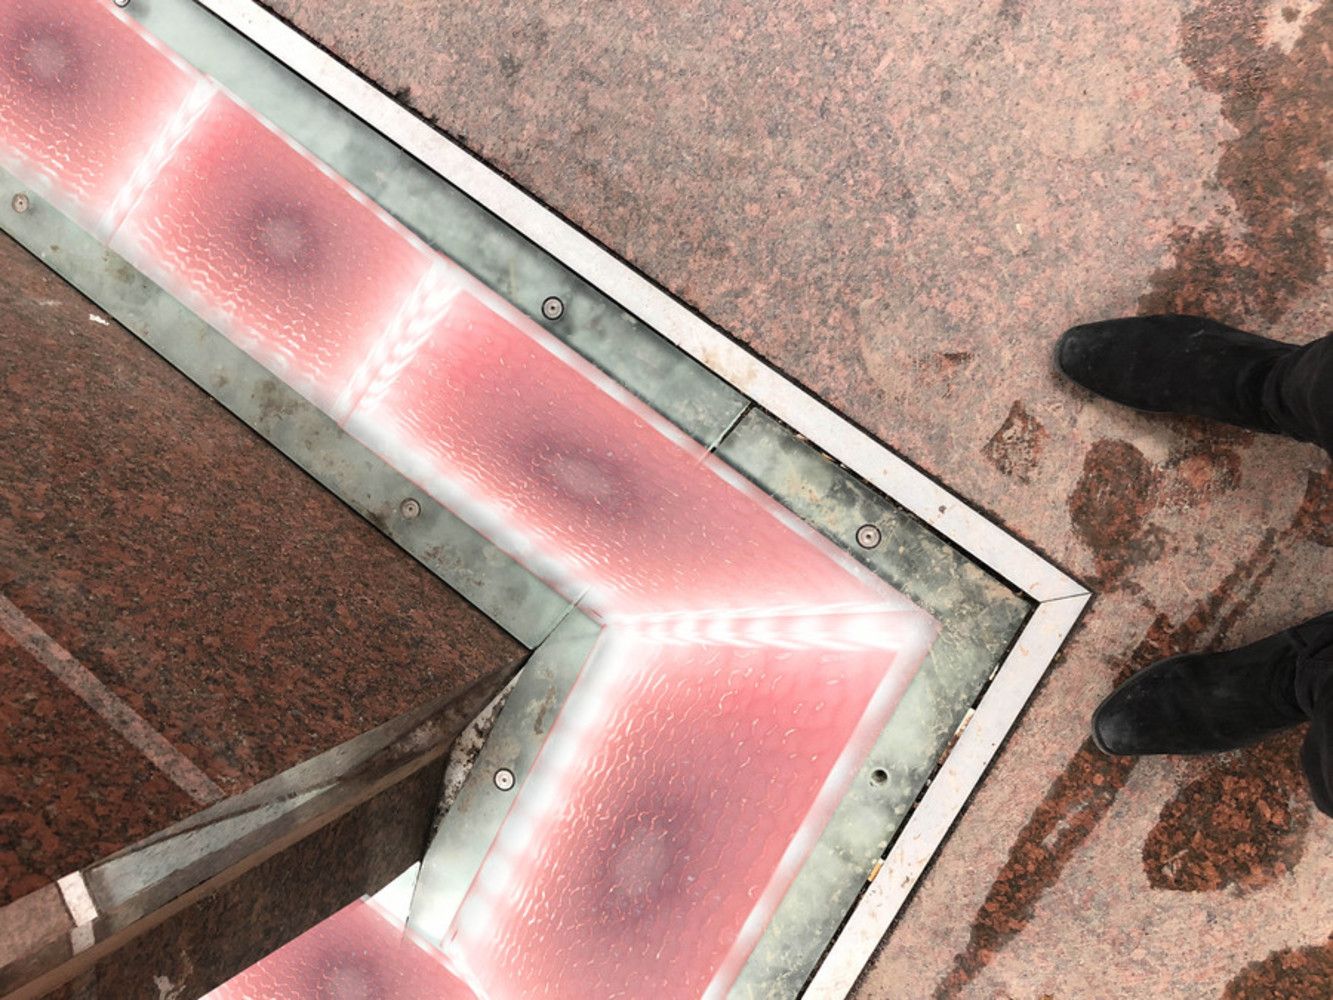
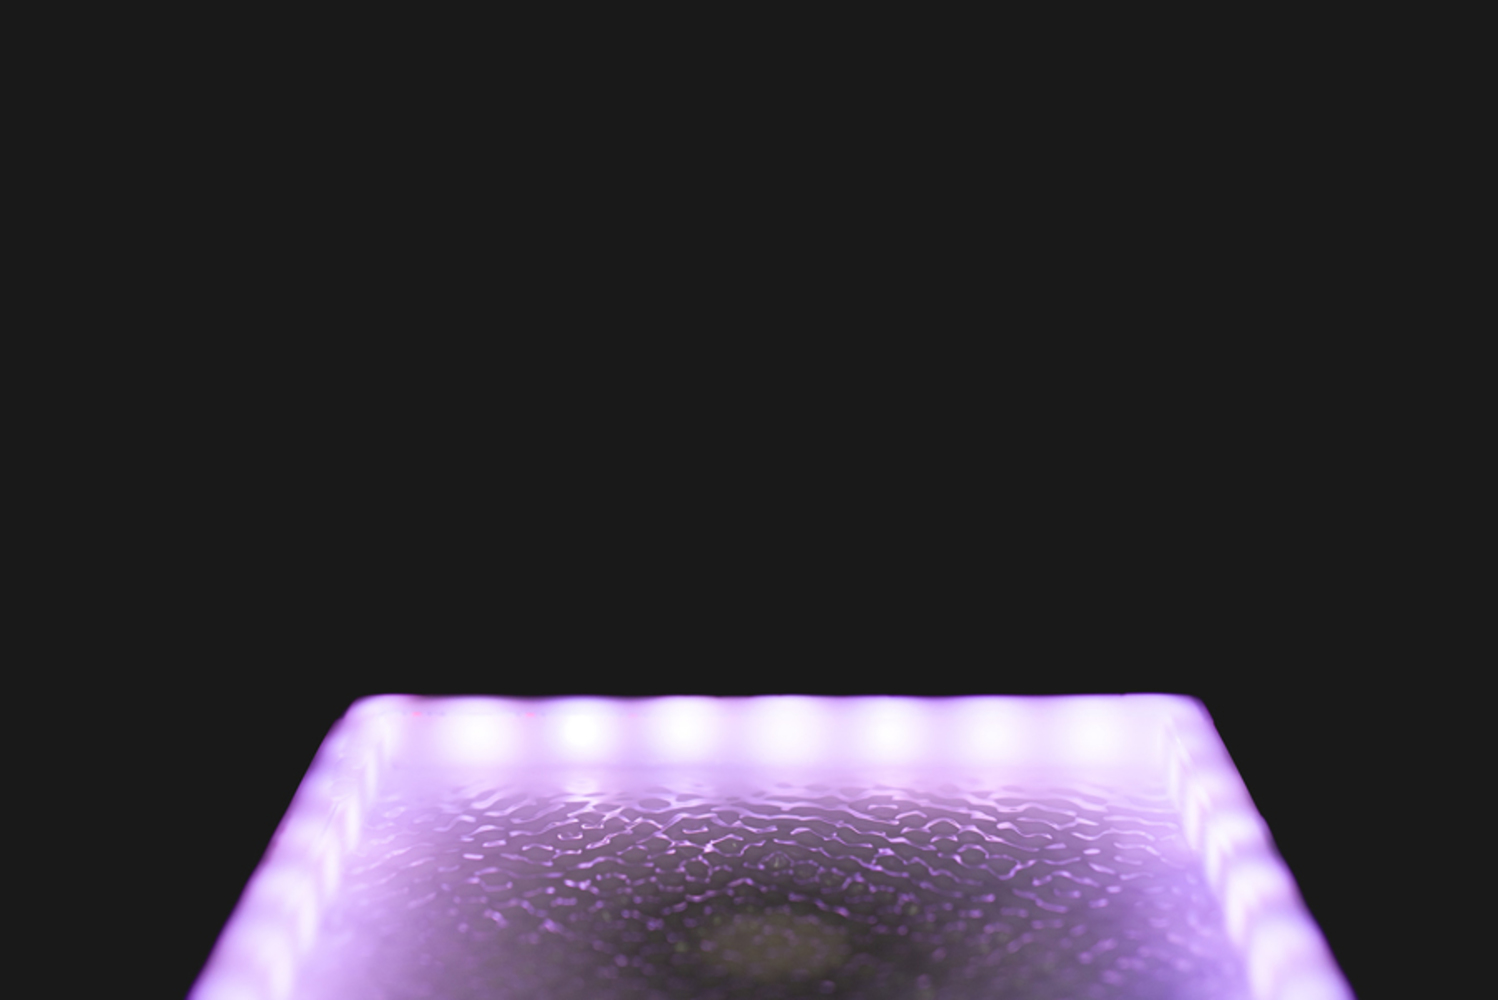
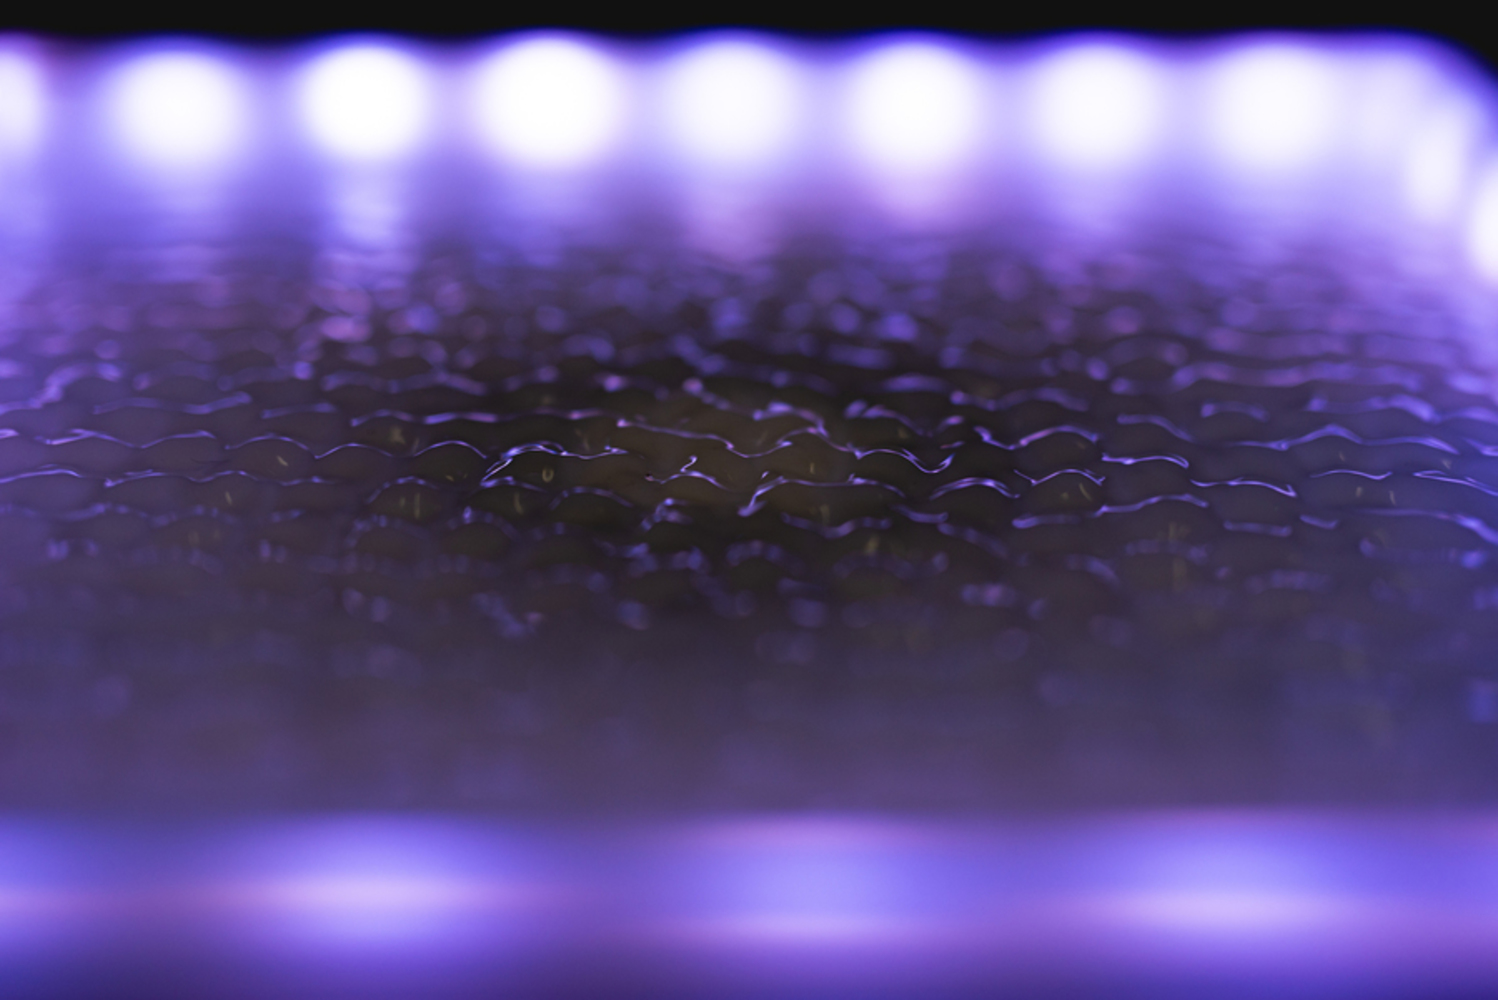
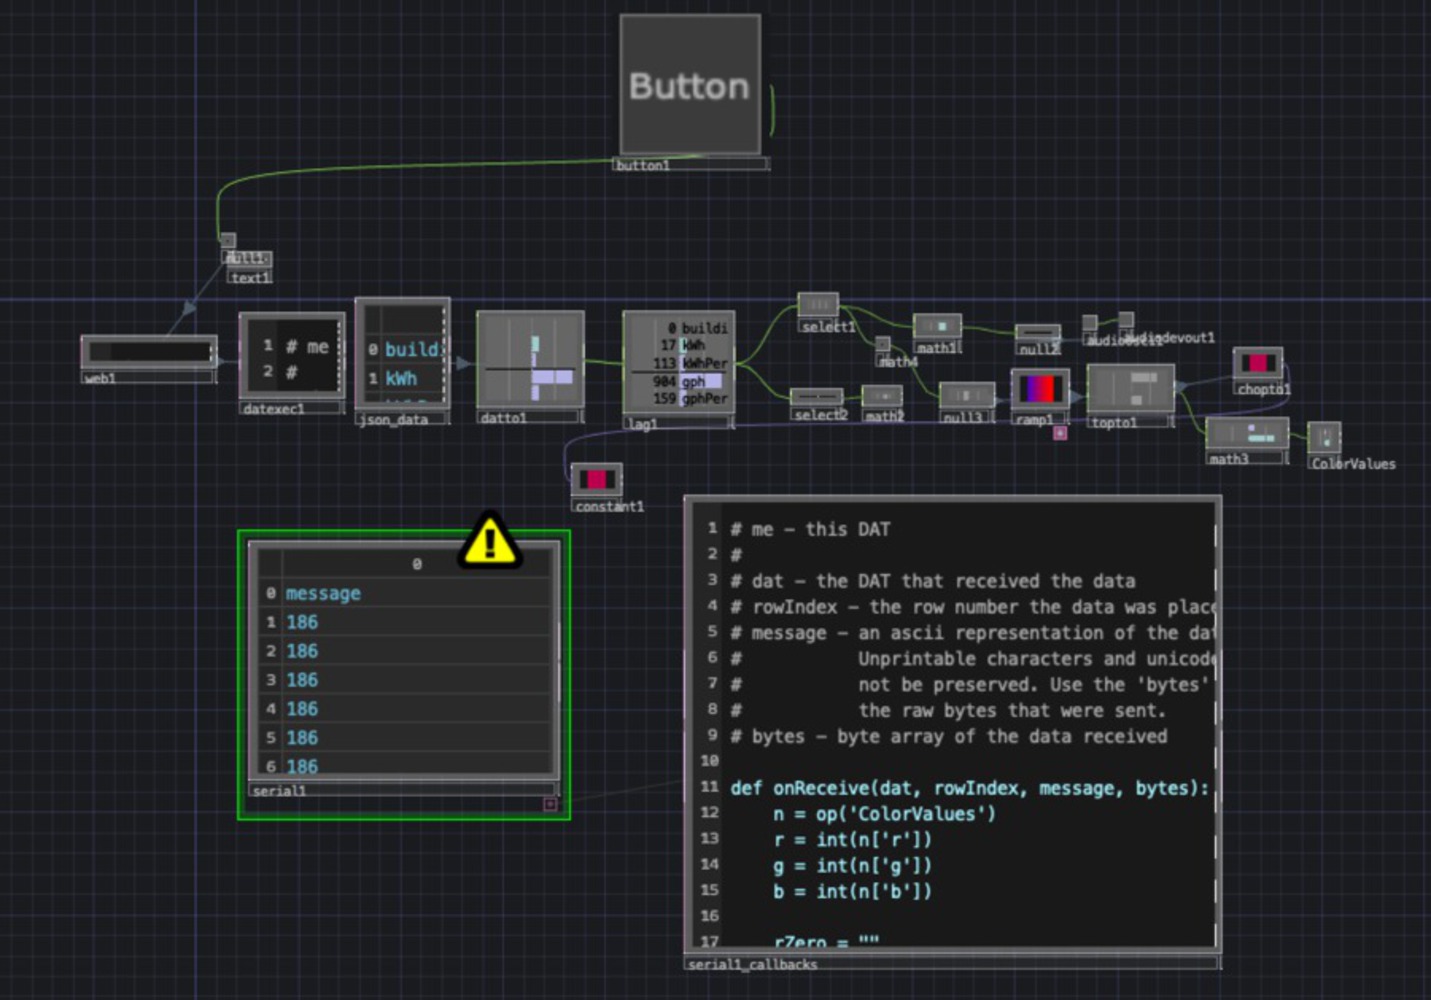
Because Chladni’s Plates create visuals through frequency, we had to relate the Carnegie Mellon University Facilities Management Services (FMS) data to a frequency. Using the TouchDesigner Math function we mapped the value of the current energy usage in relation to the minimum and maximum values for the data to a range of frequencies that would best create interesting visuals in the liquid. In a similar manner, we mapped the current water usage to a gradient between red and blue color values.
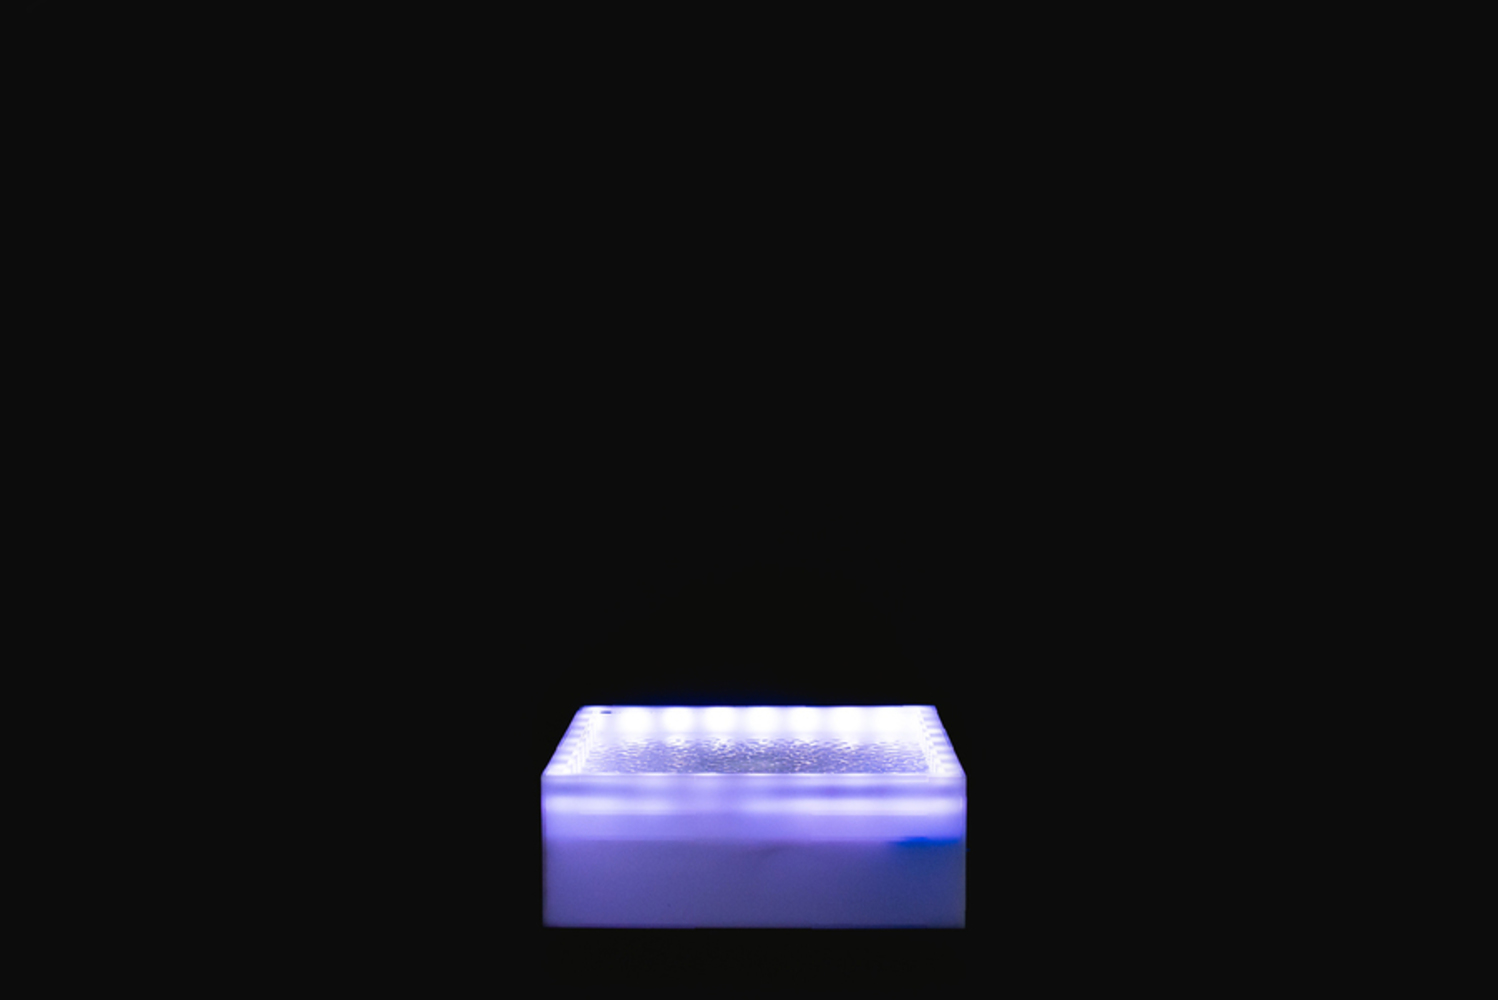
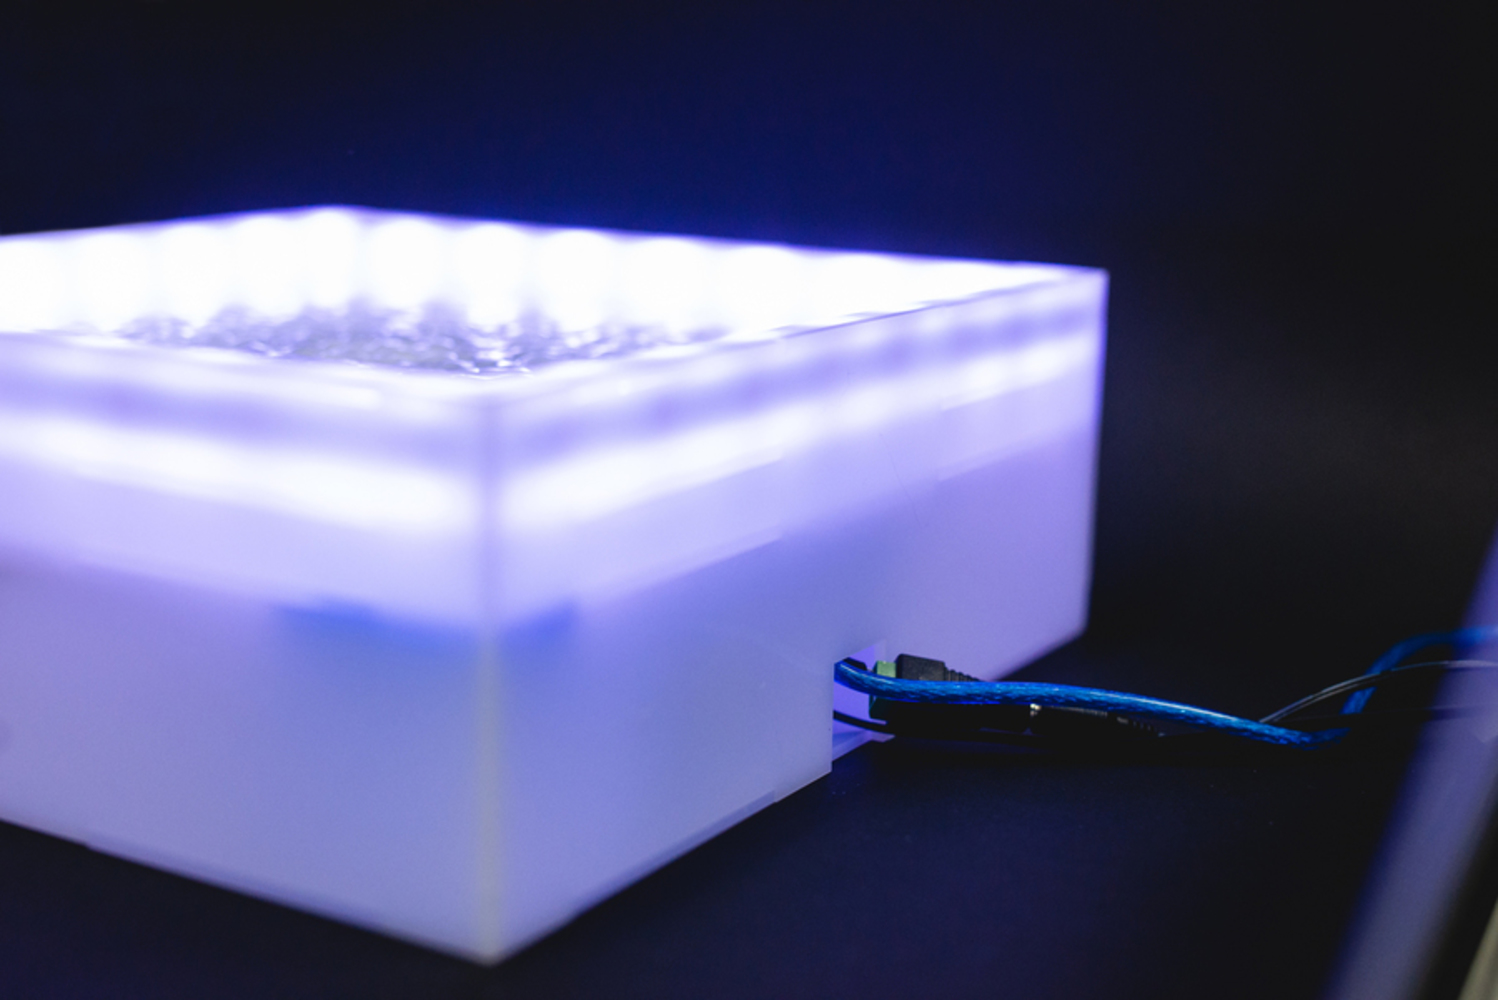
As for physical prototyping, we set a transducer, as a means of producing the vibrations, underneath the vessel holding the water. LED strip lights are placed around an exterior box to allow for diffusion of the hotspots.
