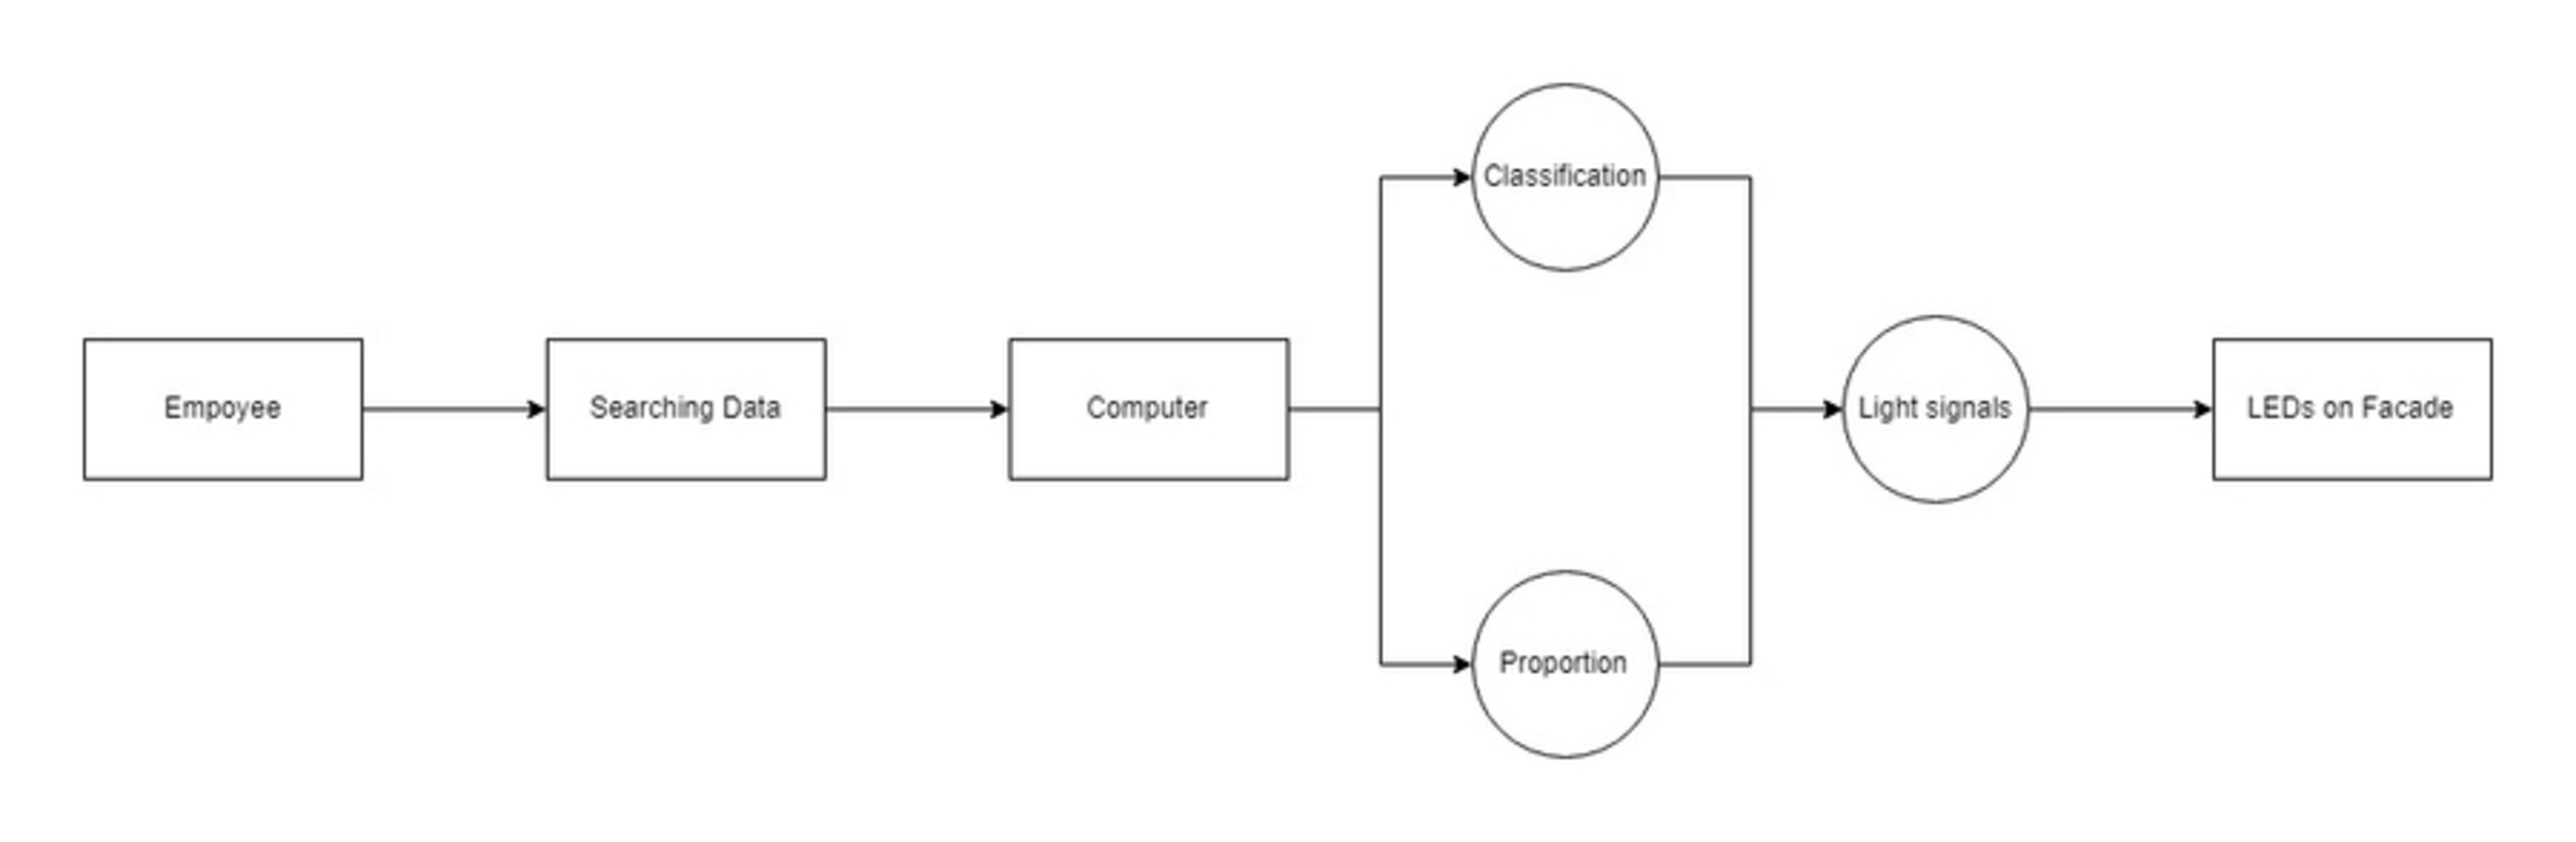
Back to Parent

Outcome


Rsma hw00 data flow.thumb
Show Advanced Options

Data Flow Diagram


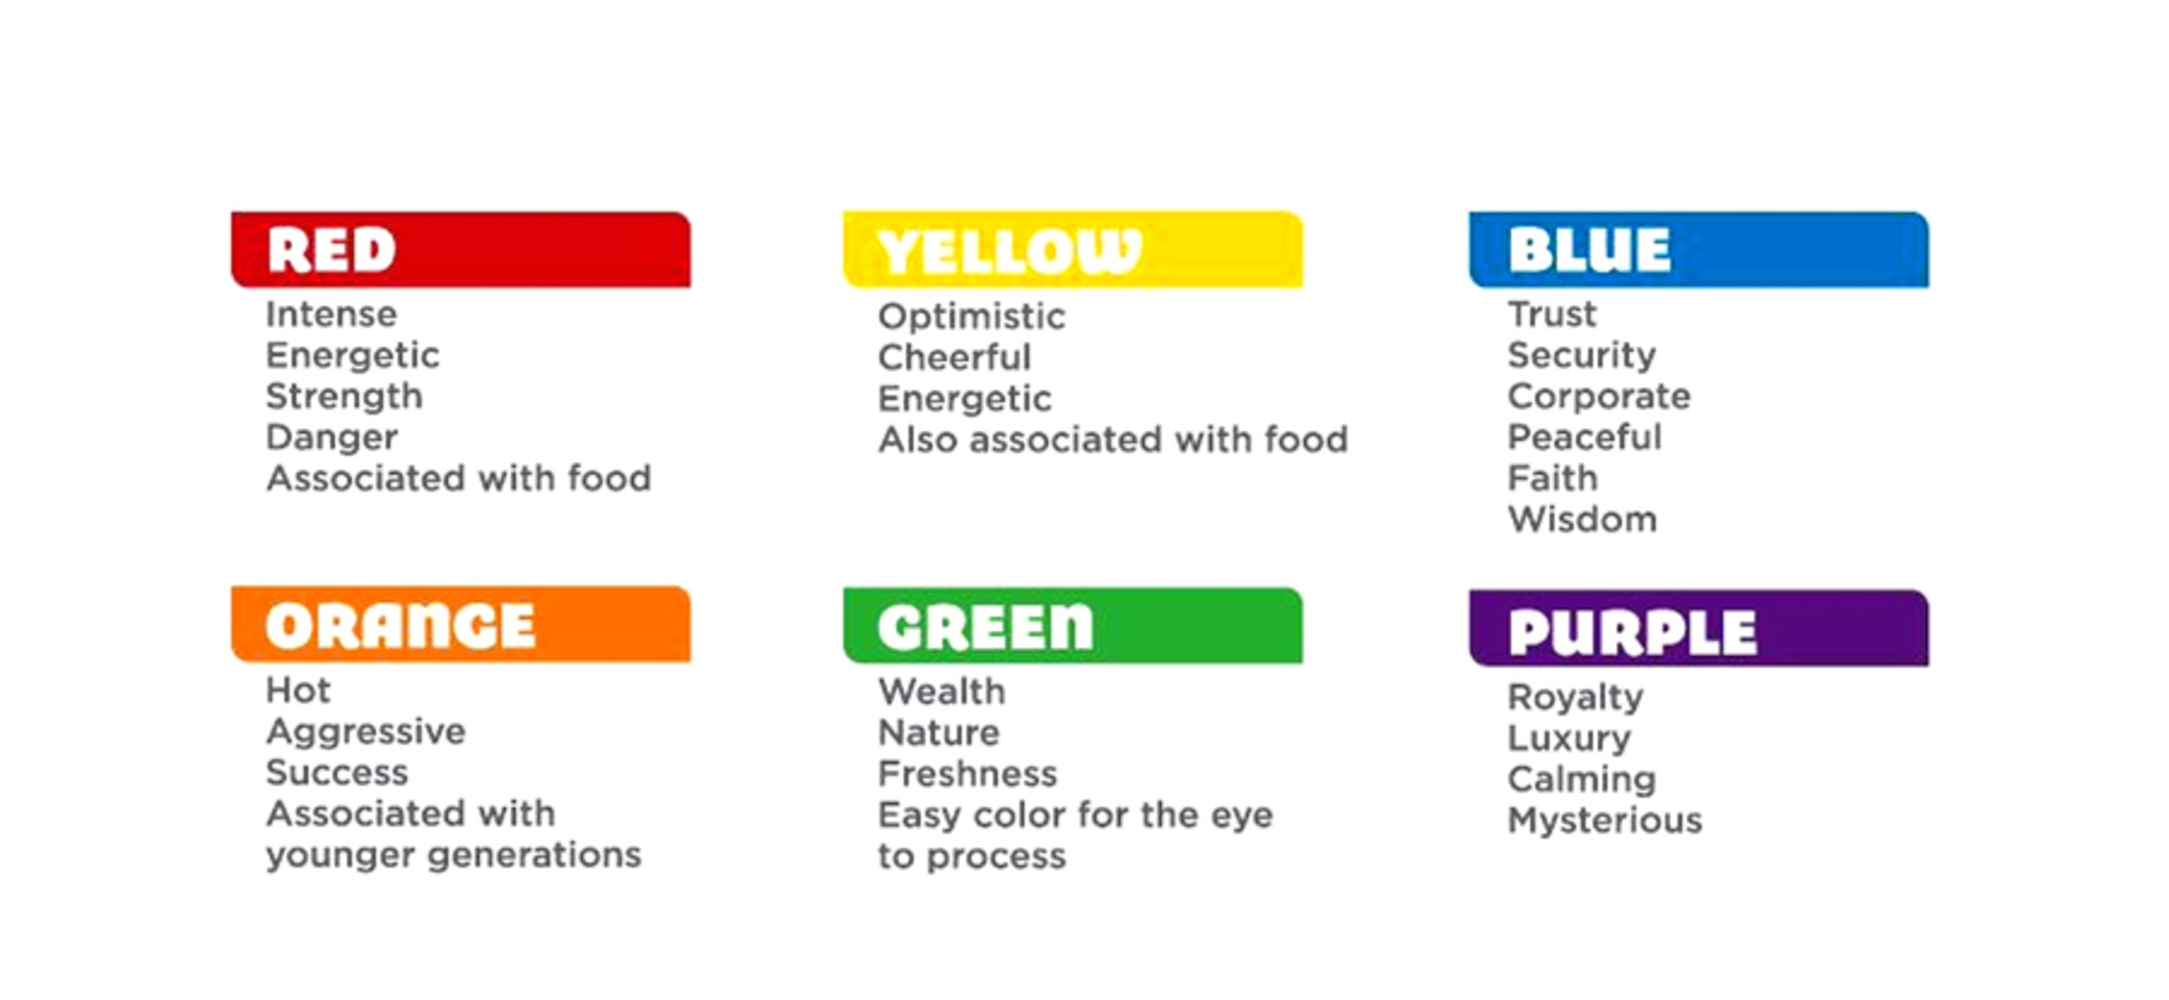
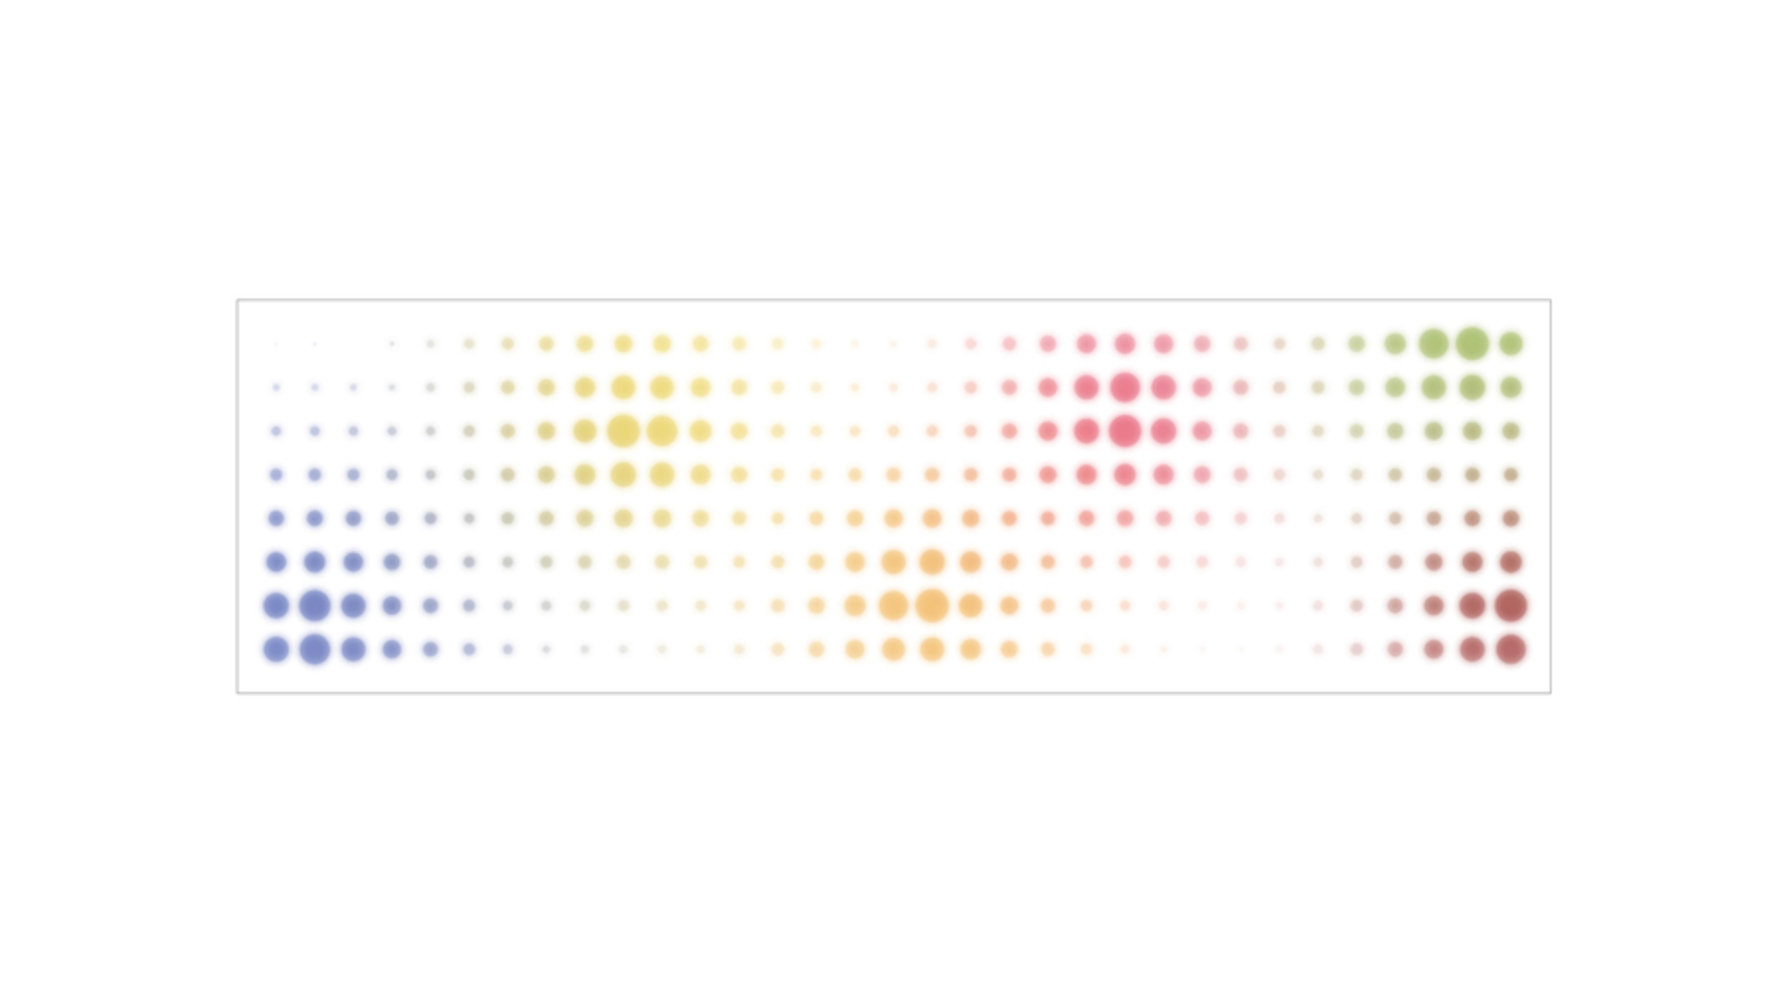
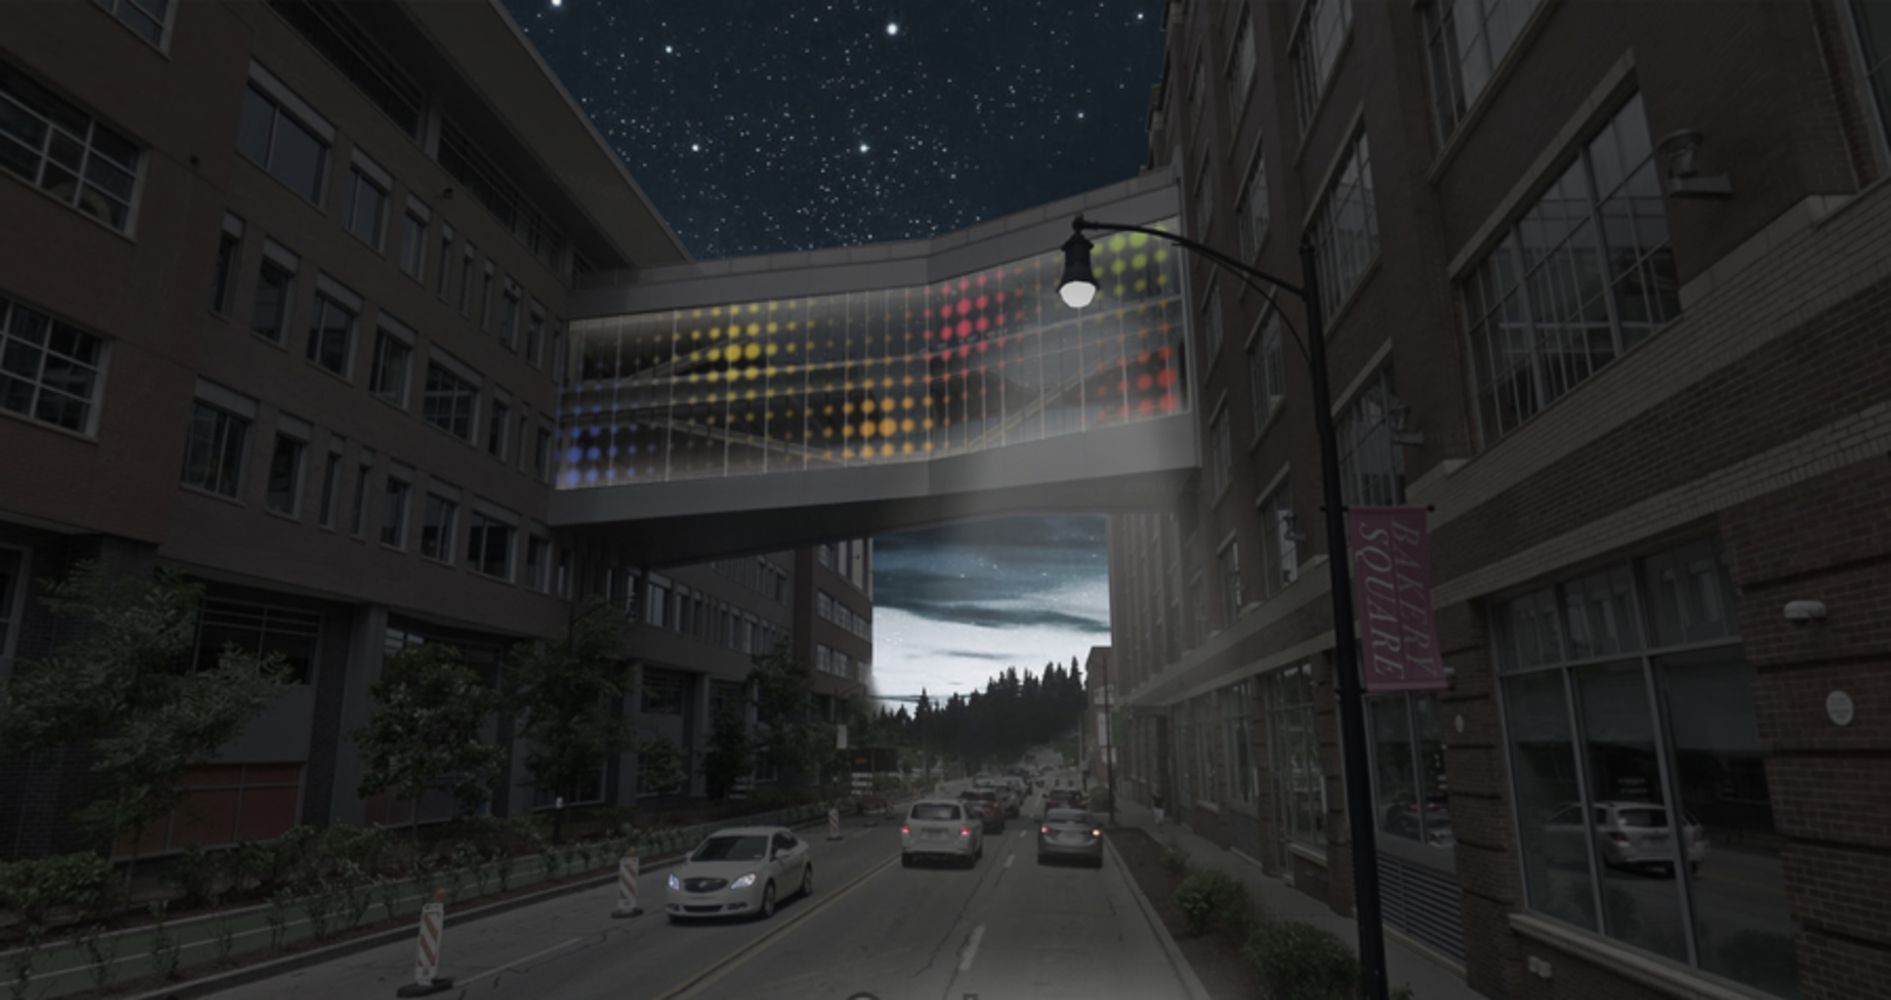
The data is collected as key words google employees used for searching. The computer uses machine learning technique to classify those key word data into a certain mood. By statistic analysis, we can also get the proportion of different moods. Each mood can be shown in a color on LED installed as a grid on the facade.

Color meaning.thumb
Show Advanced Options

Color Classification

Different kinds of mood can be represented in different colors as is shown. If one mood set is of great proportion, that group of light will be strong and occupy a large range. 

Pattern.thumb
Show Advanced Options
Render1.thumb
Show Advanced Options

Visual Experience

This light system not only provide light source for the people crossing the bridge, but also expressing feelings working inside the building to both workers and passengers. It serves as a media somehow communicating with the environment from inner spaces to outer spaces actively.

Bill of Materials

  1. 360 of Color Changing Smart LEDs, 2520 USD
  2. 1400 ft of wires,  910 USD
  3. Controller (Computer), 1500 USD
  4. Installation and Support Material, 400 USD
Total:  5330 USD
Drop files here or click to select

You can upload files of up to 20MB using this form.