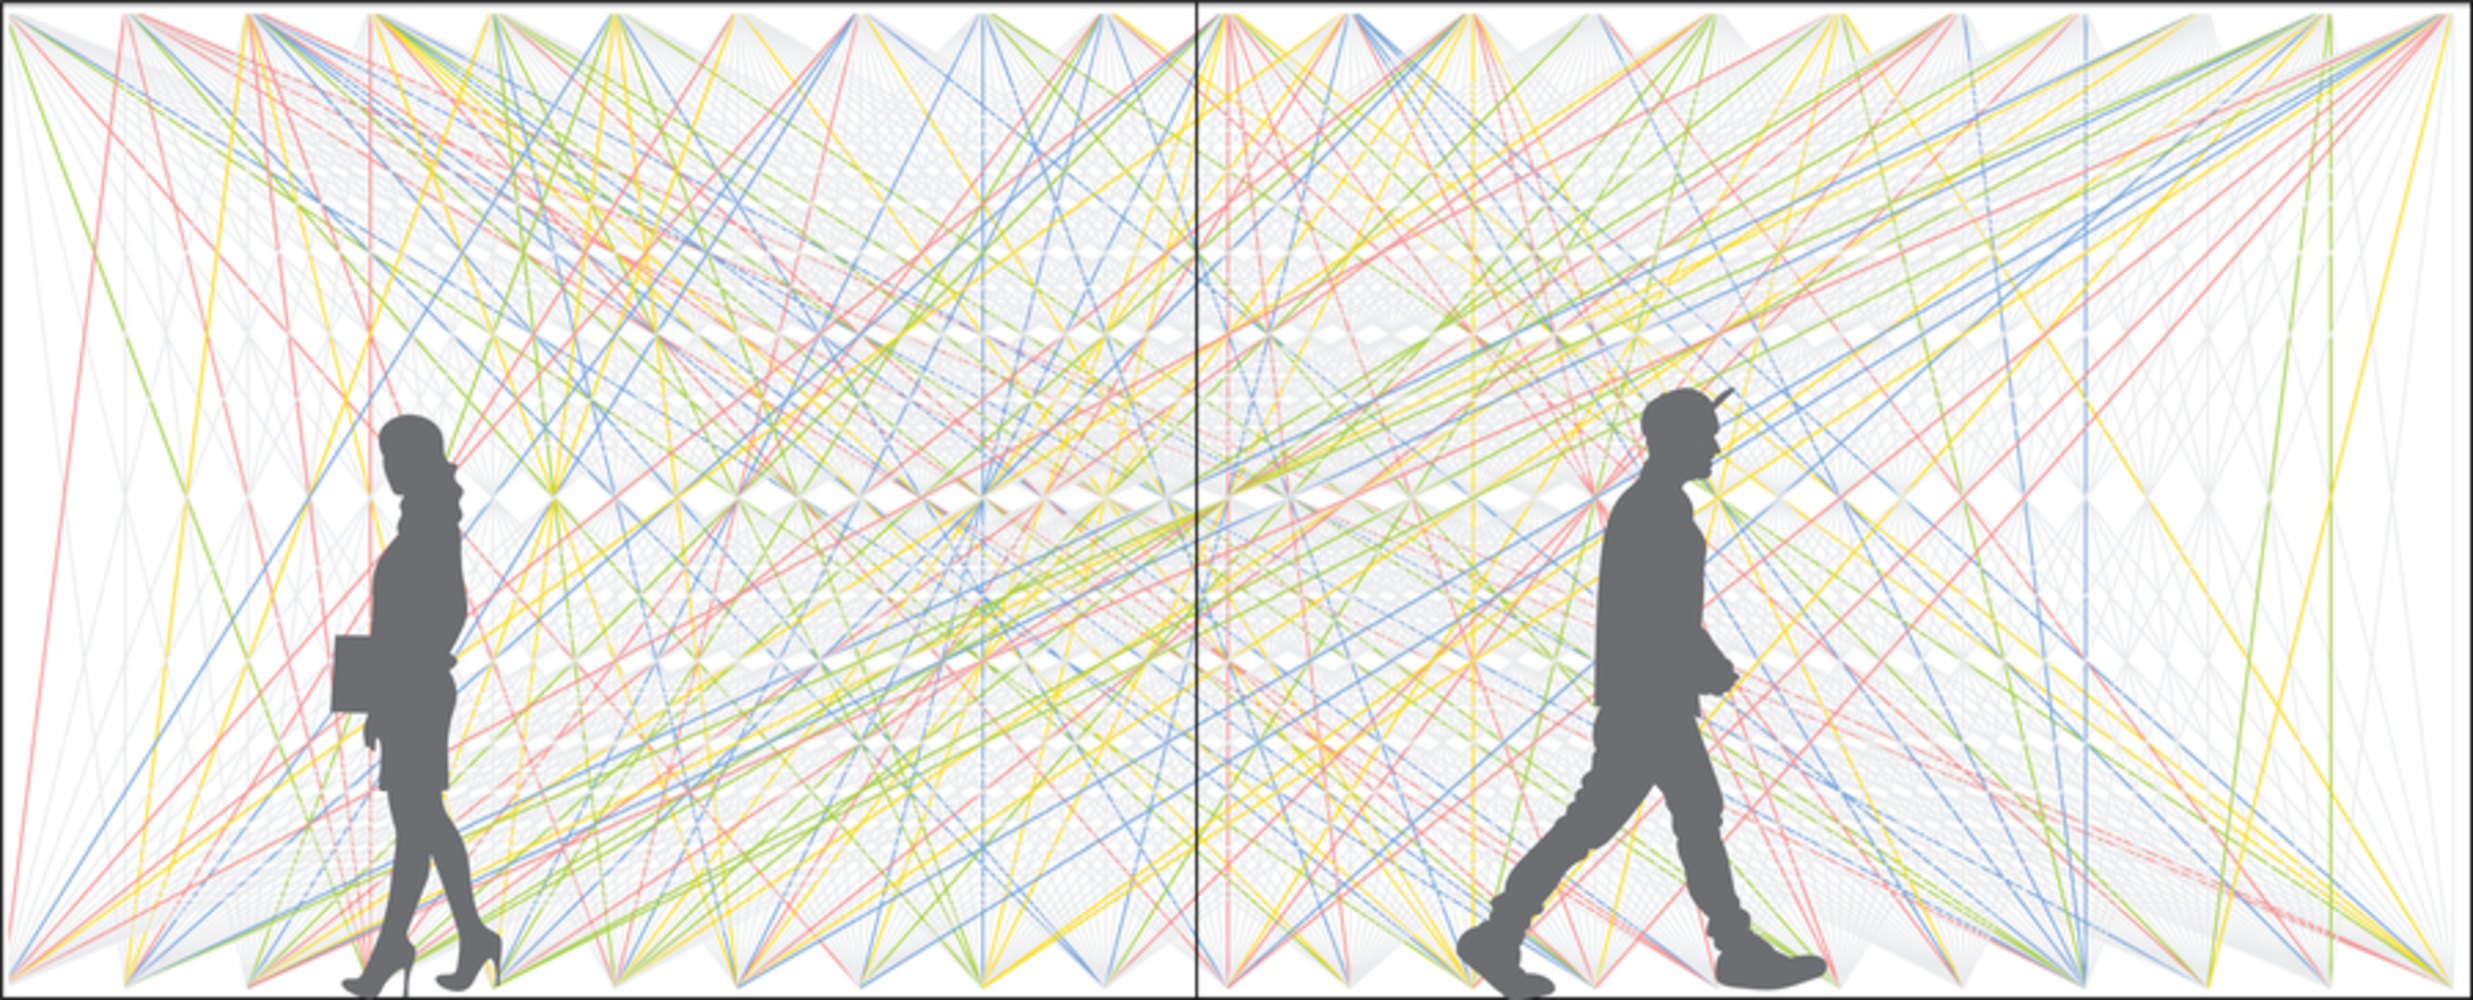
This installation serves to enhance Google’s brand image by addressing the elephant in the room: Google’s contribution to Pittsburgh’s gentrification. By using its latest technology to shed light on gentrification, Google can promote a sense of transparency and responsibility for the damage they have done. Their message would be as follows: while they deeply regret the effects of gentrification, its technology is used to find solutions for it.
Project description:
The top horizontal axis of the panel represents the latitude points of Pittsburgh. The bottom horizontal axis of the panel represents the longitude points. Each point along the axes would run from the lowest to highest number from left to right, and each latitude point is connected to its corresponding longitude point. Every connection from the latitude to longitude point would be laser engraved on the LED glass.
Using real time data from a deep mapping tool that identifies gentrified areas through Google street view (https://journals.plos.org/plosone/article?id=10.1371/journal.pone.0212814), if the tool identifies a certain area with (latitudeX, longitudeY) as being gentrified, the LED glass shines a light from the corresponding latitude point to the longitude point. The different colors represents the different neighborhoods in Pittsburgh.
The interaction is simple. If a user walks by the panel, a motion sensor would detect the movement and tell the light beam to trickle down from top to bottom in a gradient effect. The passerby can enjoy the interaction while walking through, and the interaction would catch the attention of onlookers from below.
As the data is transmitted at real time, viewers can better understand the changing landscapes of Pittsburgh through the updated data viz day by day.
Here is the general data flow:
