Back to Parent

Outcome


Show Advanced Options

Intention

As we struggle to crawl through our daily chores, we could only focus on a few things at a time. Working, studying, making, learning, we almost never pay enough attention to our immediate environment and surroundings. Thus we are motivated to design and develop a solution that can keep track of what's happening around us when we go about with our daily routine. It should provide us a chance to self-reflect and encourage us to be mindful of what often gets neglected in life.
Context

The concept of self-tracking is nothing new. There are ample examples affiliated with the Quantified Self initiative* that log, study and visualize data for purposes like health monitoring, self expression and more. We want to build upon such concept of self quantifying, and make informed decisions on both tracking and interpreting personal data that better suit our somewhat less tangible goal: being mindful about the world we live in.

Process

We were quick to decide that we want some form of wearable device that logs environmental data according to the wearer's movement. I was also clear that we need some method to translate those data into a cempelling visual representation, which can in turn be presented and archive in some format resembling elements of a timeline.

We would like the experience of wearing and using this device to be personal, but also sharable. It could potentially be a conversation starter or a social topic that groups of people would talk about.

Product

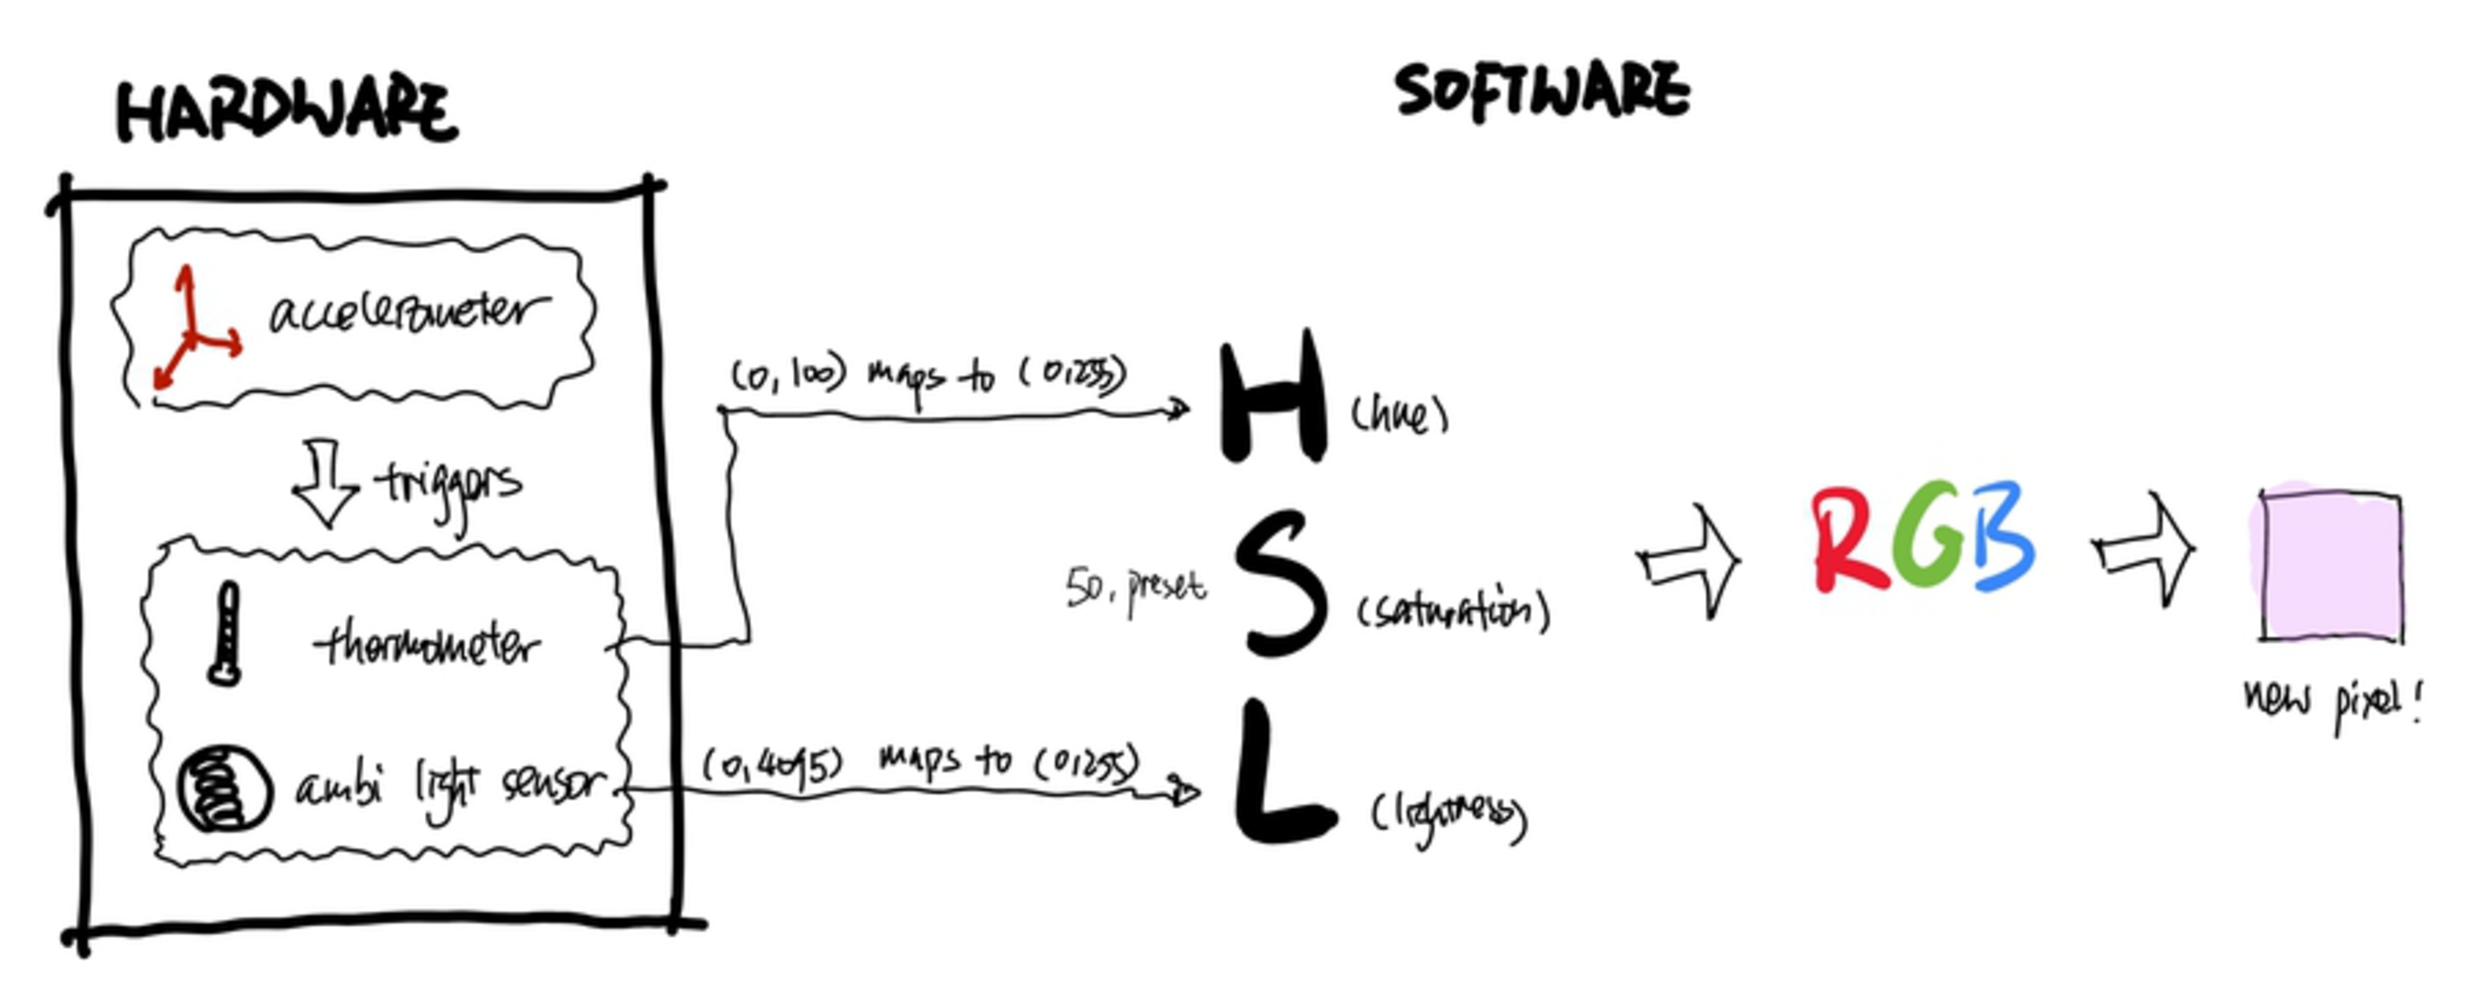
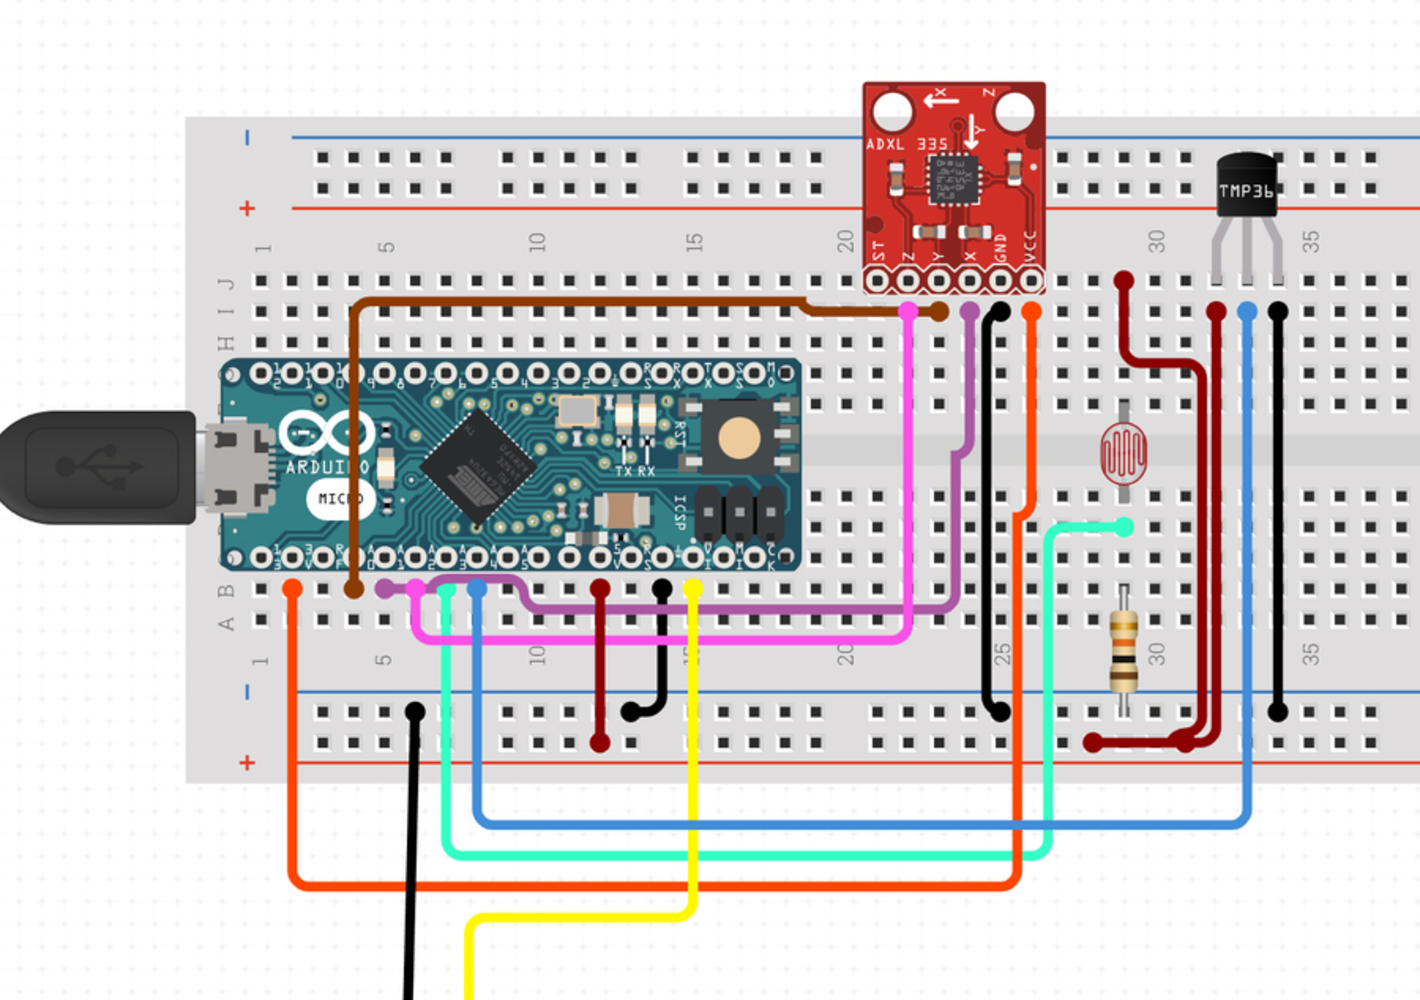
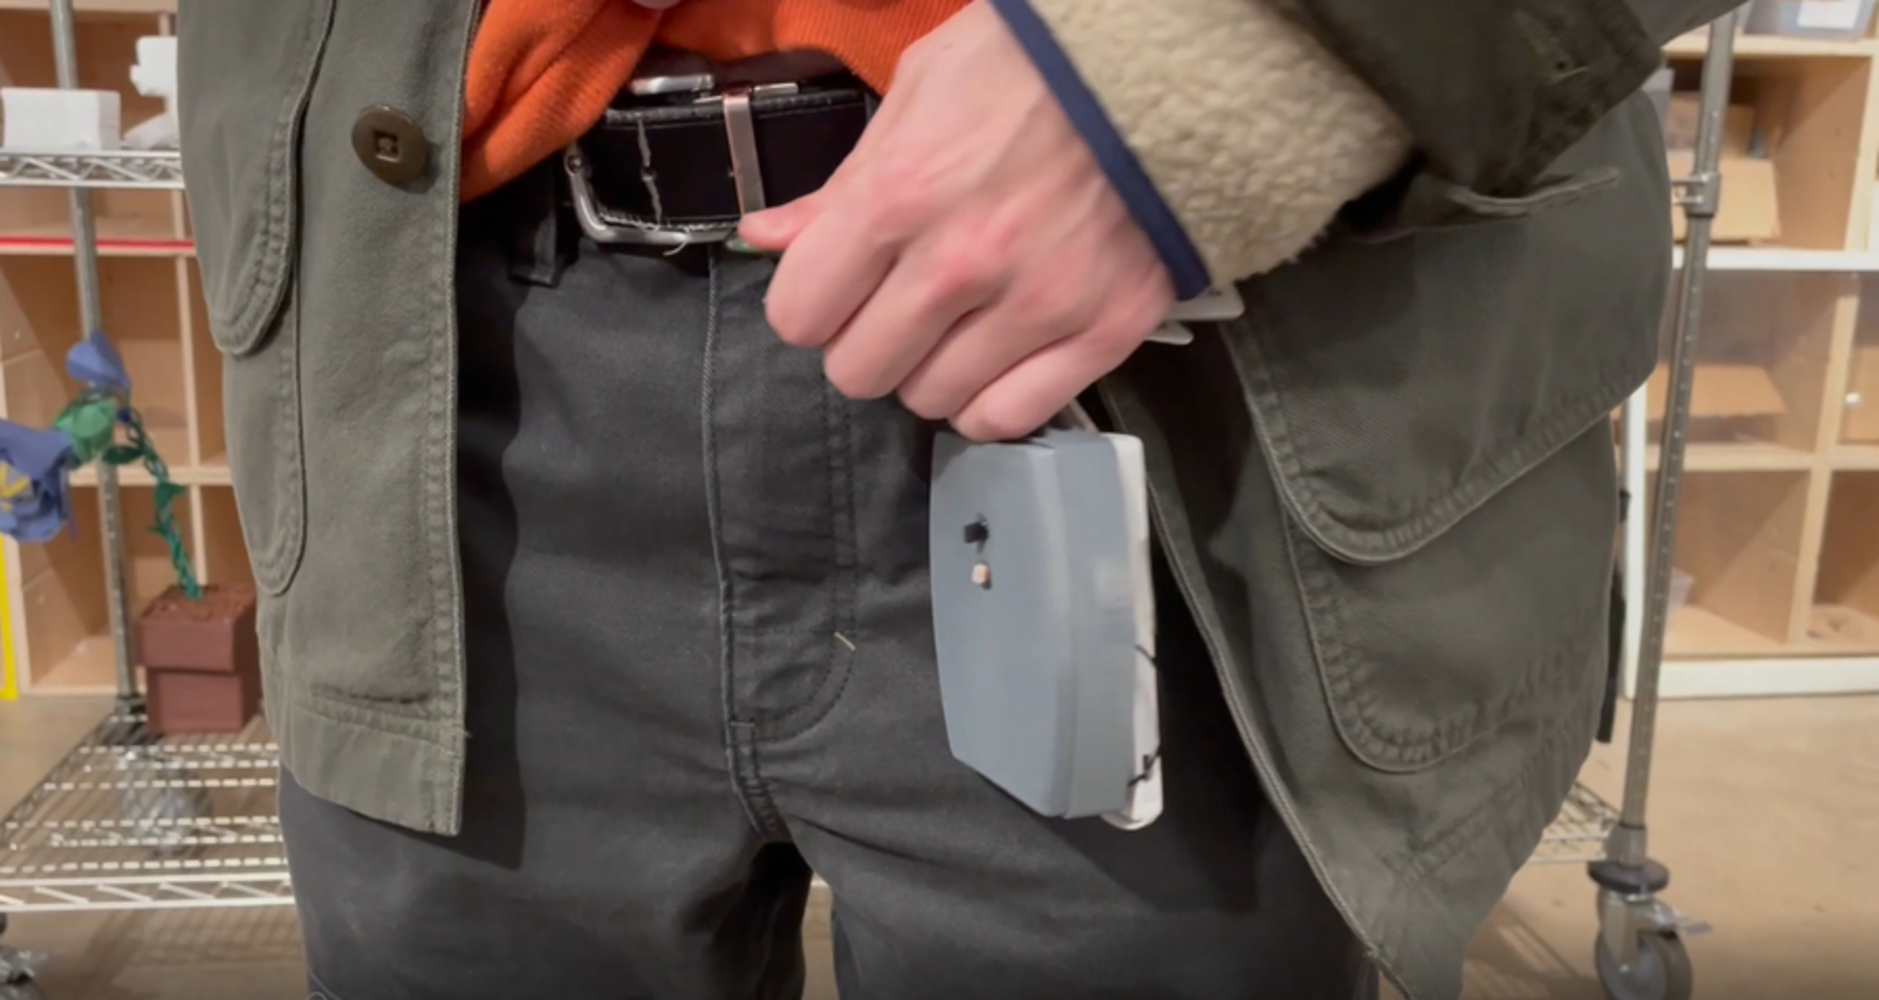
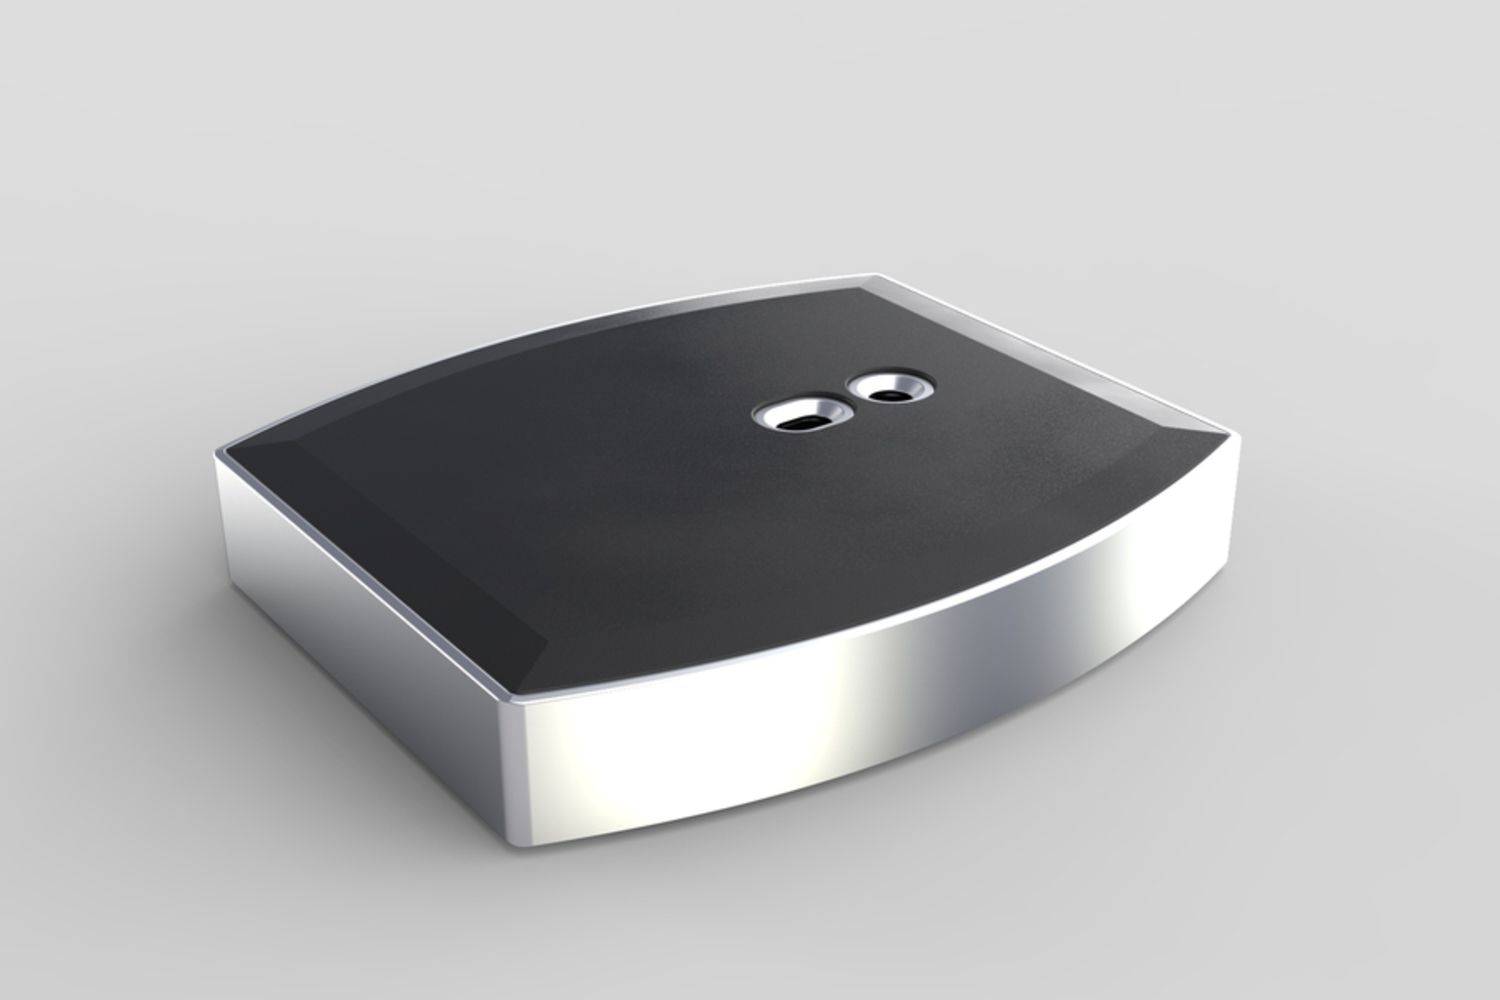
Our final product is a wearable device that can clip onto a lanyard, keychain or a pocket. It is based on a particle argon microcontroller with onboard an accelerometer, a thermometer and an ambient light sensor. The accelerometer detects motion, and triggers the device to send temperature and light readings to cloud whenever the wearer moves. 

Photo.thumb
Show Advanced Options
Retrospectre.197.thumb
Show Advanced Options

Additional software would run on a server to log data sent by the wearable. At the end of a day, it translates a day worth of data into a pixelated image. Specifically, each temperature and light reading is mapped to a HSL color, with temperature mapped to hue, light mapped to lightness and the saturation is predetermined. Then the HSL color can be easily translated to a RGB color. With hundreds to thousands of readings a day, we can arrange all those pixels into a 2D array to form a pixelated image representation of the wearer's day.

The image is automatically uploaded to an instagram account associated with the wearer, allowing them to check back and reflect upon their day.

Ins2.thumb
Show Advanced Options
Explain.thumb
Show Advanced Options

Reflection

It has been a very pleasant project to work with. In the beginning, we were not quite sure if the images would be visually substantial by our method of translation, but the images generated from our sample data are reassuring.

If we were given more time, we would work on improving the physical housing of the wearable, and shrink down unnecessary components like breadboard and wiring to make a more compact and desireable device. We would also experitment with different methods of translating sensor inputs to colored pixels, as our current method has its own limitations (namely it tends to produce too much green and purple), and the current mapping is not the most intuitive for users to understand. The publishing platform is also worth reconsidering, as instagram contents could only be layed out as image feeds. Arranging images in a montly or even yearly overview format could lead to even more subtle and valuable observations.

Schematics and code samples

Show Advanced Options
Argon wiring.thumb
Show Advanced Options
Drop files here or click to select

You can upload files of up to 20MB using this form.