Back to Parent

Outcome


Intention

Commuting to campus by bus this semester, which is mainly 61 A / B / C / D, it is really common to see them come and go all together. As can be seen from the photo, it looks almost like a train coming through when is 4 of them arriving at the same time. 

Visualization created by CMU alumni Mark Egge is an amazing illustration for how bunching 61 routes are appearing in areas around the campus. [1]

Imagine when the weather gets worse and you miss a couple of buses that came together. This is really not a pleasant experience. And we would love to have a device that perhaps show us weather and bus status. 

Bunching.thumb
Show Advanced Options
Photobunching.thumb
Show Advanced Options

Historical Case

Weather System by Studio PSK [2], Paper Signals by Isaac Blankensmith [3], tempescope by Ken Kawamoto [4] are fascinating cases that signals and subtly display the weather, by sounds, visualization and motions. The key take away for us is that the status and translation of signaling by different types of actuators that creates various possibilities.
Casestudy.thumb
Show Advanced Options

Expected Interaction

The project would be consisted of bus info display kit and the weather display kit. 
The bus tracker would be a box with an acrylic piece embedded in that could display different colors with a Neo Pixel strip or a few LED inside of the box. Interactions are pictured to be reminding users to get prepared to go get a bus, go down stairs to the bus station and lastly, inform that user might need to take another bus. When the bus is arriving, the light would start to subtly shifting to a blue or green hue. When is about time to go to the station, the transition would be quicker. And fading to a yellow color would mean that the bus is now here or gone.
The weather kit would show actions by solenoids working with wood or plastic sticks as well as plastic beads to display rain and snowfall respectively.

Bus.thumb
Show Advanced Options
Snow.thumb
Show Advanced Options
Rain.thumb
Show Advanced Options

Estimated Bill of Materials 

  • 10 Solenoids (at least): To create motions for signaling rain and snow status
  • Wood Stick: Mocking rain
  • Small Plastic Beads: Mocking snowfall
  • Neo Pixel Strip or LEDs: Display bus status
  • Wood and Clear Acrylic for Laser Cutting: Fabrication of the device

Process of Bus Tracker

In terms of API for bus information. We managed to receive an API key from the PRT and start with the information provided. Among these we found that route data or vehicle locations might be useful. Also we tested with the web hook from prt to see how the API works.

When started to test with data from multiple routes and couldn't visualize the data in a legible way, as the indicators would get more complicated. So you went back to the one route solution. We chose to hook our argon with the data of prediction time for inbound bus route 61D at Forbes & Morewoods that takes all of the team members back to residence in Oakland from campus.

Below is the photo showing the process of testing the bus tracker on serial print monitor. We started with mapping the maximum brightness of the LEDs using the prediction time into the range of 255-100, meaning when the bus is almost there it would be fully on in red, when it is far away it would be a dim blue light. But it appears that the dim part of yellow and blue is not really seen. So we chose to map the brightness of each LED using its time within its range of loop. In that case the brightness is more obvious in every time range. 

We also found that the the analogWrite() could not turn the LED completely off and found some clear explanation on the Arduino Reference Page:

The PWM outputs generated on some pins will have higher-than-expected duty cycles  ... and may result in a value of not fully turning off the output. [5]

On argon the duty-cycle of each PWM group is not stated clearly, judging from the fact that the red LED is brighter than D4 and D6, D2 has a higher duty-cycle than the D4 and D6 pins. To solve this it would be necessary to add a digitalWirte( ledPin, LOW) to make sure that the LEDs are completely turned off when the loop finishes. But from a perspective of ambient display, what's the harm of a LED that is almost off? It might demonstrate a status without catching too much attention.

Urlexample.thumb
Show Advanced Options
Busprint.thumb
Show Advanced Options

Process of Snow Ball

If there is a comparison between the ideas in the team, snow ball would be our favorite.

In terms of the weather api by Open Meteo, we tested with requesting temperature, rain, snowfall and weather code data. The rain and snow data is in format of depth. Because we did not have a clear clue of that indicators we were using some rather vague ranges for the if statements.
https://api.open-meteo.com/v1/forecast?latitude=40.4406&longitude=-79.9959&current=temperature_2m,rain,snowfall,weather_code

It didn't took us that long that the solenoids couldn't really punch enough beads to the air for that effect.

After that we started with testing with a 5 volt mini dc fan (photo below), we got a first go with that. Prof. Daragh encouraged us to use a much more powerful 12 volt dc fan and that feels like we finally got the chance to use a proper fan.

To test the effect we started with a rough model composed of a plastic cup, aluminium mesh screen. But in order to minimize the beads from flying all over the place, a rubber band, which is suggested by Prof. Daragh is really helpful. Among the material tested we found the appearance of the foam bead is really intriguing so we decided to work on that.

The pattern of the DC motor moving backwards is also a treat, during the test process, it kept spinning back and forth smoothly as we were testing on the granite counter top (see the YouTube video below).

Also we notice that id we point the fan up the structure of the DC fan with a framework blocking the center of the fan would block the air from blowing to the middle of the container. By reverse the direction, the air sucked out of he container tend to have a more decent result to blow on all the bead.

Weatherapi.thumb
Show Advanced Options
Material test.thumb
Show Advanced Options

Process of Rain Drops

Our initial thought was to simulate the rain drops by the movements of wood stick by solenoids by the movement and maximum distance of that pattern is not an ideal choice for us. 

Prof. Daragh suggested that we might need to use a servo or stepper so that we could enlarge the distance of the wood stick for that movement. But this also means that the movement is going to be rotating and tilting within a range of angles, which didn't seem like an effect that we would  love to work with.

Unfortunately we gave up on that idea, but I hope I could come up with a better solution that both generate a vertical movement. For instance, when writing up the documentation I'm thinking about using a hobby motor to control a little stick that is hung on a thin rope.

Resulting Prototype

Content:

1. Final Bill of Materials
2. Fabrication Files
3. Workflow Diagram
4. Photo
5. Demo Video

Final Bill of Materials

  1. Microcontroller:
    Particle Argon x 2,

  2. Wiring:
    Alligator Clips x 2, 
    12 Volt Adaptor,
    USB micro B cable x 2
    Red, Blue and White Wires and wire stripper in Physical Computing Lab

  3. Components:

     N5192G Transmitter x 1
    Diode x 1
    LED lights x 3
    Resistors: 1 K ohm x 3, 47 ohm x 1  

  4. Motor:
    DC Brushless Fan: Delta Electronics AFB 1212 H, 12 V, 0.35 A

  5. Fabrication:
    1/16 '' Basswood, 22 '' x 11.5 ''

    1/8 '' Black & Clear Acrylic, 24 '' x 18 ''
    Tacky Glue, Scigrip Acrylic Glue
    Aluminum Mesh Screen, Wire Cutter
    Small Foam Beads: Dissembled from wrapping material

Lasercutscreenshot.thumb
Show Advanced Options

Workflow Diagram  

Workflow.thumb
Show Advanced Options
Bus.thumb
Show Advanced Options
Snow.thumb
Show Advanced Options

Video

Containing demonstration of Snow Ball and Bus Tracker.

PS: The weather condition is not changing into every assumed conditions so specific pattern is trigger manually.

Show Advanced Options

Conceptual Design:

By rebuilding the project, we approach some possible ways of designing an ambient display of data. How to imagine interaction and scenarios in the future? This question would rely on evaluation of previous interactions and patterns that were involved in a seemingly careless way.

First, inspired by Daniel, we could try to monitor and simulate the falling leaves outside the window. Imagine an array of small leaves blowing IoT devices on the desk, or your table. It could inform you when the Autumn comes, by making you feel how the fallen leaves would fly in the air. It don't have to be a big movement, the dialogue and pattern this could enable is just compelling all by itself and its own ecosystem.

Second is to refine the bus tracker so it response to the snowData event published from the snow ball and multiply the estimated time of the bus and provide a more detailed and interactive ecosystem. Also, adding rain, wind and other possible and influential factors.
(Inspired by Dina, see code below)

Third is to refine the mechanism for rain drops and find a similar expression that is both fun and delicate. For instance, using a hobby motor to pull a string that is attached to a little wood block, making it move like dropping. And when the wood stick remains below the surface it could serve as a solenoid to punch the beads or other pieces upwards, providing potential possibilities to combine different expressions and patterns.

Diagramideas123.thumb
Show Advanced Options
Diagramideas12.thumb
Show Advanced Options
Diagramideas1.thumb
Show Advanced Options

Reflection and Critique:

Compared with the pre-mortum, the approach is almost totally different for the snow ball. We use fan instead of the proposed solenoids to simulate the movements of foam beads. In return we got more beads moving in the container. But, it is really what's like a snowfall? Having multiple solenoids meaning the movements would be incidental and more delicate. Maybe the scale we are using is a little brutal and too similar to a storm? At last, for the bus tracker, could it use another way of expression rather than sticking to the LEDs.

The difference here is because the team was kind of leaning towards the fun in doing the project instead of exploring subtle and ambient way of telling the data. We do have fun and it is definitely a treat for us. However, in terms of the delicacy, we might have done wrong. For the idea of ambient display and translation of information, previous work is always inspiring and worth revisit. And they would always stand for classical cases to be compared with.

Take away from the Final Demo:

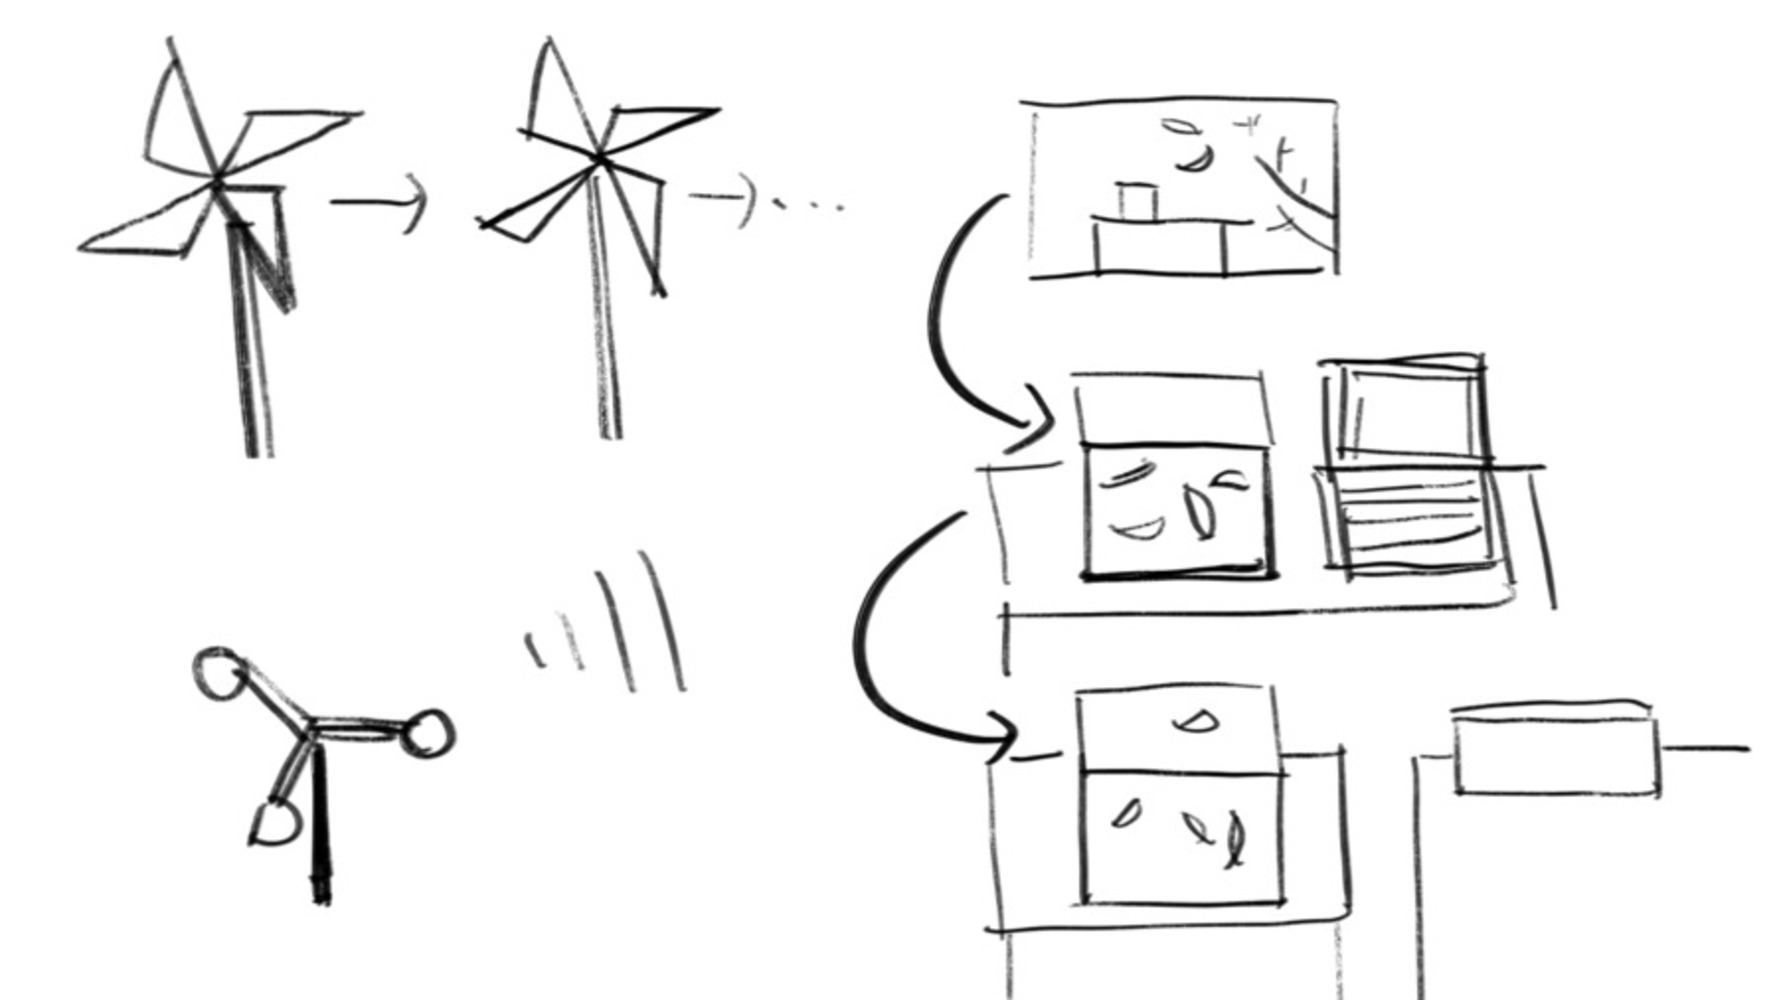
Daniel: a possible way of iteration

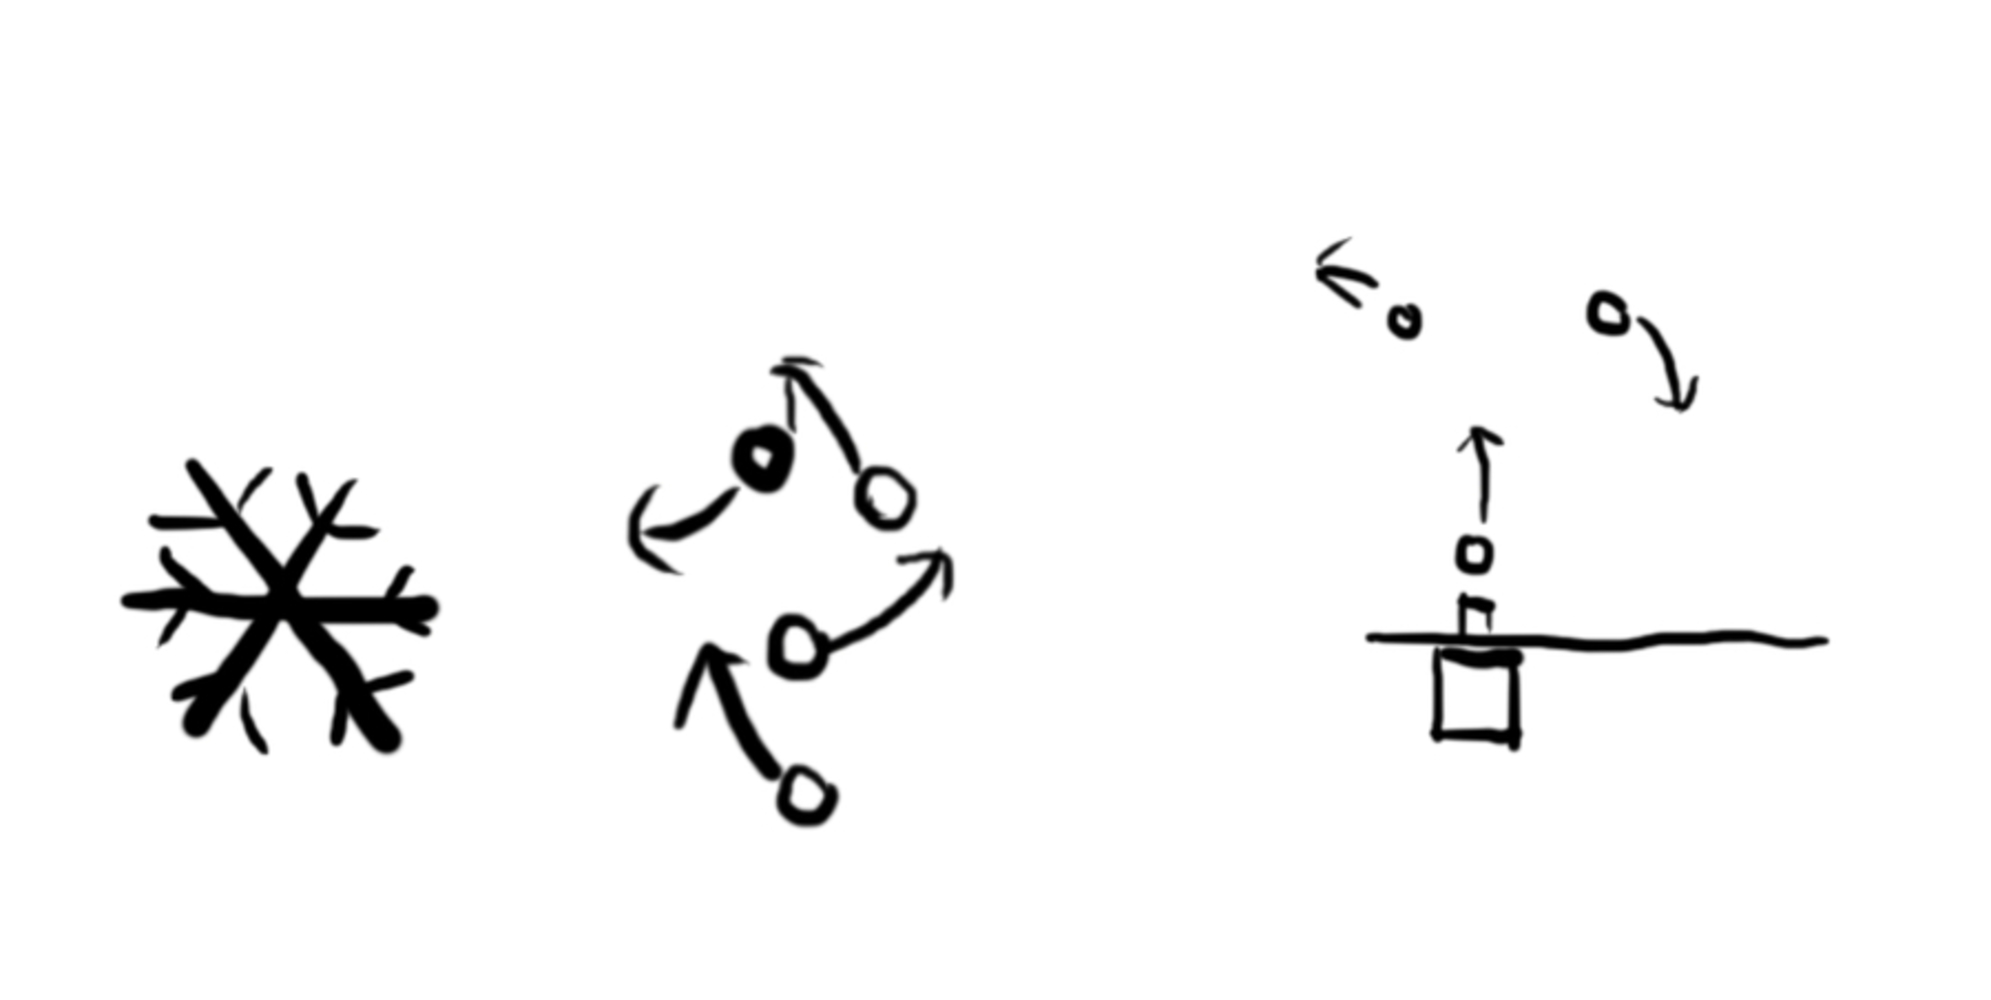
"You know, like the pinwheels."

Daniel shared with us a poetic idea and we think this is an amazing iteration. He suggested that instead of an occasional event, subtle display of wind or falling leaves is also another natural pattern that could be simulated.

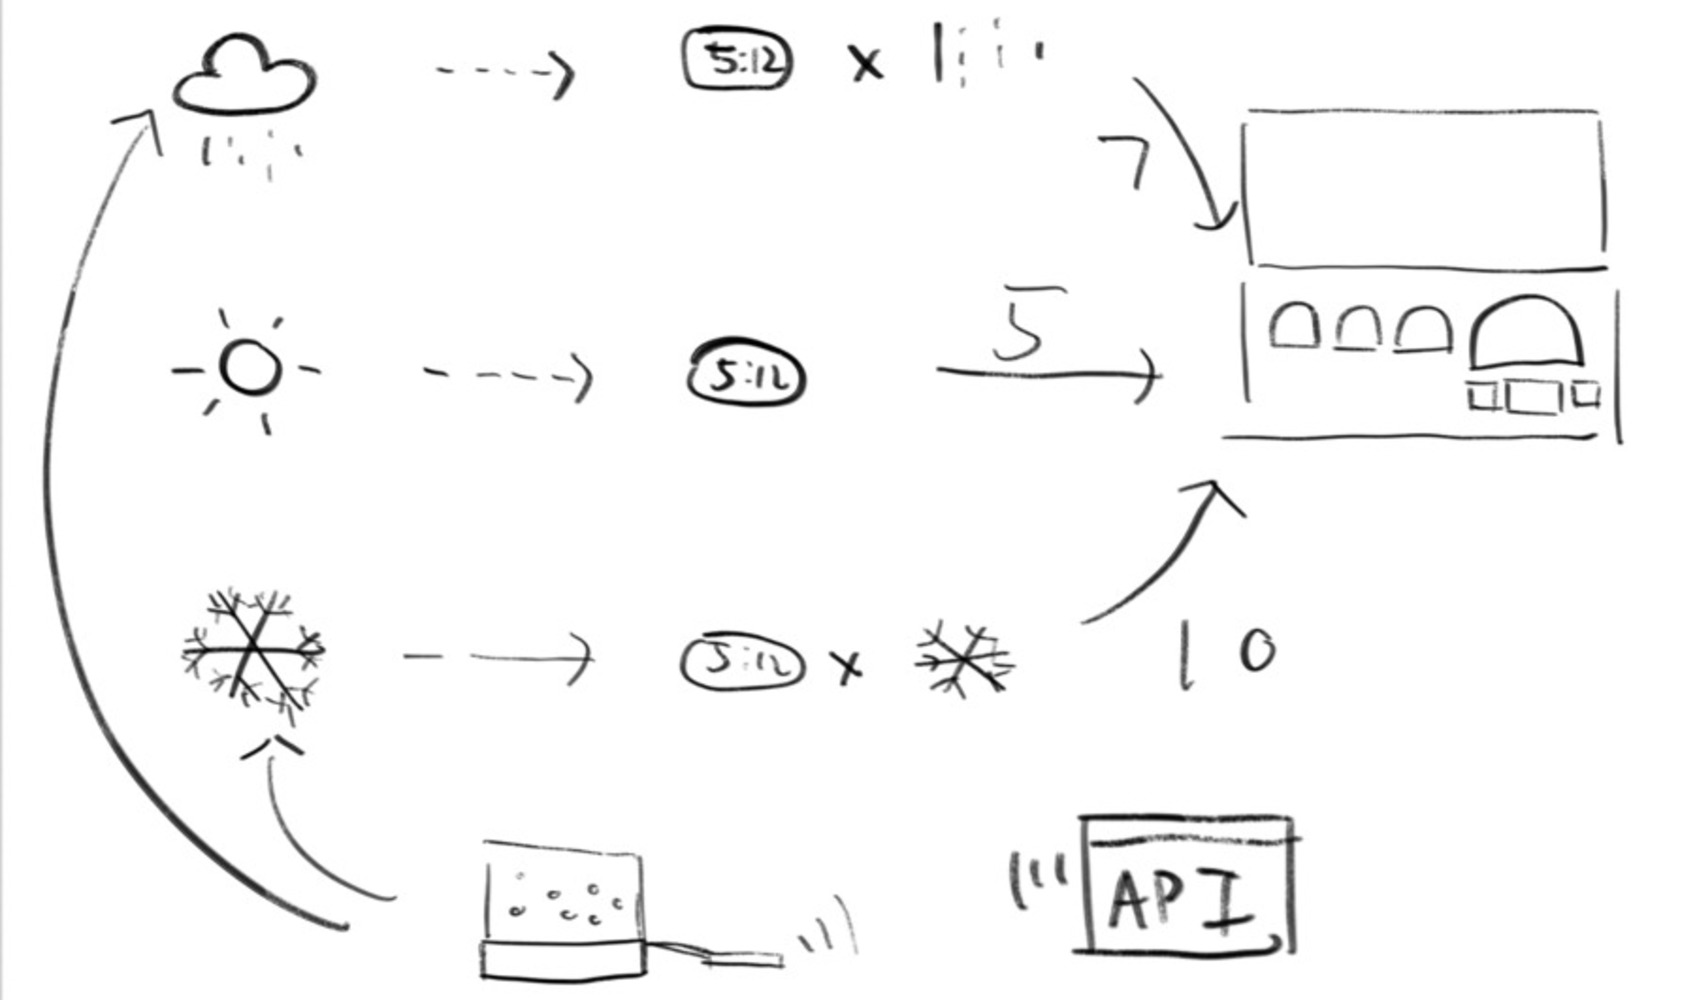
Daragh: a possible alternative data source

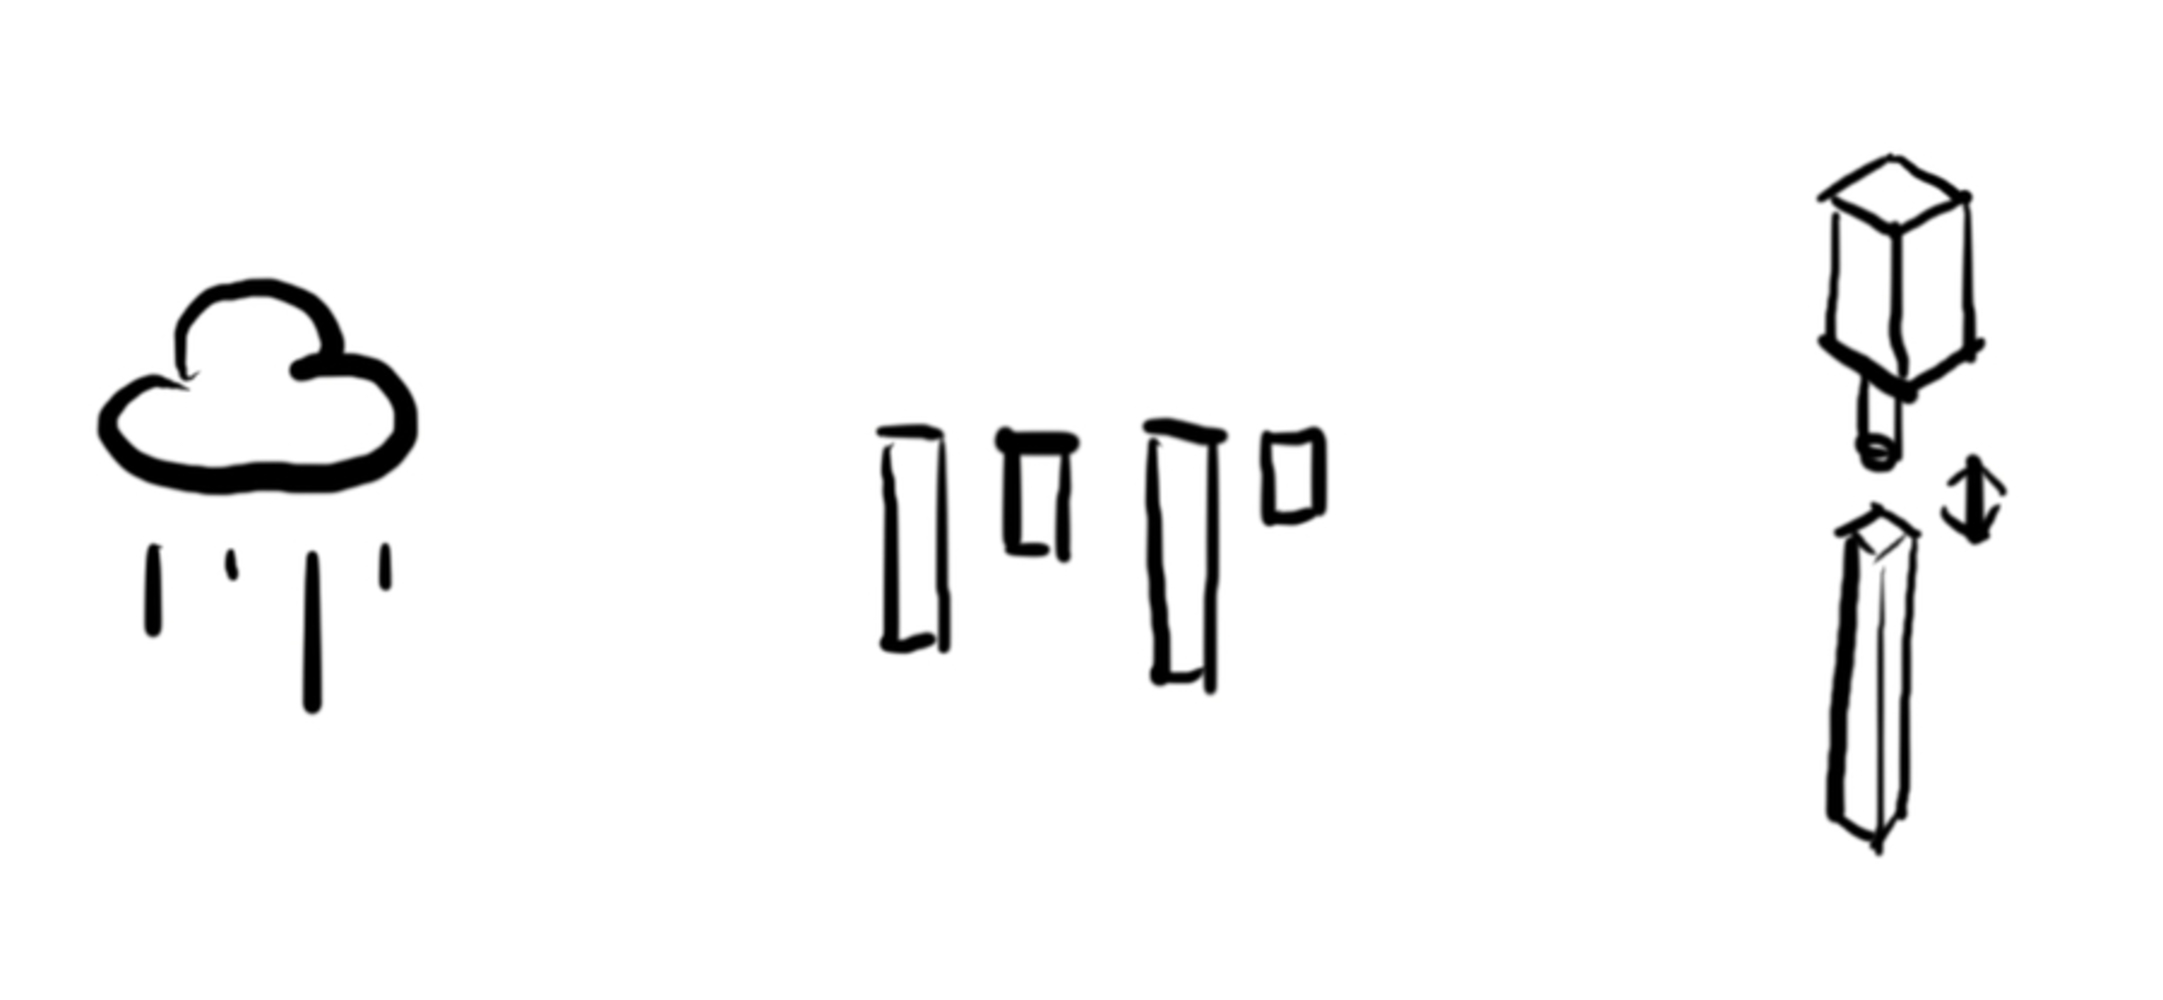
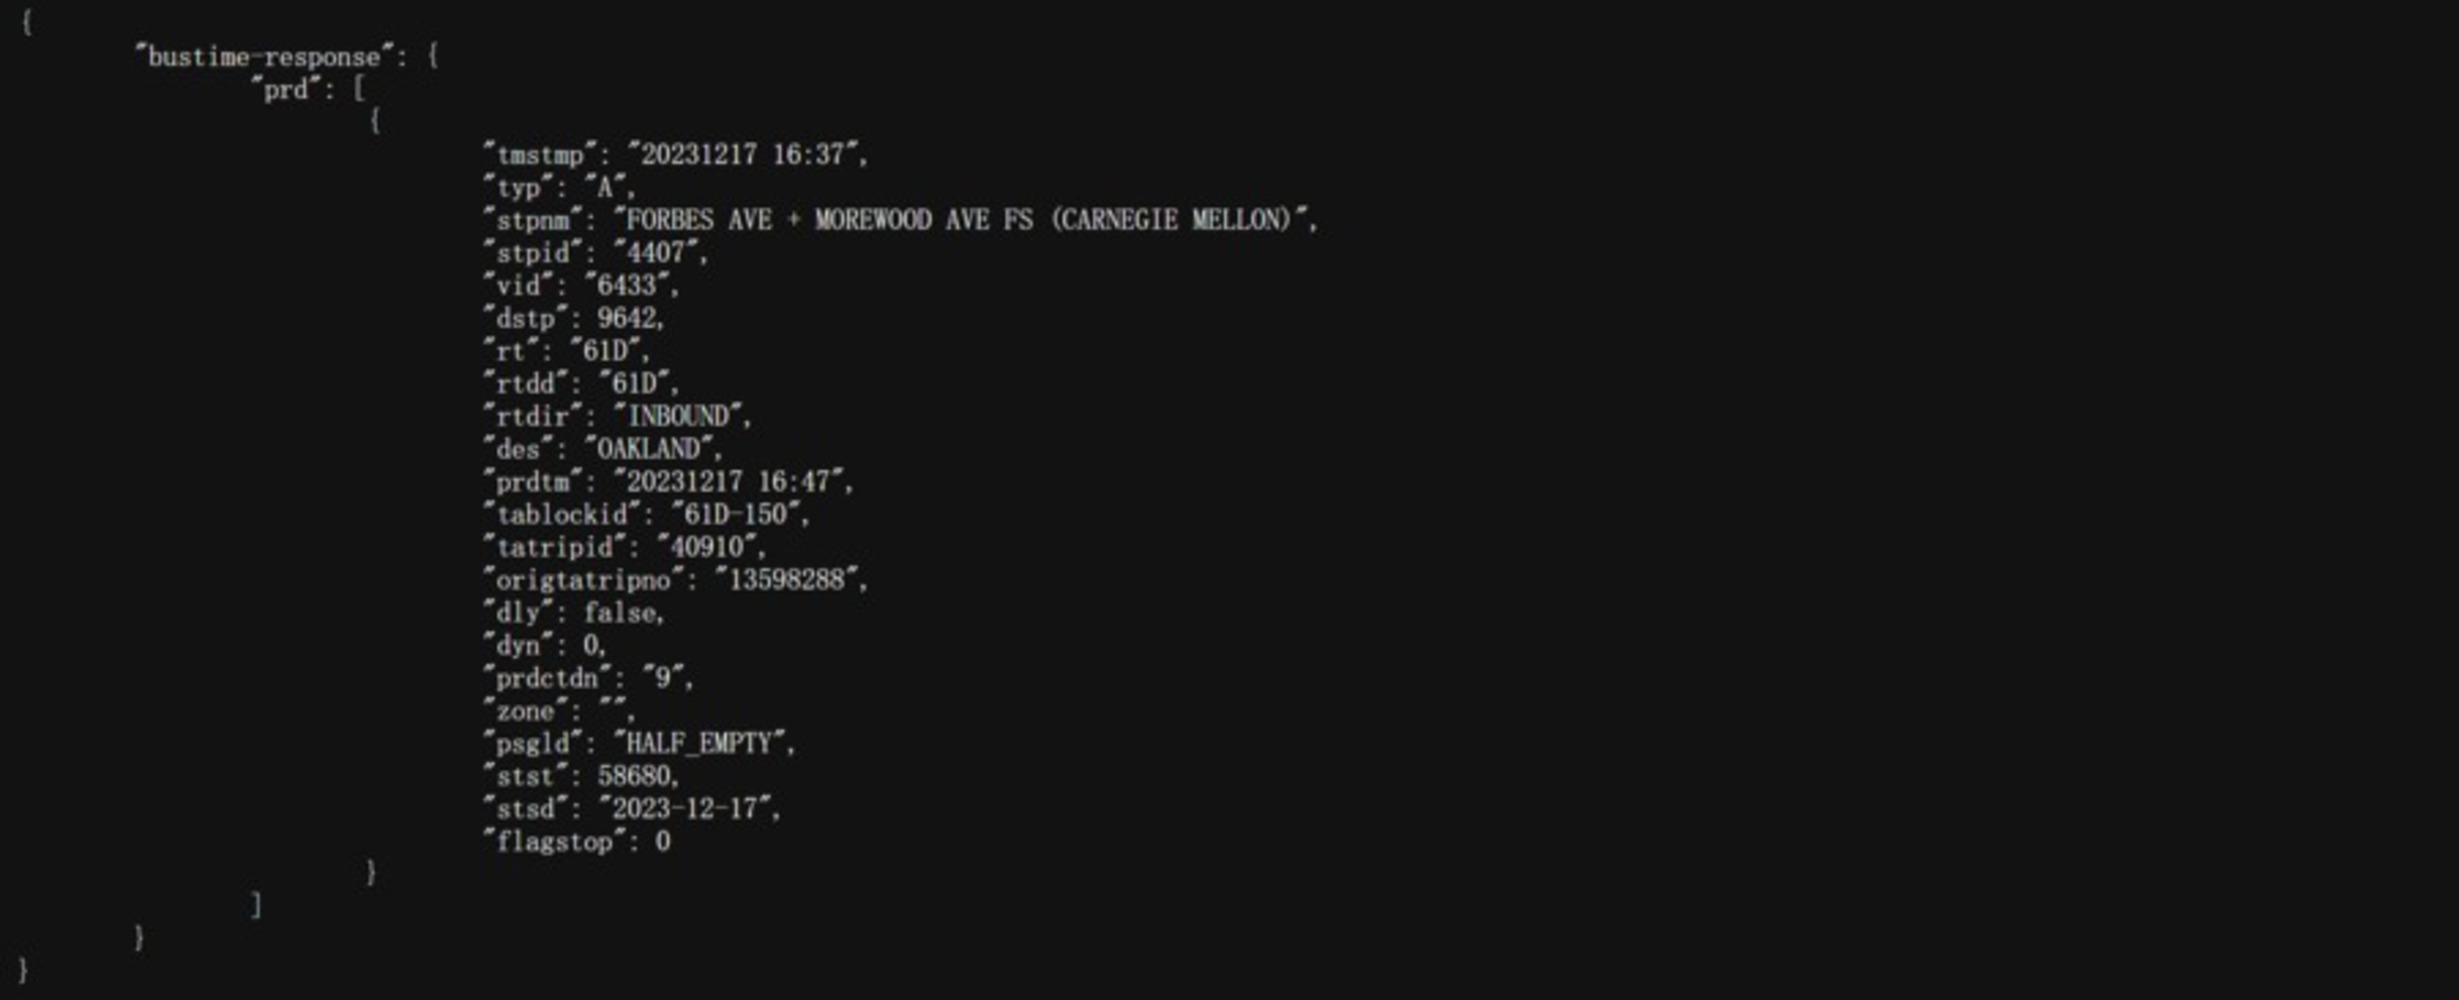
"Maybe use the regional annual snow fall data to get the depth of the expected range of depth. Or try to use status data that could avoid the problem of misunderstanding in terms representation."

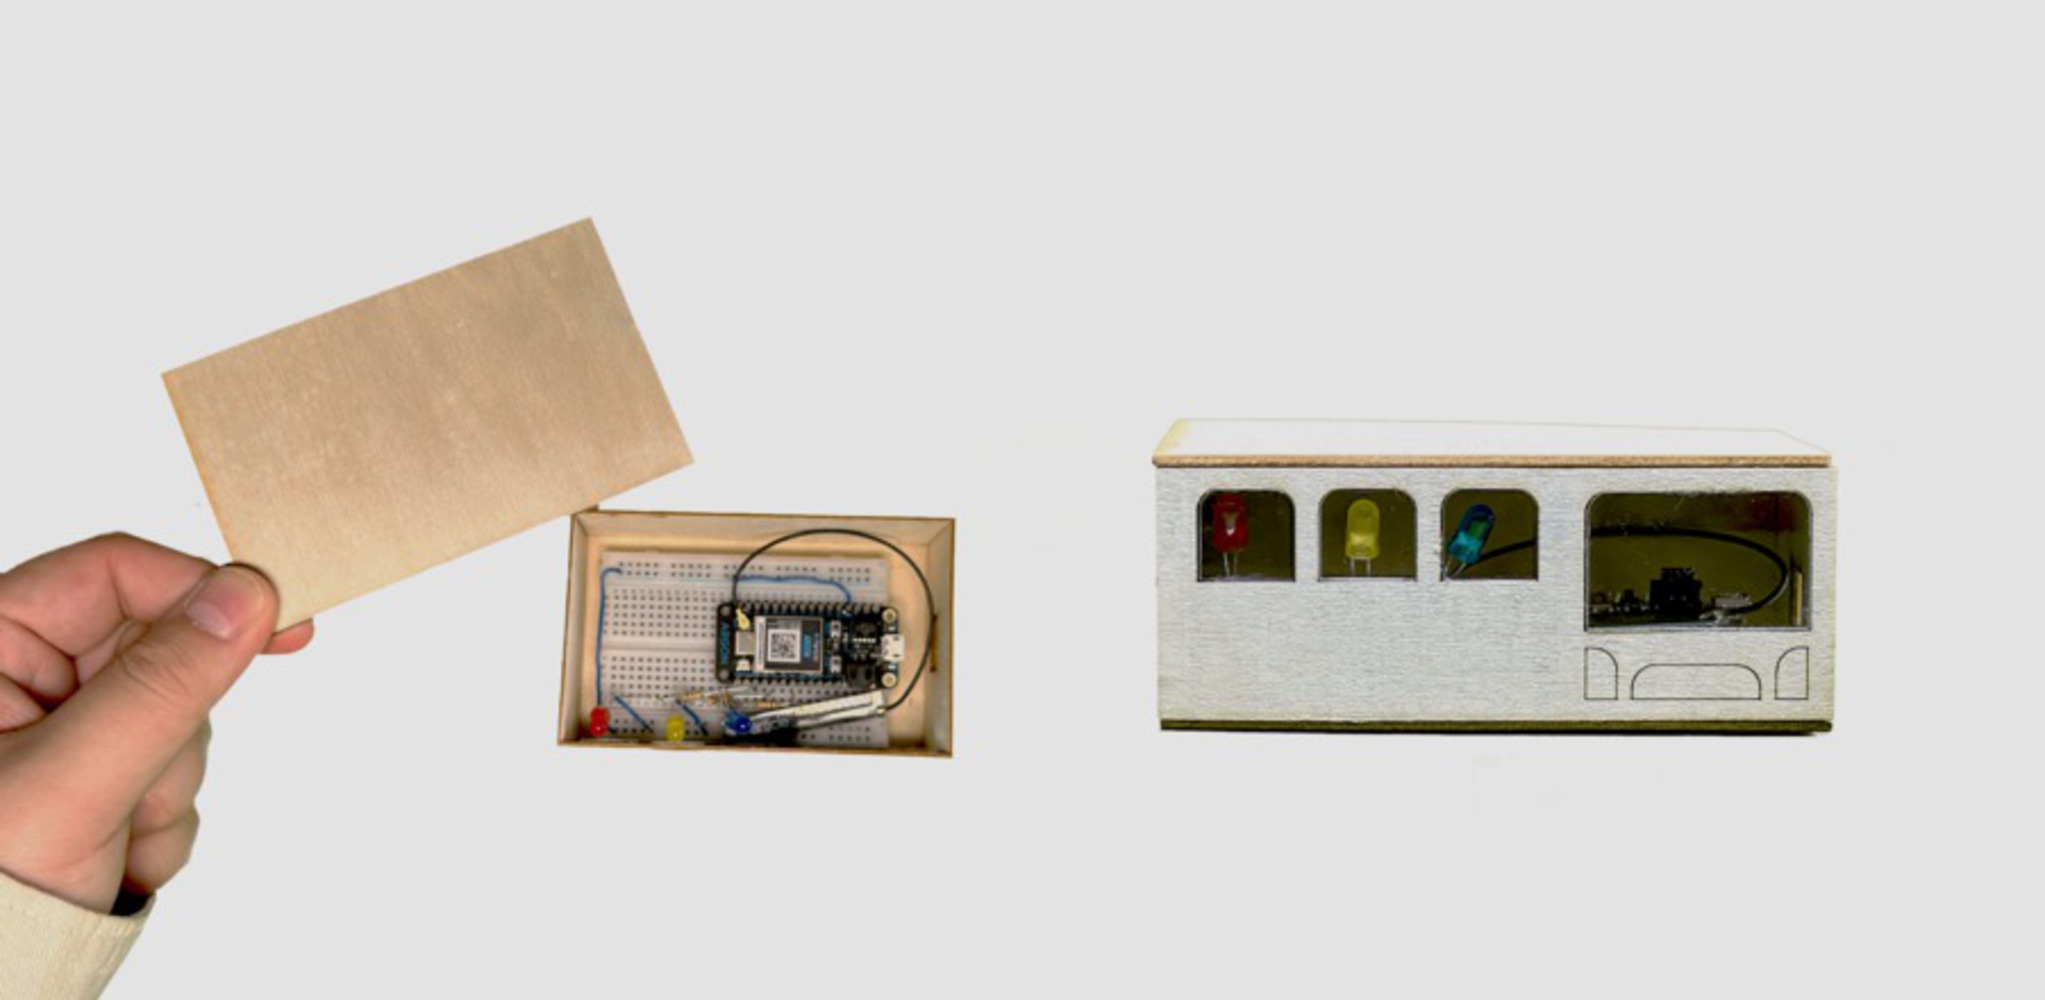
Dina: a misunderstanding in terms of representation, combination of the two devices

"Wow but this looks like a storm to me."

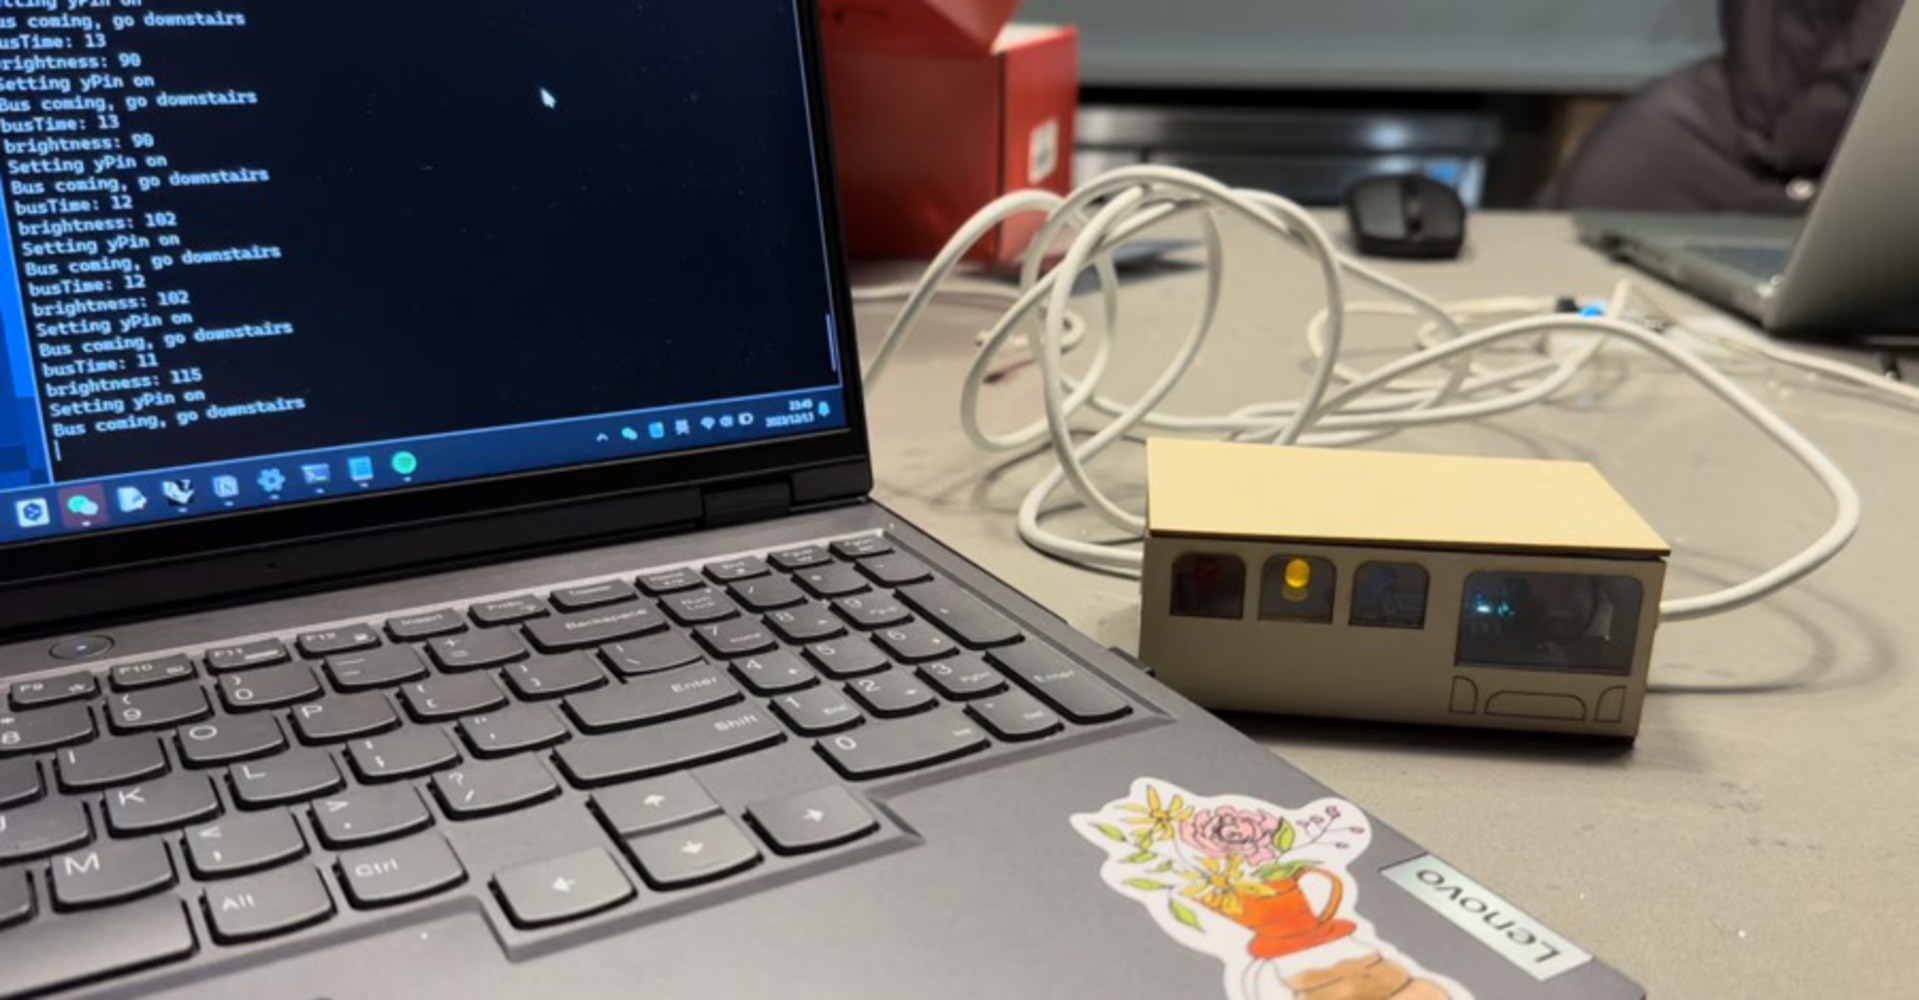
"Maybe this would also affect on the estimated time to get to the bus stop, you should hook up the two devices. They could also be combined into one with LED or Neo Pixel strip on the bottom part."

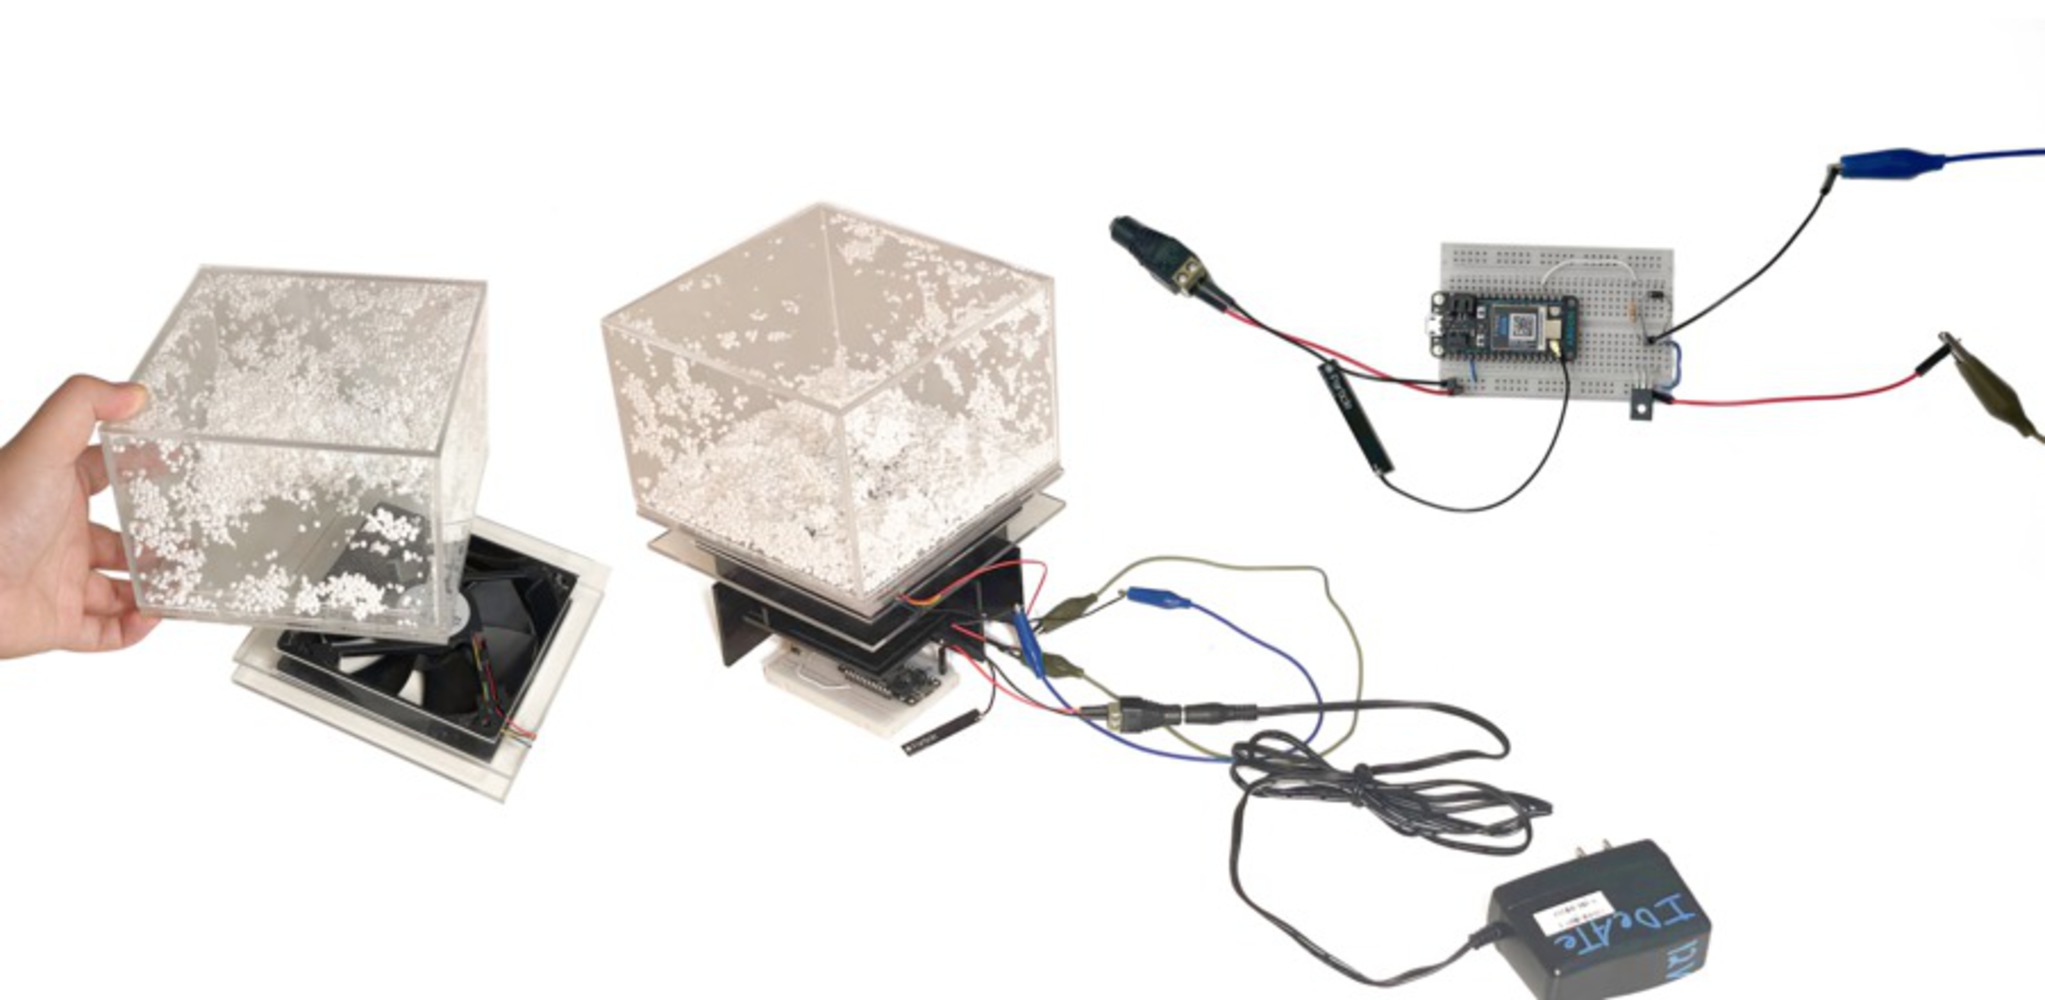
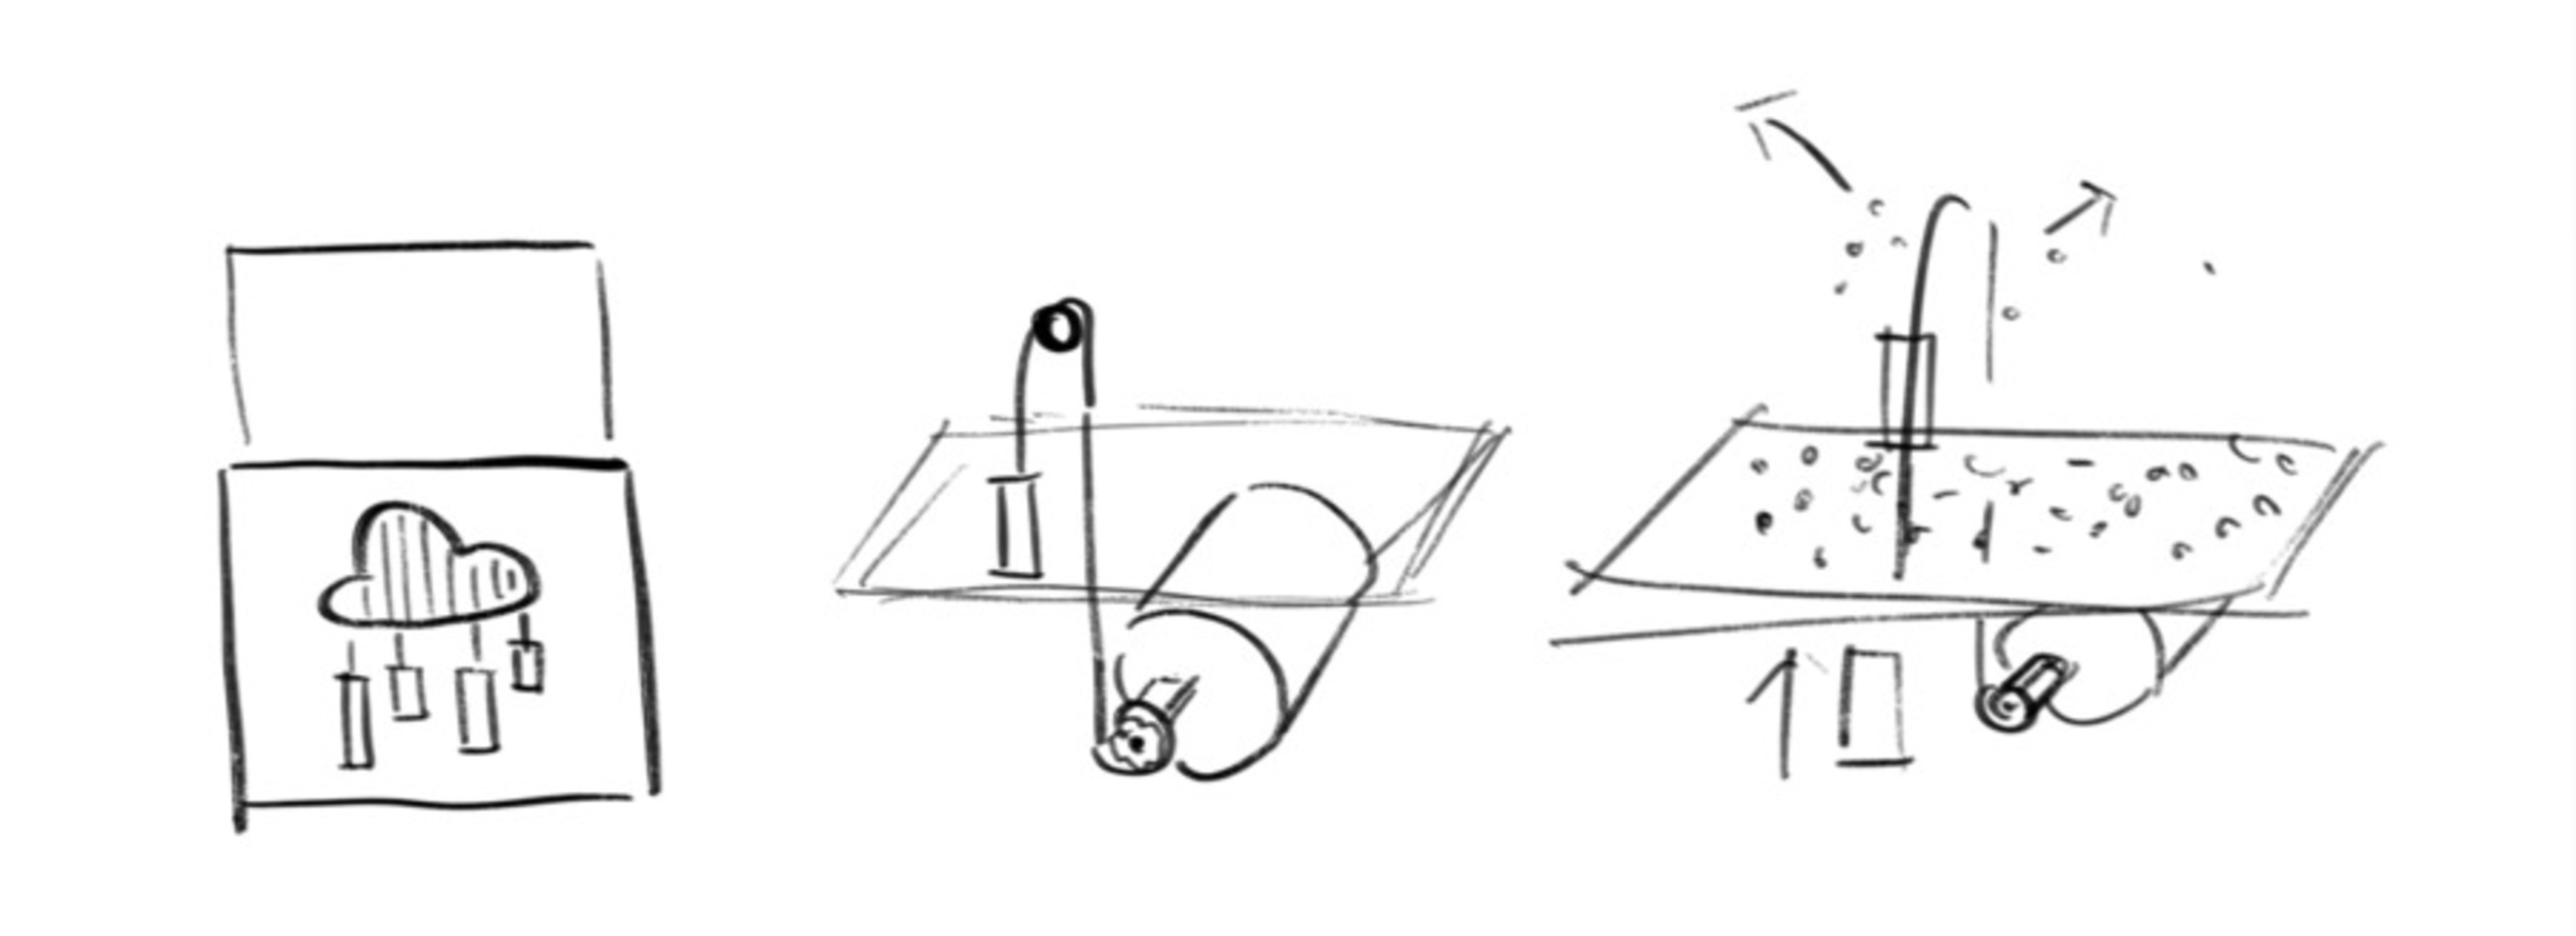
Zach: a possible alternative selection of fan

"Well I guess these brushless fans are built with the plastic frame like this (that block the air in the center of it). Maybe another type of fan, like a squirrel cage blower would avoid this problem."

Zhenfang: a possible alternative solution for the fan

"Maybe you could try with multiple smaller fans to point at different angles."


Acknowledgements:

Thanks for Prof. Daragh's guide and tutorial on how to access and use the Prt API and the amazing DIOT lab website. Also thank you Zach for the wonderful resources in the Physical Computing Lab.

Shout out to Daniel, Dina, Zach and Zhenfang for your precious suggestions and opinions. Your critique has been a great asset to the project.

Drop files here or click to select

You can upload files of up to 20MB using this form.