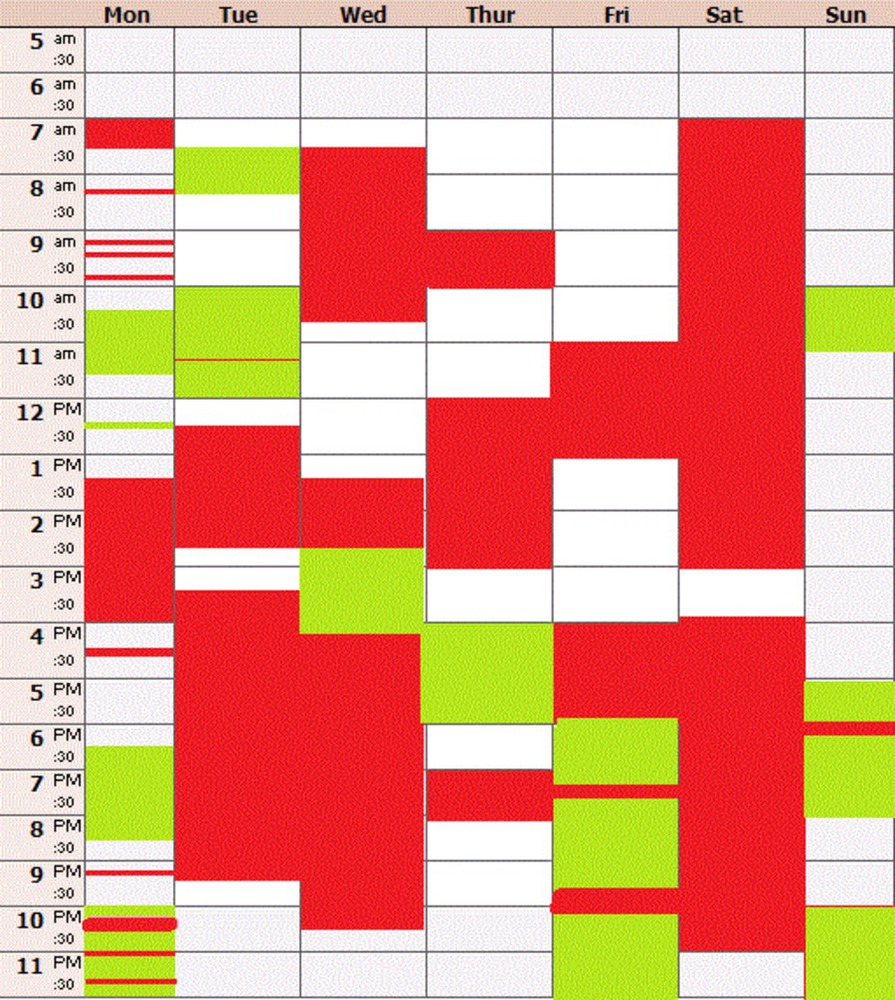
I have a tendency to live in my phone and in my computer. I check these devices throughout the day--to a worrisome extent—and it has become second nature for me to do so. My intent in this project is to display how often I am engaging with technology, hopefully so that I will be motivated to spend more time away from my devices. In order to do this, I would need to use a monitor on my computer and on my phone that would keep track of which websites I visit. This program would then, based on a list of pre-approved sites, categorize my time as having been spent productively or non-productively.
The actual display for the project would involve a simple app on the computer. It would look like a schedule but instead specifying certain activities, it would instead have red or green blocks to represent my technology usage. A block would be green if the website I visit in that time period assists my productivity—Blackboard, for instance. Other websites would be flagged as inherently unproductive (I.e. Facebook, Youtube, etc.) and would be shown as red. However, if I were on Youtube to watch a video for class, I could indicate this later by changing the color from red to green on the display.
This idea is similar to several other projects that were discussed in this class. It is not unlike Frick’s “Data Art” project in that it takes aspects of the creator’s life and displays it in an easily comprehensible format. I would not be showing my technology usage in the tangible realm like Frick does, but the idea of self-evaluation is more or less the same. Similarly, the “Wattenberg and Viegas” lecture relates to my project in that their analysis of Wikipedia has the same intent as my analysis. In their examination of how people change content on Wikipedia, they used a display that lends itself to showing changes over time, as does mine. The Wind Map, on the other hand, does not show a cumulative history of the wind patterns, but it does display new content on a daily basis, like my project. My assignment also has the capability of looking like The Napoleon map, but that map differs from my work because it actually displays a high number of variables. I, though I could use a similar number of different characteristics, am choosing to use a significantly smaller number of dimensions, thus lessening the complexity of the assignment.
Tufte, in his work “Graphical Excellence,” states that graphically excellent displays should essentially show the data without guiding the viewer to think about tangential aspects of the project (i.e. the graphic design, methodology, etc.). Hopefully my work reflects this viewpoint, as it is not complex enough to make the viewer inquire about the technical aspect behind it, and not simple enough to lack a purpose. My data is not easily distorted, which is another one of Tufte’s requirements for a good graphical display. That being said, it does embody art’s forceful point of view in that it is geared toward achieving a certain outcome rather than letting the viewer develop whatever opinion they want. I want to use technology less, and this project is helping me with that by forcing me to notice my patterns.
When initially creating this project, I wanted to make myself believe that all technology usage is bad, and thus make all of the blocks in which I’m using technology red. This is simply a bad idea, as not all usage of devices is bad usage. Yes, the fact that it is almost second nature to check my phone during class is something that I want to change (because I consider it to be rude), and negative association in this project could help with that. However, if I’m working on an assignment on my laptop, I’d rather not have that be associated with red actions. My group mates helped me discover this flaw, and I changed my project accordingly. Hopefully, in engaging with this project for a prolonged period of time, the amount of time that I spend using technology would lessen.