Outcome
I use many of the facilities on campus myself regularly, and have faced difficulties with either overcrowding or having too little people to play pickup games with. Therefore, I believe that it would be useful for people who want to participate in these sports to be able to have access to information about how many people are using those facilities currently, or are estimated to be using them at different times and dates in the future.
The type of data that would need to be collected would be the number of people who are using the facilities for recreational purposes. We would need a way to collect real-time data of people currently in the facilities, as well as use past data to roughly estimate the number of people that would be using the facilities at any time on any day in the future. The accuracy of this estimate would be greater as more data is collected over time.
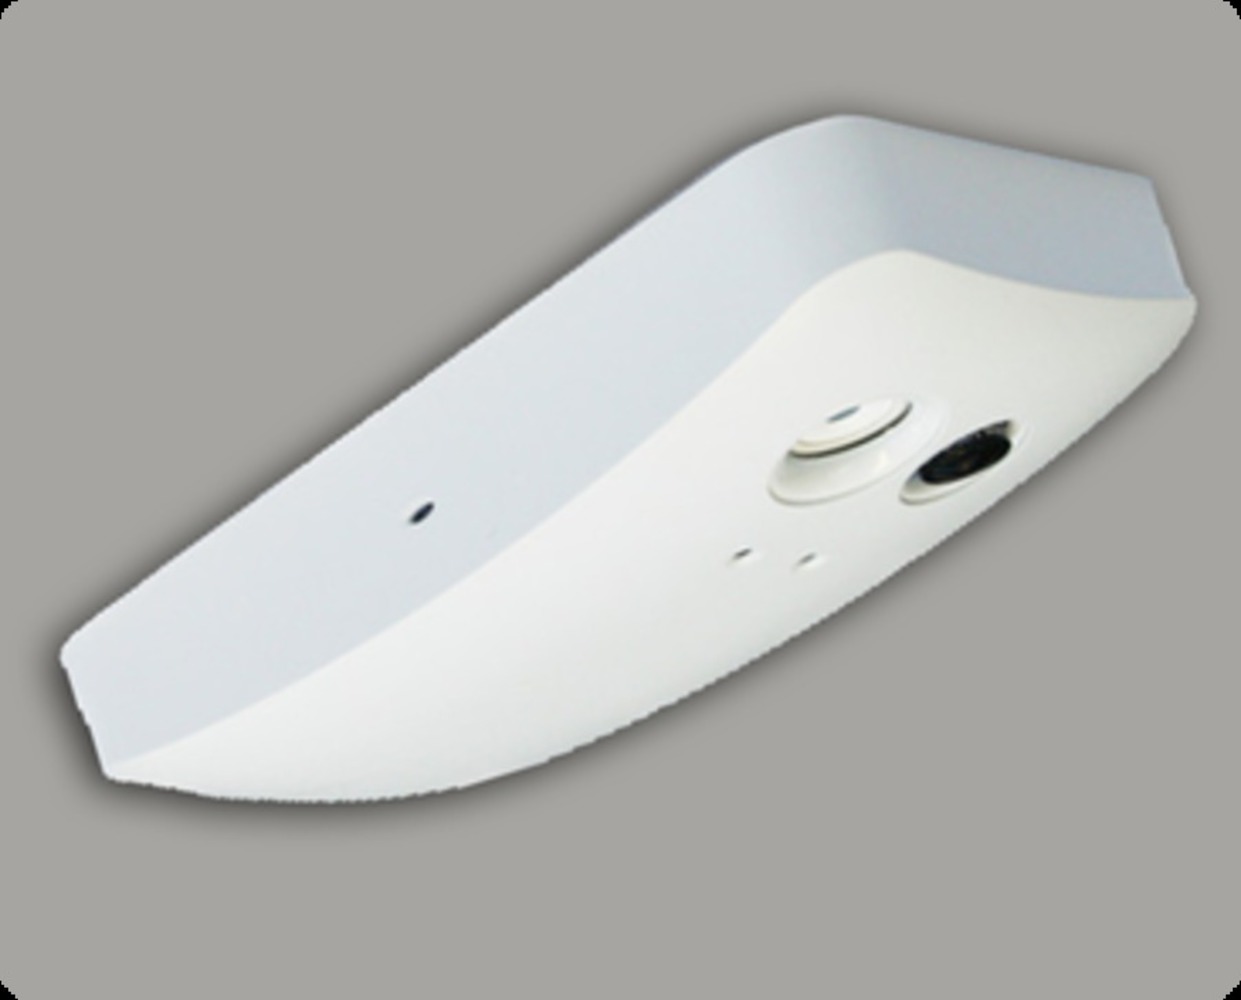
Most likely, we would have to use people counter devices to obtain the data in real-time. There are devices that can attached to the entrance ways of the basketball, squash and tennis courts, as well as the gyms. An example of such a device is below. It is a thermal imaging device counter, sold on the market that can be placed overhead on the entrance, and it keeps track of all people passing below it. By keeping track of people entering and leaving the facilities, we can obtain the current occupancy of the above facilities. This method would be low-cost, efficient and unobtrusive to users of the facilities.
However, for the soccer and football fields, we would need a different method of collecting data about occupancy. This is because there is no specific entrance to either field. In both cases, it would make more sense to set up a video camera for each field that overlooks the entire field. It would then be possible to set up a motion detection program with the video camera that captures all motion on the camera and returns an approximate count of all moving objects on the field. This method would cost more, as we would have to pay a tech company that specializes in people counting using video cameras (like VideoTurnstile), to install and operate the cameras and programs for us. However, it is the most accurate method and would still be cheaper than employing dozens of device counters like those mentioned previously to monitor the entire perimeter of the fields.
Another piece of information that we would need to obtain is the date and time of any special events that are going to be held in the various sports facilities. For example, we have various dinners, talks and employment fairs held in the UC basketball courts a couple of times a month. We also have to take into account the times and days on which the varsity teams practice on the facilities and have games. In addition, the gym facilities sometimes are also reserved. On these days, since the facilities are not allowed to be used by the public and for recreational usage, we would need a way to visualize this in our data as well.
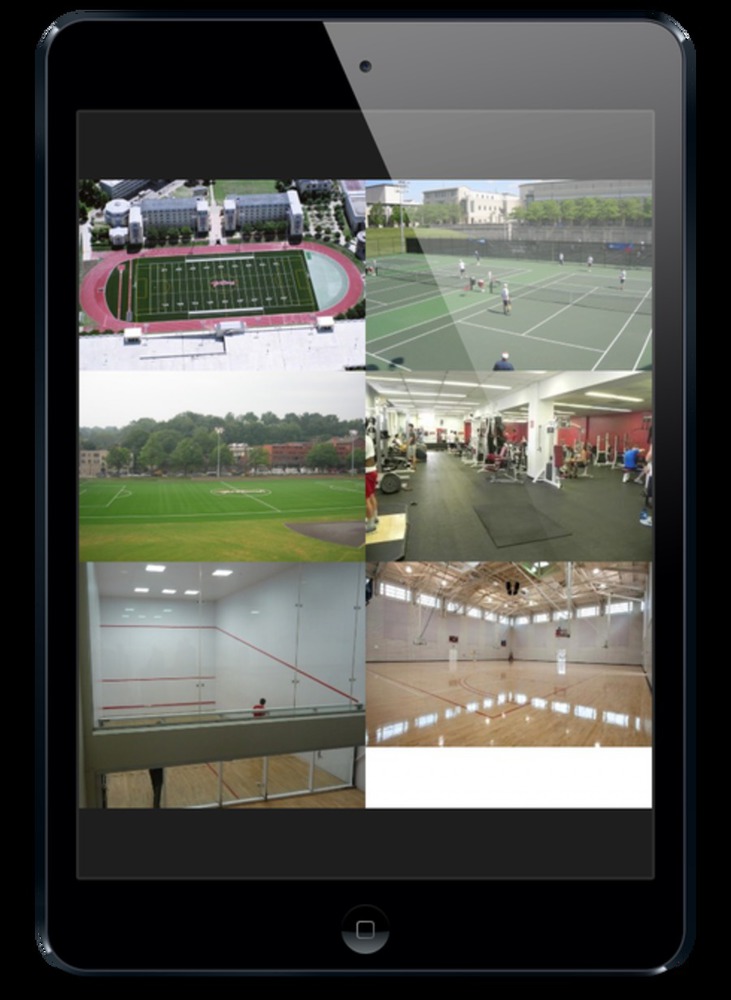
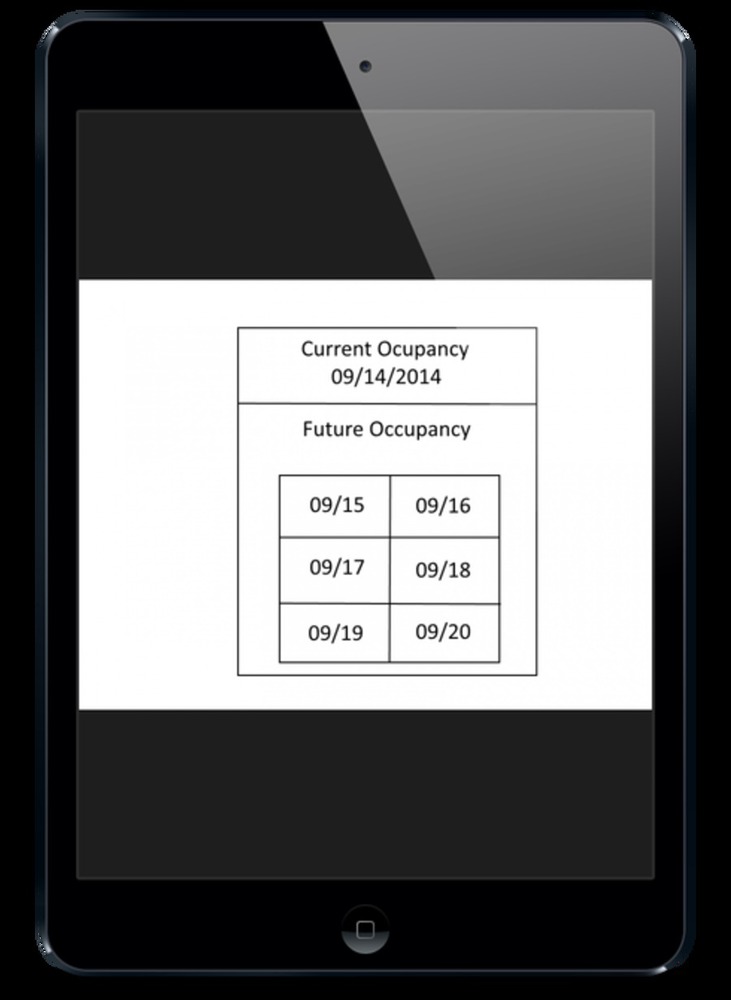
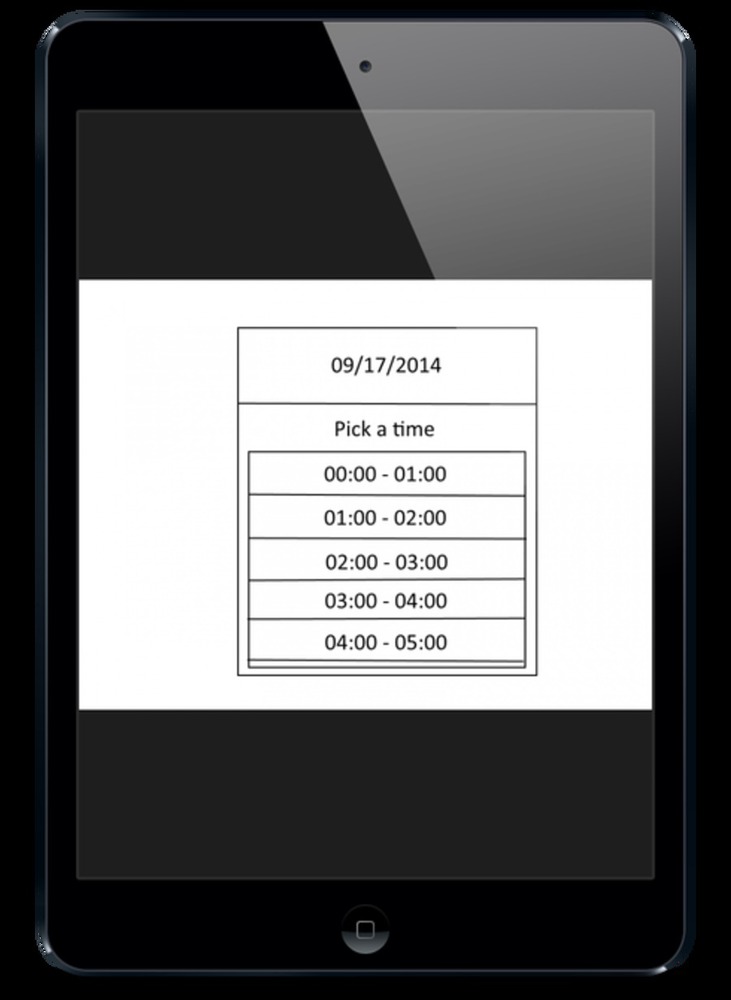
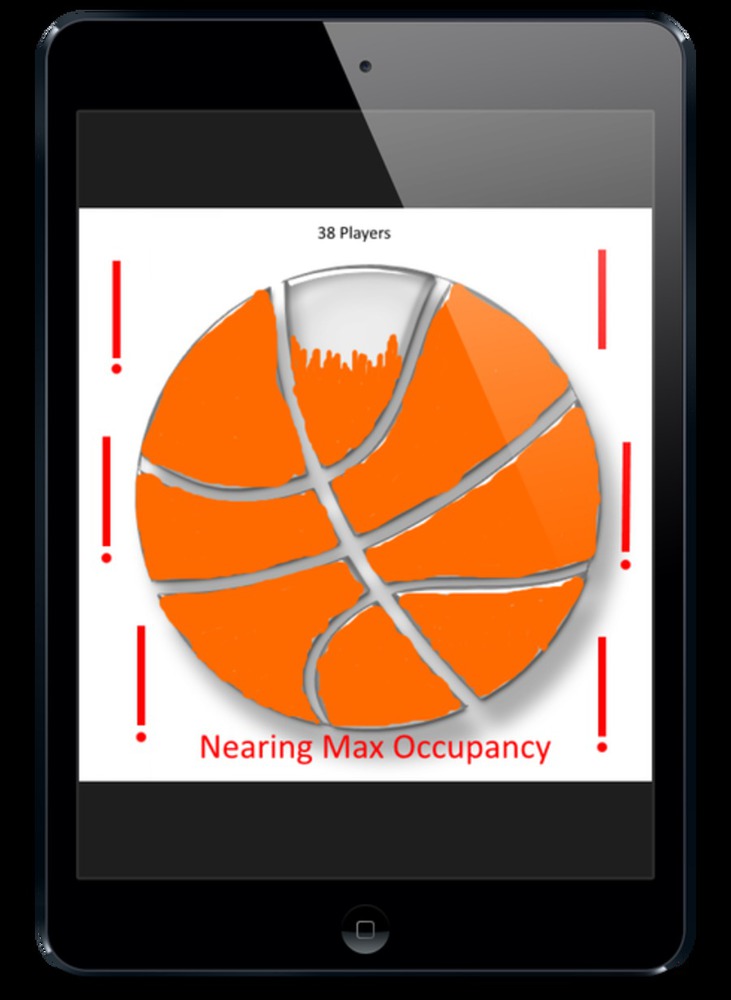
I’m planning to have the final form of the data visualization available on an app for download. This app allows you to first choose the facility you want information for, and then displays the data of occupancy for that facility. You then pick the date you want to see. You then get to pick the a time period for that date, which are in 1-hour periods. Once you have picked both a date and time, you will get to the representation of the data, which is showcased below.
The above 5 icons show an example of how the data will be represented. For each of the sport facilities, I am going to use an icon that is representative of that facility. The first and second icons from the left show how the transparent basketball slowly fills up as the number of plays in the court increases. I would also show the actual number above the icon, for those who want or need an actual number. However, I believe that when it comes to showing people density, having a form of representation that makes it easier to visualize the difference between different numbers of people is more intuitive for the average user. It can be harder for a person to grasp their mind around numbers. How full would the soccer field be if we just said there were 20 people on it. Is that a lot or little?
The middle icon and second from right, are shown when there are too little people or too many people in the facilities. The exclamation points start blinking in and out, to instill a sense of caution in the user. This helps to specifically highlight the cases that most people want to avoid - having too many or too little people there.
The final icon from the left is the icon that will be displayed when the facility is not open for recreational usage at a specific time on a specific date. We will also have icons for the the other facilities, as shown below. They all embody the physical activity performed in that facility. Also, they will have similar counterparts to the above icons for basketball, for when occupancy is too low or too high, and when the facility is closed for recreational use.
Design Choices
The idea of collecting occupancy data actually embodies the people participating in the sports themselves. The Dourish reading says that meaning arises in the course of actions and embodiment is about establishing meaning. In this case, the actions of people who use the facility leads to the idea of occupancy, which is embodied in our data. Eventually, the data will influence those very actions, which then influence the data again. This is clearly embodied interaction at work.
I chose to visualize the data by filling up a transparent icon with color, and the amount to which it is filled, represents the level of occupancy. I chose a sports icon as it seemed fitting to represent each sports facility with the tools used in those facilities. However, the reason why I decided to use such a different form of visualization to represent data which was basically just a number (the number of people using a facility), was because of a point made in the reading ‘Strangely Familiar: Design and Everyday Life’ - coming up with a unique design to transform otherwise ordinary objects and spaces, thus drawing our attention to the everyday conditions. Having just a number would not be eye-catching, whereas a colorful icon that continuously changes as the conditions change has visual appeal. I also decided to color the icons with the right colors for the objects, in order to embody the sport more.
I got the idea of filling up a transparent icon with color from the reading on ‘Graphical Excellence, page 16’. That page displays a sphere, containing millions of particles of data points. There is a difference is that the data represented there is clusters of galaxies, making it more geographical in nature, while my data is about the number of people in the same area.
For a simple number, using a table to show this number at different time periods might make more sense, but rather than showing just the number, what I really wanted users to be able to do was compare those numbers effectively. I needed to show the relative difference in those numbers at different times and allow users to be able to easily grasp this difference. In the ‘Graphical Excellence’ reading, William Playfair, the Scottish political economist, also said that graphics better allowed us to show the shape of the data in a comparative fashion as compared to a table. That is why I favored the use of graphics, as it made it visually easier to compare the difference in occupancy between different times. The reason why comparing the difference is so important is because it allows each user to be able to judge for themselves whether a certain occupancy level is acceptable for them or not.
However, I separated the dimension of date and time from the level of occupancy. This was because of the form of visualization I chose for the level of occupancy; it made it such that its effectiveness lies in the fact that it is one dimensional.
Also, I added jagged edges to the top of the filled up area instead of a straight line as it is similar to how musical sound waves are visualized in media players. It represents energy and activeness, two things that are vital in any sport. Furthermore, the jagged edges instantly draw attention to the end point of where the color ends, which is the actual substance of the data, that represents the relative occupancy level. I also used blinking exclamation points as it instills a sense of caution in users - It makes them reconsider whether they should use the facility at that time or not. Once again, I try to draw the user’s attention to the most important point of data at those conditions. This connects to the point about how the visualization should not draw away from the actual substance but allude to it.Thus, my data visualization emobides a forceful point of view in the various way it uses visuals as a medium for communicating the data to the users.
Some of the changes I made to my design after getting feedback from my group was to add the actual number as well to the data. Initially, I only wanted to have the icon being filled up, but I decided that having the actual number would complement the icon, rather than hinder its purpose. I also added in the flashing red exclamation points to show when there are too many or too little players, as suggested. This make it easier to highlight the main problem scenarios. Finally, I was only planning to use past usage data of the facilities to estimate the occupancy at any given time, but my group members suggested that I should have real-time data, which seemed really appropriate, so I went with that decision.
You can upload files of up to 20MB using this form.