The Design
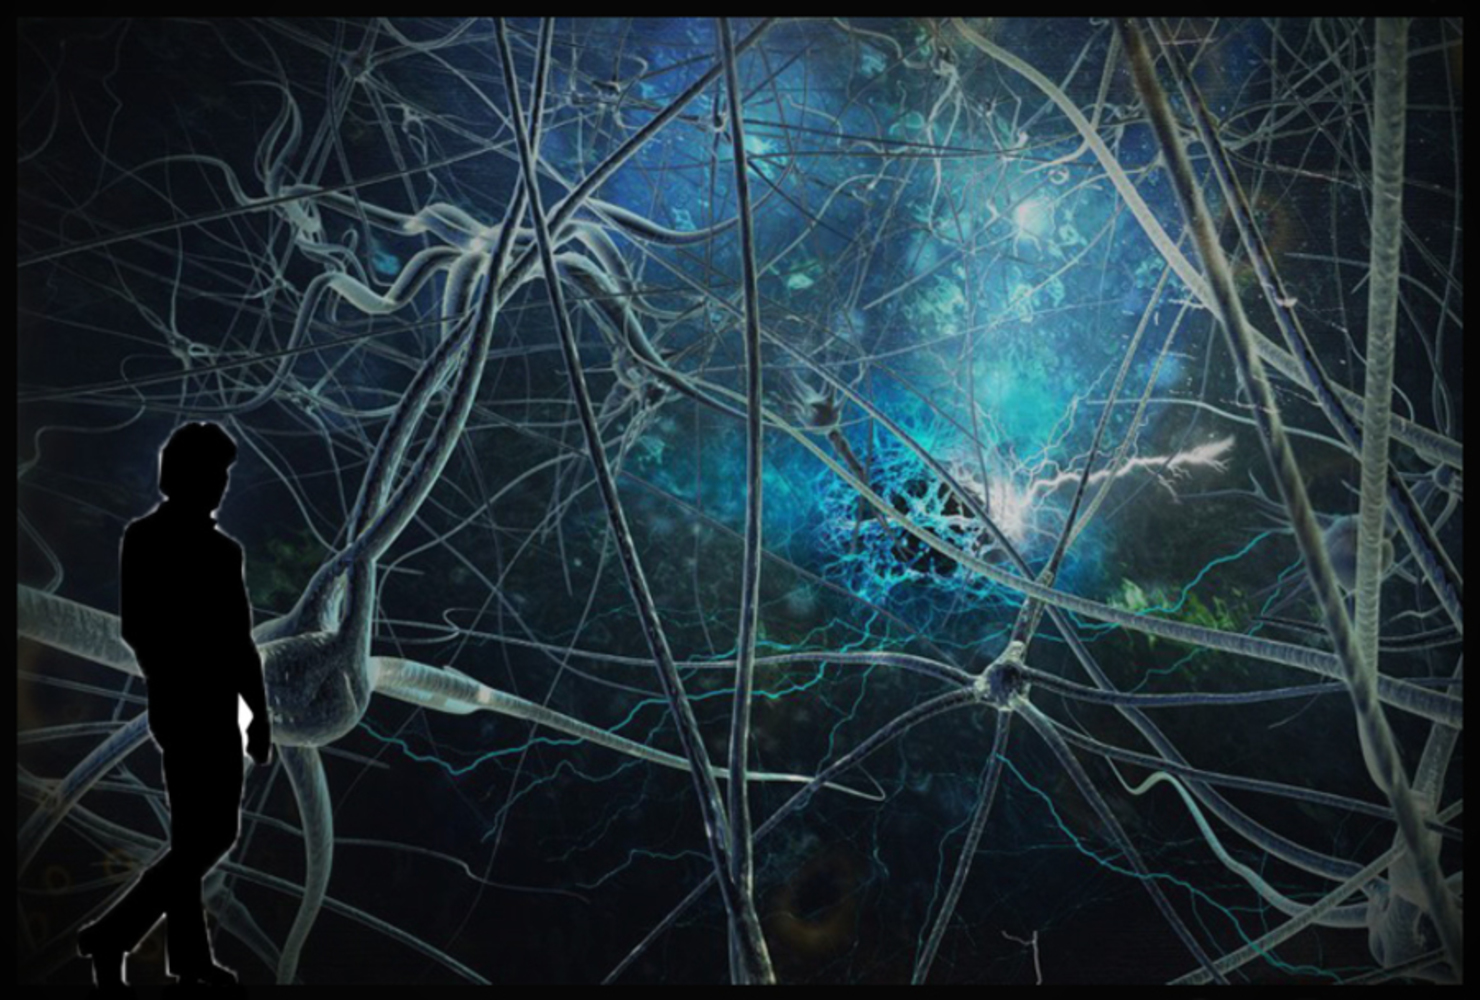
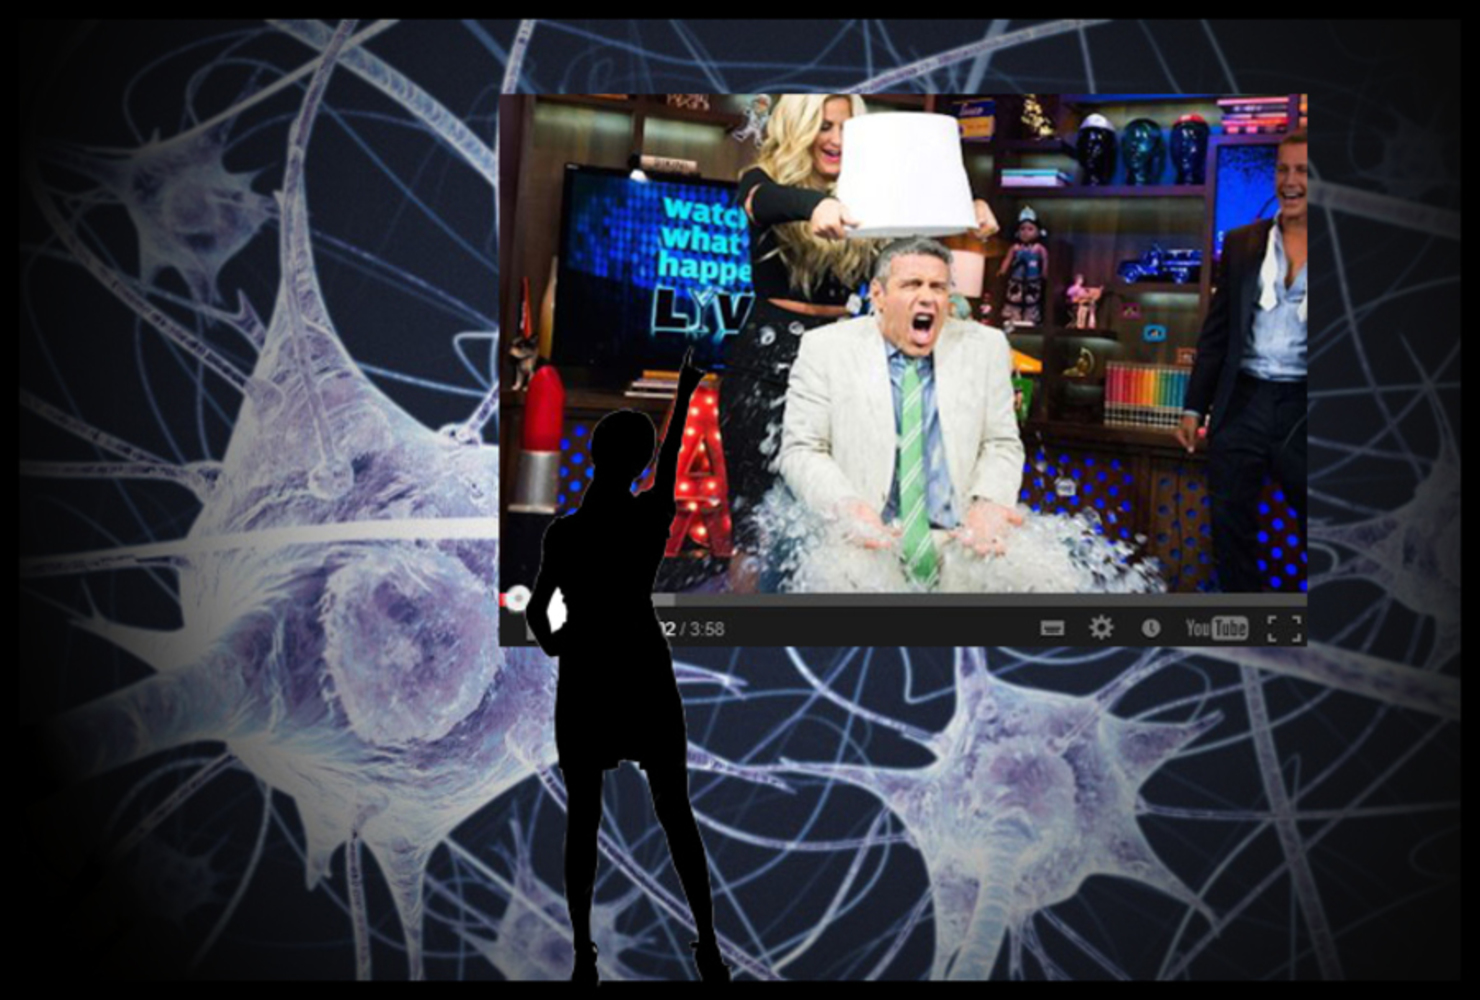
My main source of data will be videos posted on Facebook, and I could theoretically collect this data by searching for posts relating to the ice bucket challenge. In my display, neurons represent people who have done the ice bucket challenge, and axons and dendrites represent who nominated who. I would like to create an embodied, interactive screen where you can zoom in and out. I would use the idea of perspective to make the piece seem three dimensional, and to effectively use space to convey my message. When you select a neuron, this individual’s video pops up. I included this feature because I want the user to see how each individual contributed to the bigger picture. I would also like to incorporate a way for the number of neurons to grow in real time every time another ice bucket challenge video is posted. That way, this project can symbolically represent neurons regenerating and interacting with each other as the ice bucket challenge becomes more popular, which sends the message that we are combating Lou Gehrig’s disease.
The Technique
My project follows the principles of graphical excellence by incorporating both statistics and design in one piece of art, and communicating a message while adhering to the truth. It does this by representing the data in a way that highlights how many people have been affected by the ice bucket challenge, while keeping it easy to understand. In addition, my project presents this data in a time-saving and space-saving way, because users can grasp the message with just one glance. Because of this, my project passively compels the user to come to the conclusion that the ice bucket challenge successfully achieved its goal of spreading awareness for Lou Gehrig’s disease.
My group suggested that I think about what kinds of data I would be omitting. I think I would actually be omitting a lot of data (like popularity by age/gender, how much money was raised, etc.) in order to create a "forceful point of view". Omitting extraneous data helps direct the user toward the message of the piece, because I am solely addressing how this event spread awareness for the Lou Gehrig's disease and not any other aspects of it.
I would relate this to Fernanda Viegas and Martin Wattenberg's presentation about representing the spread of ideas using circular tree maps. I was inspired by their idea of representing social media relationships with data art, but I took that one step further to make a message about the ice bucket challenge's effectiveness.
(Note: the bold words highlight connections to the readings/videos.)