Back to Parent

Outcome


The Phenomenon

In the past few years, the way our society, especially the younger generation, consumes television has changed quite dramatically. In the past, people had to tune into their television at a certain time each week in order to watch a show and be able to keep up to date with it. There was no way to watch an old episode of a show unless you happened to catch a replay date. Since the introduction of DVR and streaming options such as Netflix and Hulu, accessibility of TV has increased tremendously. Nowadays, people are able to watch any move or any episode of any show whenever they want to the point where some binge-watch TV shows for days on end.

This begs the question: what can we gain from analyzing TV viewing trends? As consumers, we should have some concern for the way we are spending our time. Since we have such a great selection of content to watch, and we are now able to watch it whenever they want, there is no doubt that we are spending more and more time on our viewing devices than ever in the past. The visual representation explained in this presentation aims to convey these viewing trends so that the public is more aware of the amount of time they spend in front of a screen. I hope it encourages people to moderate their TV watching time more efficiently and discourage unhealthy viewing habits.
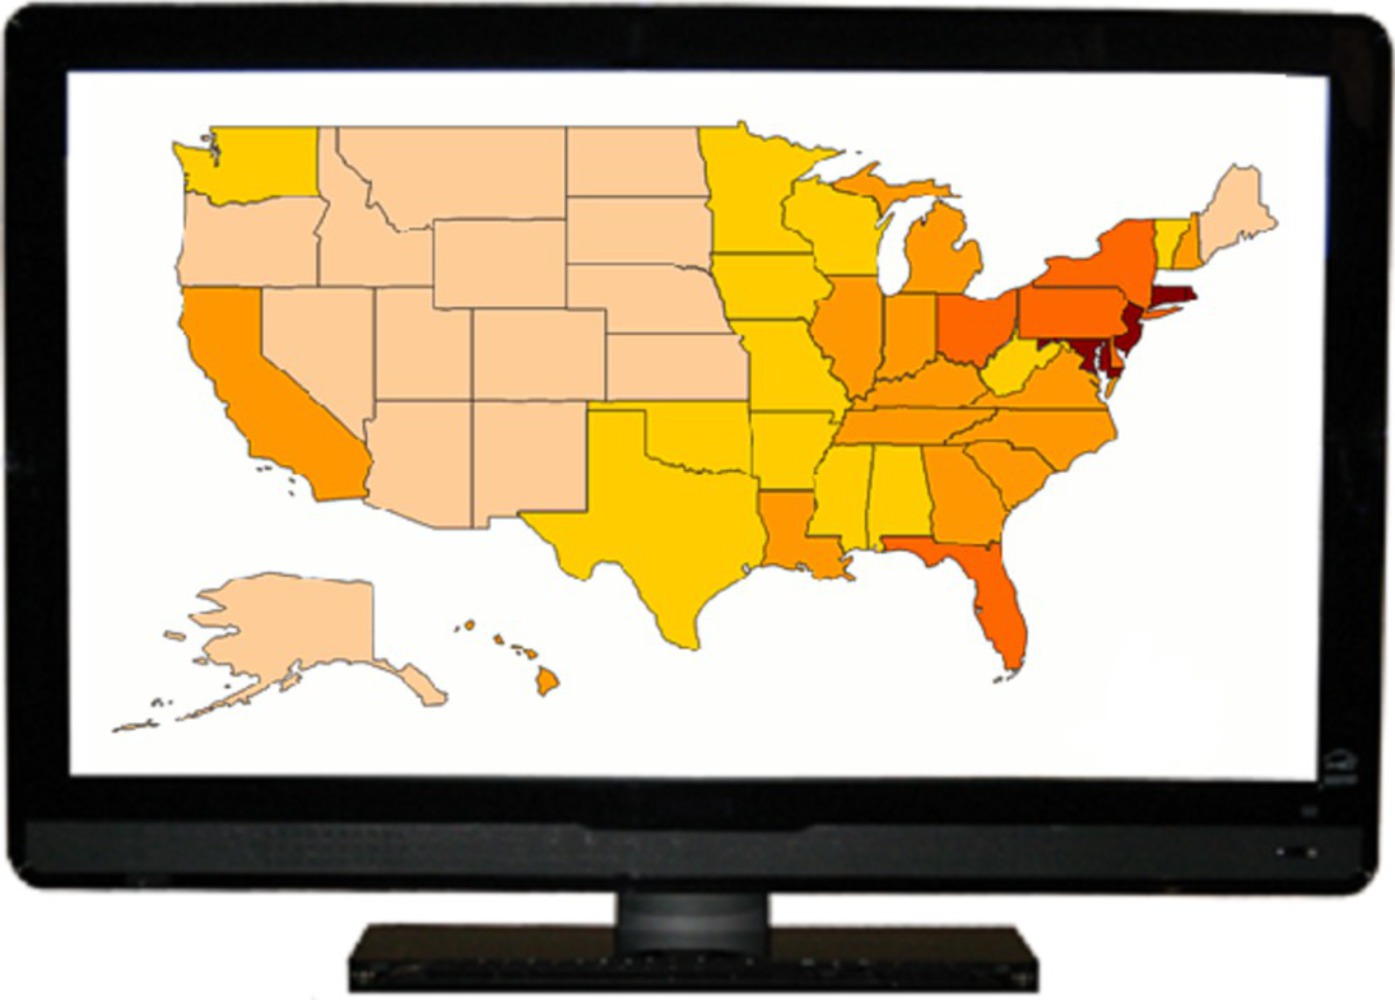
Map.thumb
Show Advanced Options


The opening screen gives you an idea of the viewing trends of the nation as a whole. It is embodied in that when people are dealing with data representation, and see a map, they understand that they may select different regions to view more specific data. Additionally, the color differentiation is used to compare the amount of TV that different states watch. Note: the darkness in color of the states is based on the average time spent watching TV per person. This should eliminate any concern of the more populous states appearing darker simply because of their population. 


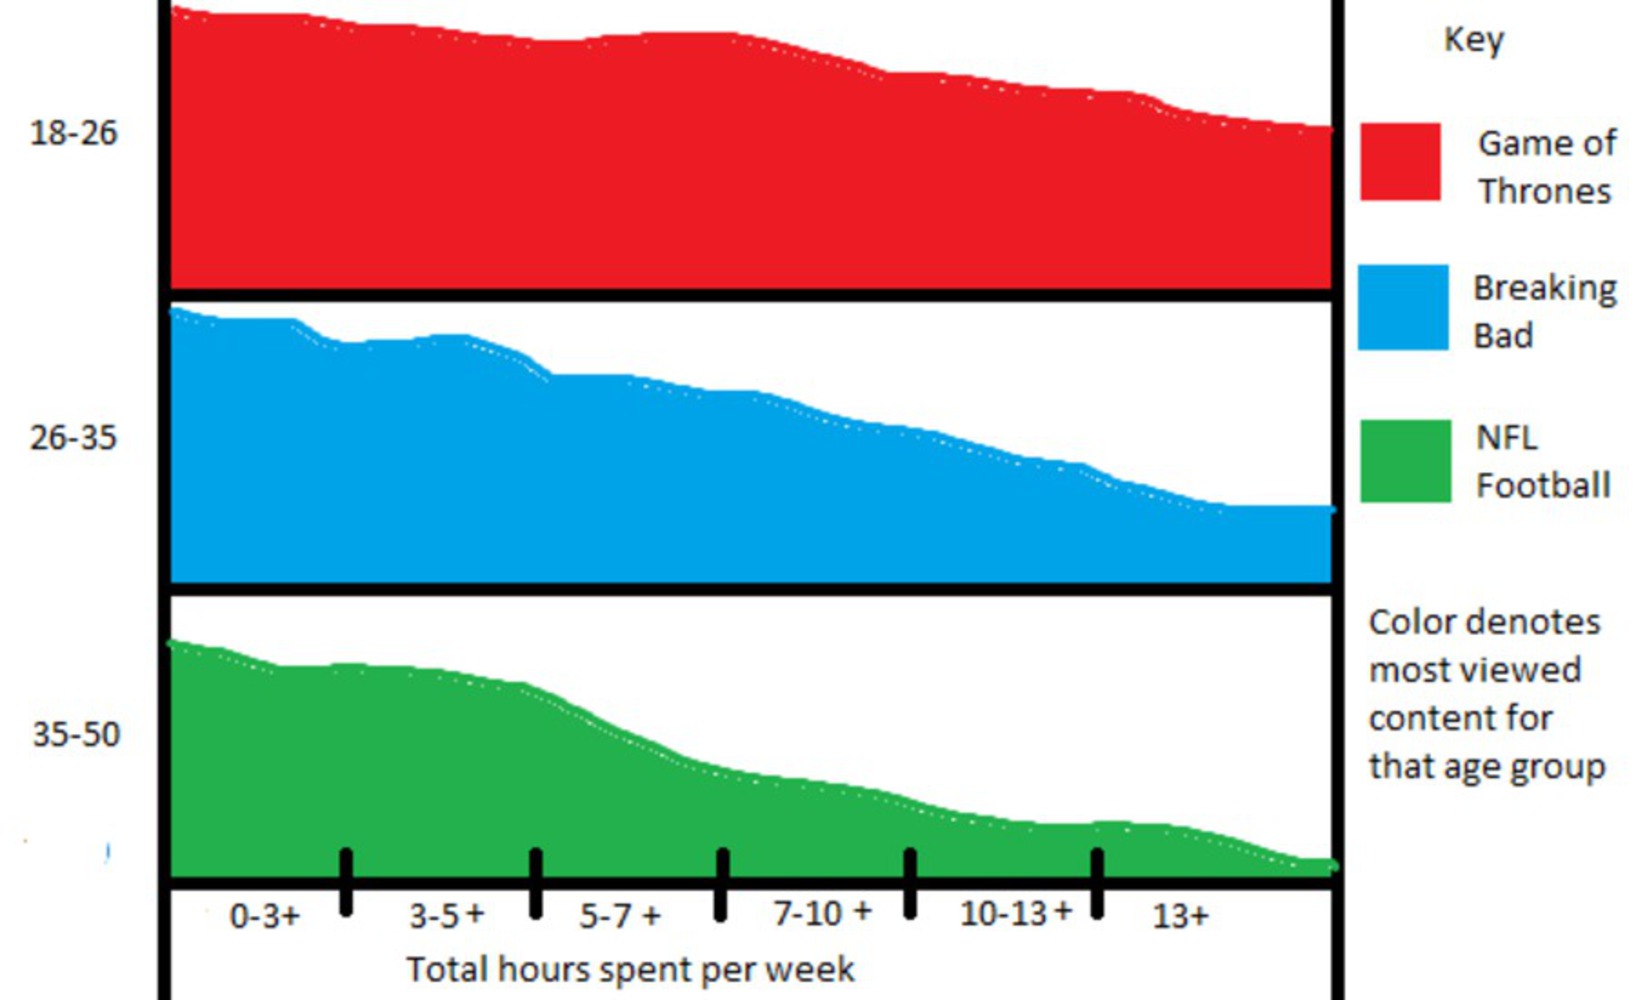
Charts.thumb
Show Advanced Options


After clicking on a specific state, you see this chart depicting total hours spent watching TV per week categorized by age. It also displays what show is most popular amongst that age group. I chose to omit exact percentages for the population of people watching a certain amount of TV because the graph size does a better job of explaining it than a number would. 

Streams

This project would acquire data through a user inputting data such as location and age into their personal account. It would then require users to note whenever they watch TV, for how long, and what they watched. These streams may incentivize users by offering recommendations about what shows you might want to watch next as it gathers data about your viewing habits and show preferences. While this may sound counterintuitive by offering suggestions for new shows, it could limit the number of suggestions it gives to you per month. For example, if it knows you are in the middle of watching a certain show, it might just recommend the next episode of that show and refuse to give you new recommendations for a couple of days. 

Closing Remarks

This project incorporates graphical excellence by representing a large amount of data more effectively than words would be able to. The initial map is useful for obtaining a brief idea of which states are most guilty of over-watching TV. My second graphic (the chart) is an example of a space-time-story graphic that Tufte describes. It utilizes space in the thickness of each section. The time is explained through number of hours, and the story of the most popular show (shown through color) gives the chart an extra dimension of extra information.

Feedback

During my meeting with my group, I was given the suggestion of finding an incentive for users to actually report data. This required a lot of thought because I had to make the incentive strong enough to attract users, but weak enough so as to encourage limiting one’s TV usage. As a result, this project aims to first convince people that they should be reducing the amount of shows they watch before giving them suggestions (in moderation) about what new show they might enjoy.

Drop files here or click to select

You can upload files of up to 20MB using this form.