Interactive Visualizer: http://codepen.io/anon/pen/qOKpVa
Outcome
Product
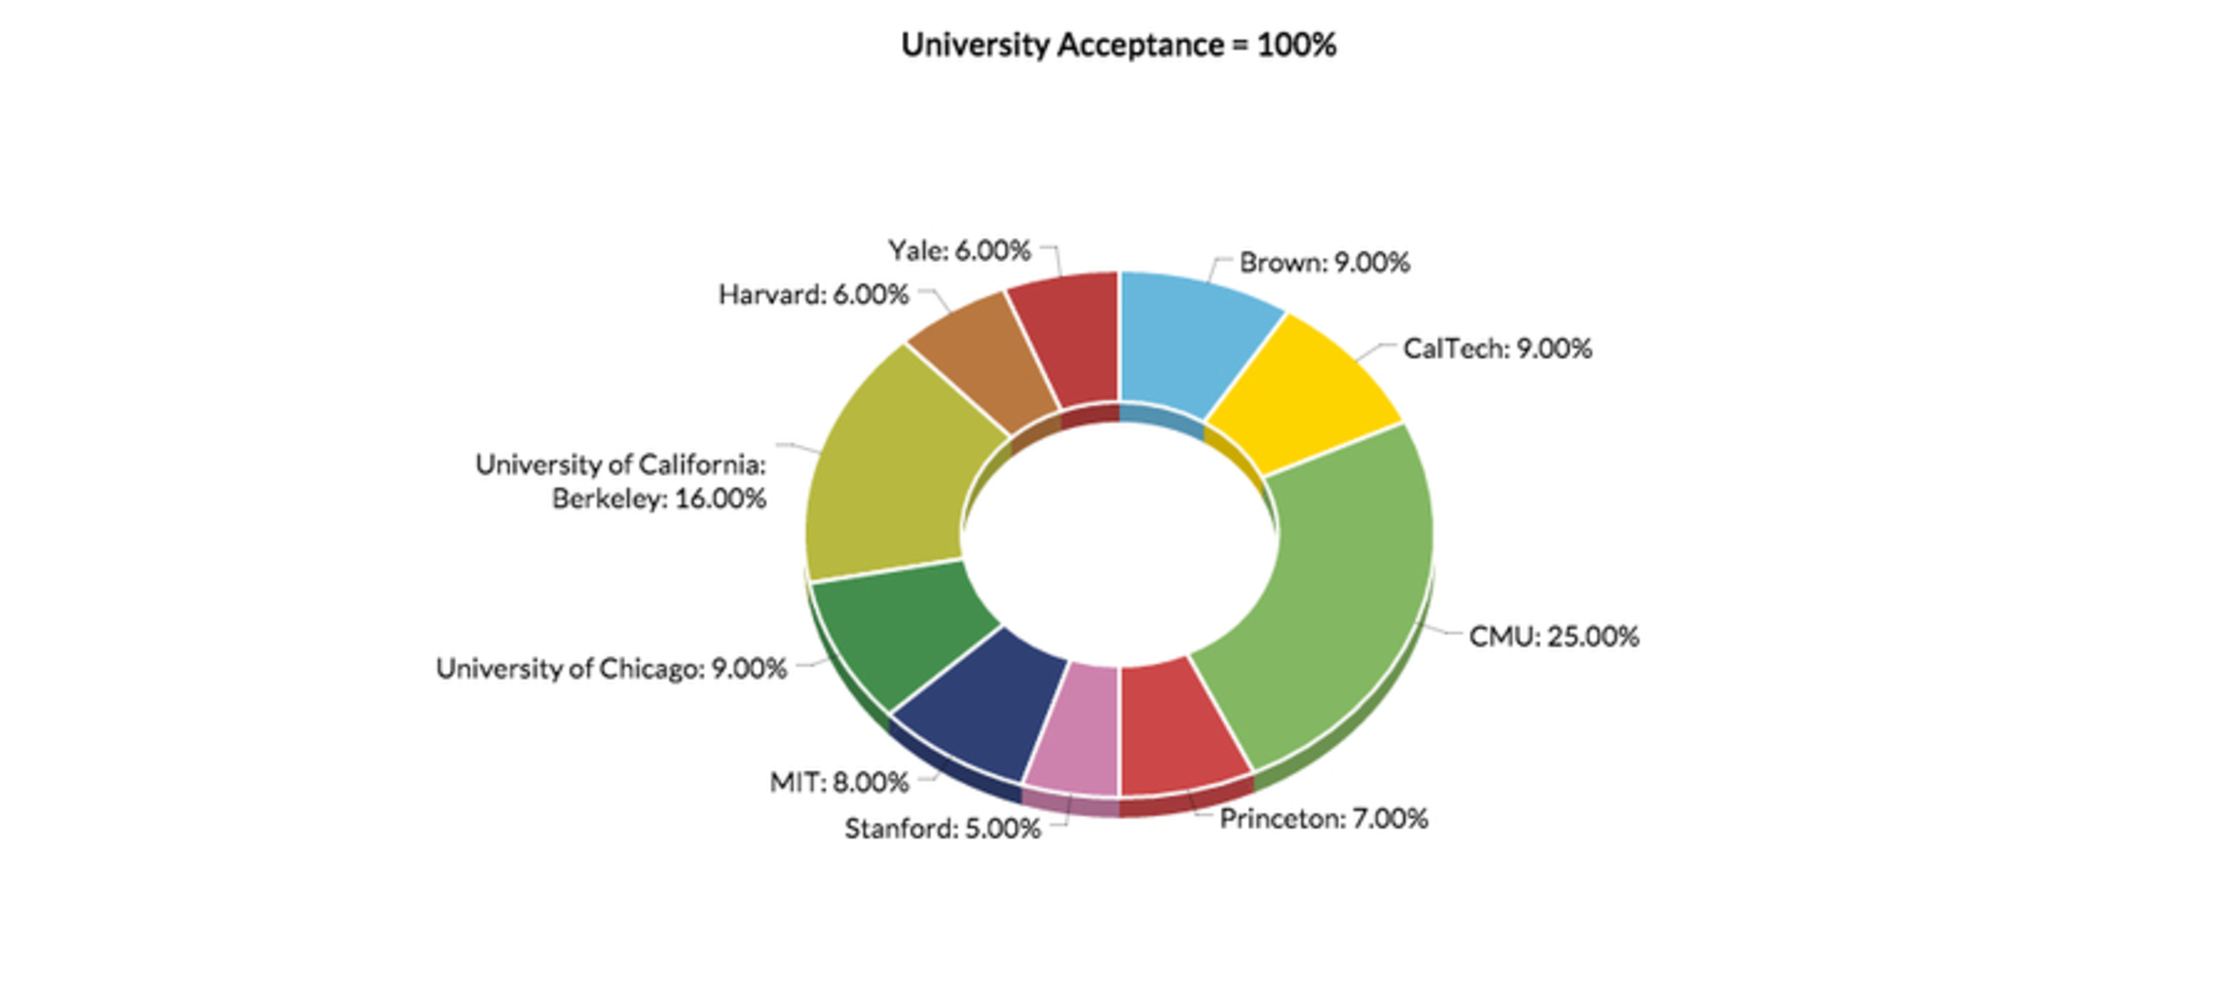
I've created a donut chart of university acceptances from very selective universities. It gives off the impression that by applying to these ten universities, the applicant is 100% guaranteed to be accepted by one of the ten. This is because it seems like if I were to give these 10 universities 100 applicants, Harvard would take 6 of them while CMU would take 25 students. In other words, each would take a piece of the donut of applicants. The piece they each take won't intersect and that each applicant will be accepted. However, this is clearly not the case. These percentages are the percent of applicants that a university accepts from their own pool of applicants. This is a convenient and important distinction that I don't make clear in the donut chart. By creating a donut chart rather a bar graph, it gives off this illusion of each category taking a piece of the whole. If this information was displayed as a bar graph, it would be a much different story.
Intention
My goal with this piece was to represent the false impression the university system in The United States gives to the rest of the world. It may seem that the education system is giving word class education to their students, however, it is only given to a select few people from the entire population. By tricking the applicant that they will 100% be accepted, and then making them realize that it's not so, the viewer can really read into these statistics and see how truly selective these universities are.

Context
I took a class at CMU analyzing the university system in the United States. I knew that there were many parts that were wrong, but I came out realizing a lot more of the injustice behind it. Making families invest all their savings, rocketing tuition, stress on 18 year olds to figure out what they wanted to do with their lives, and no return on investment were just some of things I thought were too much. This project gave me a chance to show a piece of what I thought was interesting about universities and perhaps spark a conversation about the system.
Process
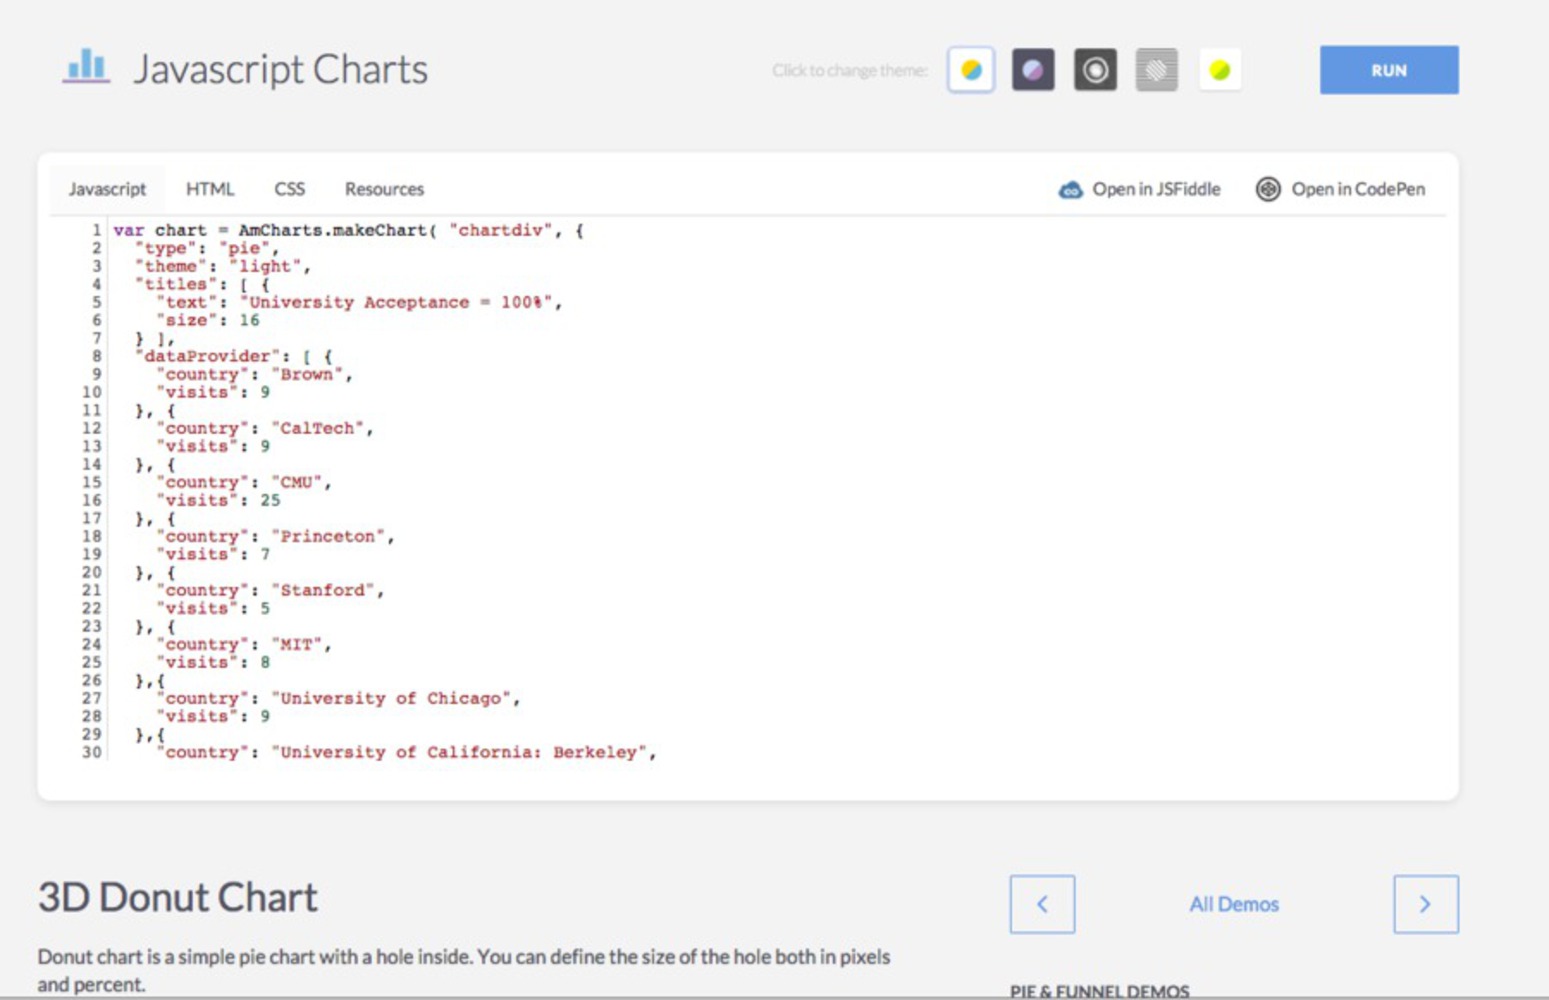
I went online and searched for tools and data. Eventually, I found the percentages from College Board and I used a website called Javascript Charts. I took a listing of the most selective universities and selected the ones with acceptance percentages that added to 100%. Then I edited the demo javascript code to my project.
Reflection
This was an interesting project that made me consider ways to distort information in a visual form and bring out ideas that were important to me. I learned how to look at data visualization differently and how to choose which visuals to use for certain effects. I think if I could do this again, I would try to add different statistics that included the college application process or how much money universities are actually investing back to undergraduate education.
Attribution
Reference any sources or materials used in the documentation or composition.
Where I got the data: https://bigfuture.collegeboard.org/college-search?navid=gh-cs
Data Visualization: http://www.amcharts.com/demos/3d-donut-chart/#theme-light
3d-donut-chart.zip
2.445 KB · Download / View
You can upload files of up to 20MB using this form.