Back to Parent

Outcome


Intention

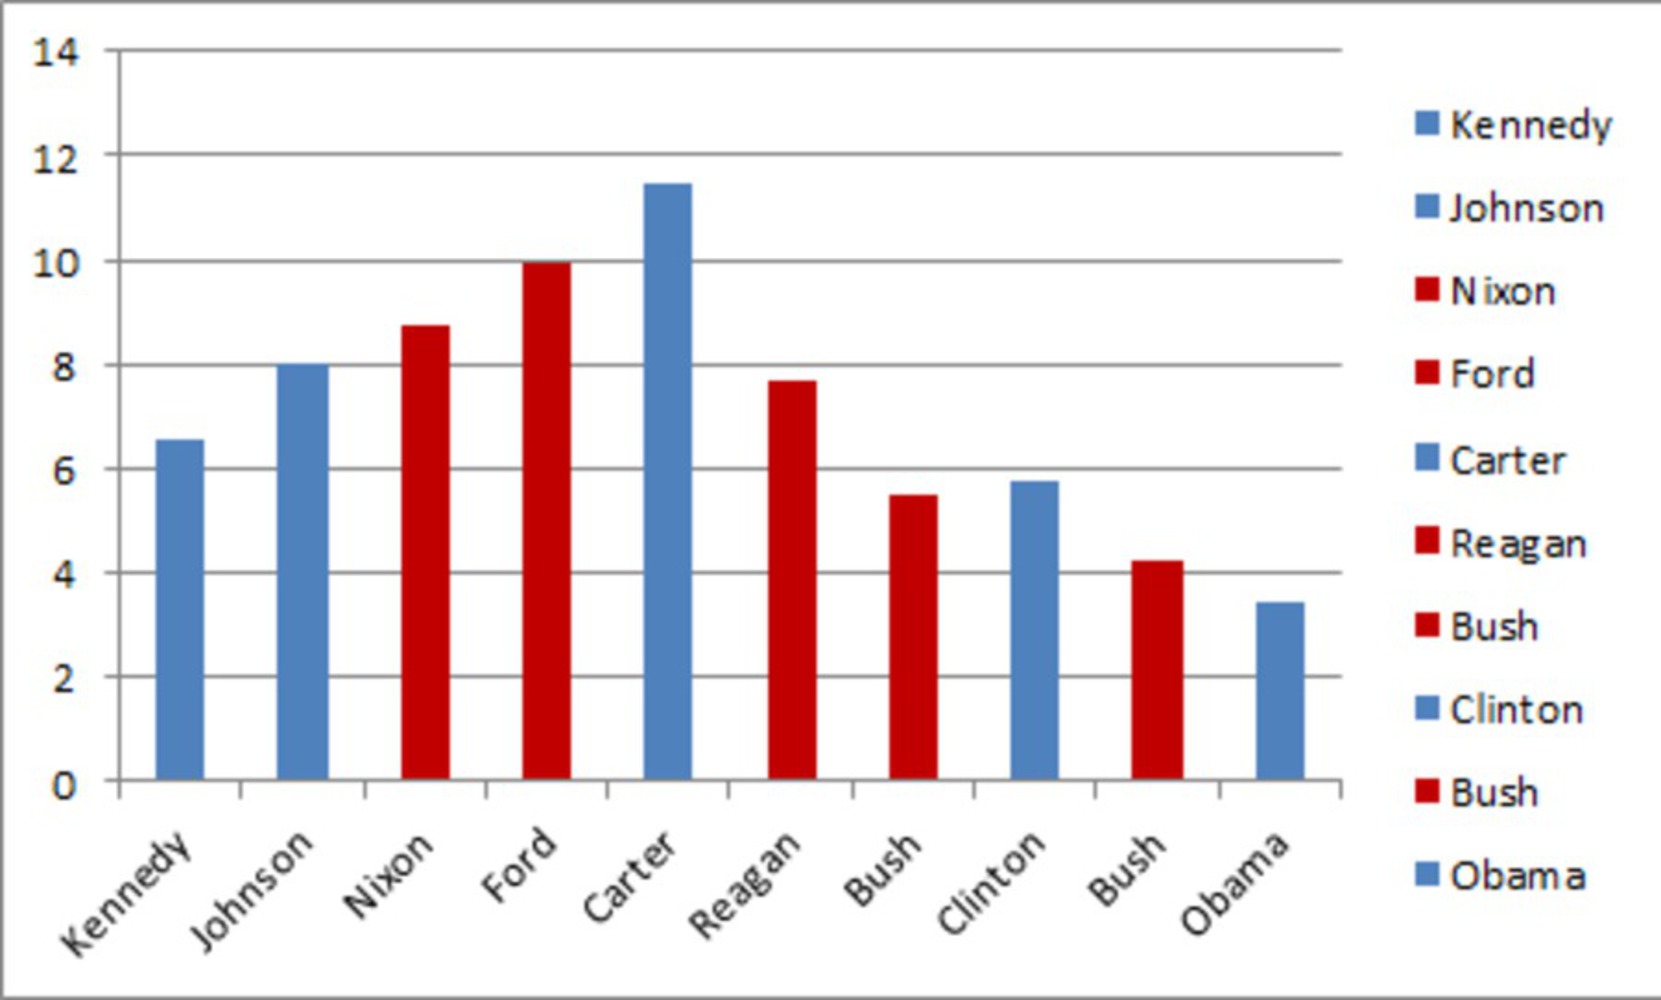
My motivations were to cause people to jump to a conclusion while presenting with some sort of correlation.

Specifically, I chose to look at the effect that a particular party has on the economy. To show this, I took GDP growth and mapped it out to recent presidents, taking into account the party they represented. The results would appear to suggest that a certain party has a "healthier" effect on economic growth...

Product

Basically I looked at GDP growth rate per year and calculated the average over the last 10 presidential terms (which, not surprisingly to me, was evenly split between Democratic and Republican Presidents). I then made a graph correlating the two. Here are the details:

Obama avg GDP growth   D 3.417

Bush Jr avg GDP growth  R 4.220
Clinton avg GDP growth  D 5.747
Bush Sr avg GDP growth R 5.475

Reagan avg GDP growth  R 7.711

Carter avg GDP growth    D 11.492

Ford avg GDP growth       R 9.965

Nixon avg GDP growth     R 8.755

Johnson avg GDP growth D 8.043

Kennedy avg GDP growth D 6.567

Democratic Average: 7.0532
Republican Average: 7.2252

We can see that the Republican party has a stronger, more positive effect on the economy.

President gdp correlation.thumb
Show Advanced Options

Context

I'm pretty sure there's many sources that have done similar correlations. Some probably more thorough than mine. Still, with so much information being thrown around, I wanted to add a little piece to the puzzle. Obviously, GDP growth is just one measure of a nation's economy, and it doesn't tell us the whole story. And of course, correlation does not prove causation. But, isn't the point of this assignment to lie?

Process

I thought about what I wanted to do. I thought long and hard. Mostly because I didn't really know where to go with this project. This is the kind of project I would've loved to dedicate weeks to create some sort of larger thing. But that's not what happened. So I googled GDP in the US for the past few years and calculated the average over a President's term. Then I made a graph about it.

Reflection

I kind of had the impression that GDP would improve more during Republican years, as they tend to be more fiscally liberal. That being said, I wish I had more time to create a larger project in which we take multiple variables and correlate them to presidential terms.
Drop files here or click to select

You can upload files of up to 20MB using this form.