Outcome
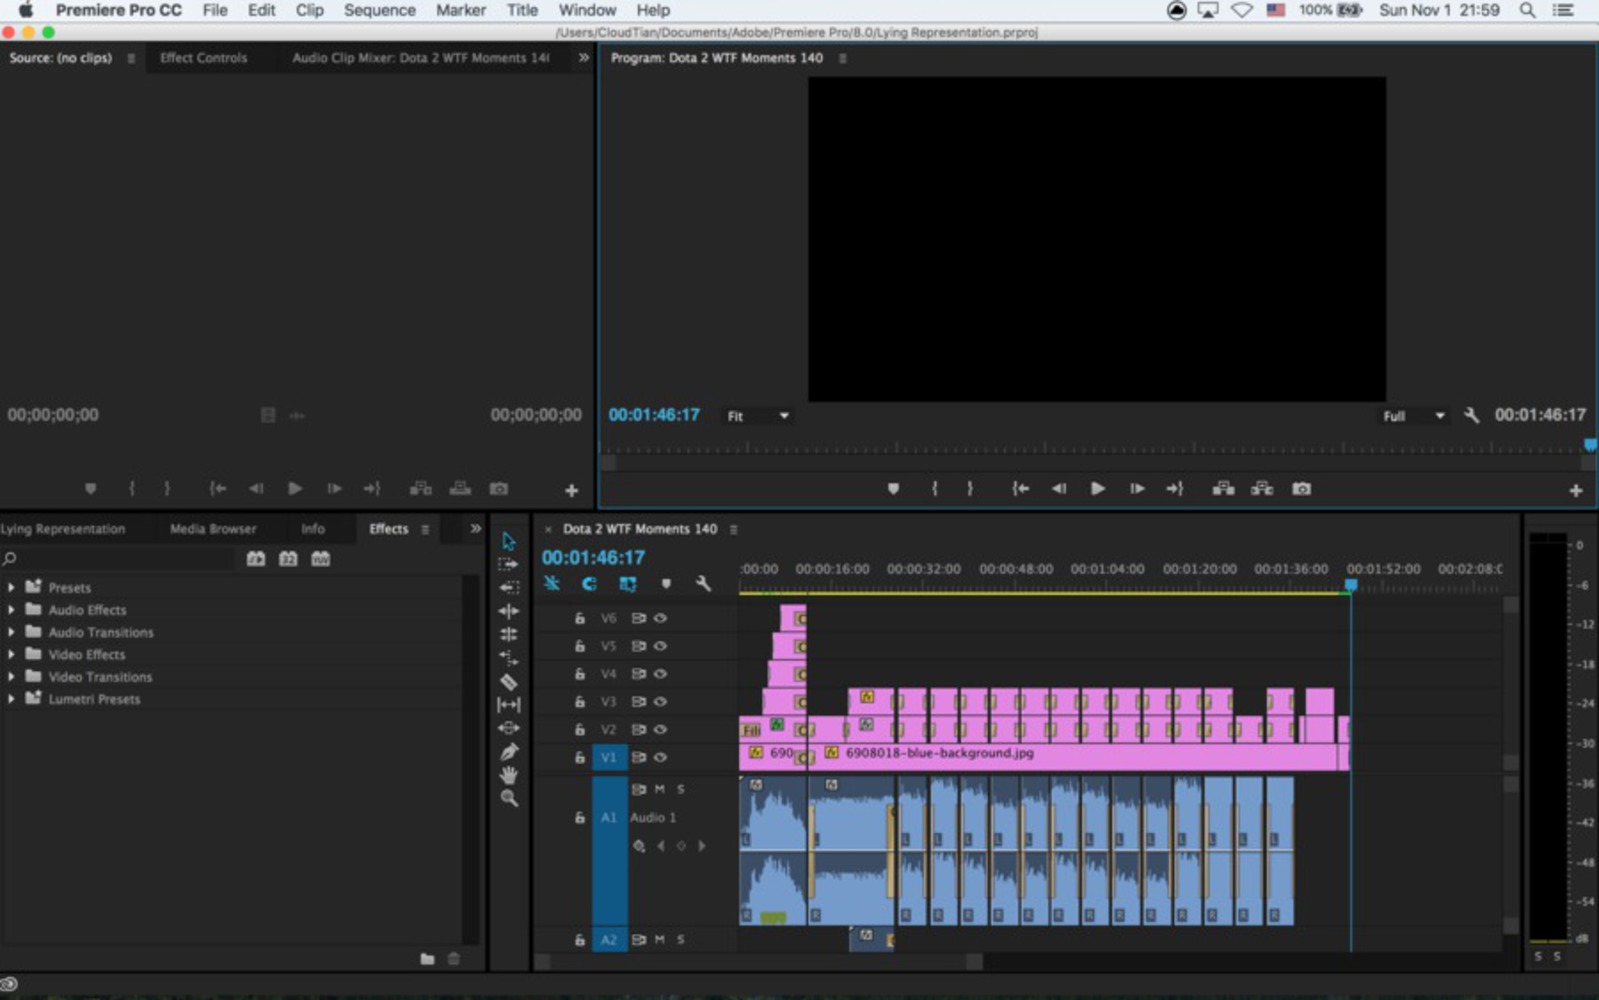
I created a video as my product. In the video, I used applause sound effect to present a survey data about the best-selling video game 2013 according to genres. I use Adobe Premiere Pro to edit a lot of source material I collected.
https://drive.google.com/file/d/0ByTIIb3QOSVLUDRRY1hBcVB6clk/view?usp=sharing
After all the examples I have seen are visual representation of data. No matter how beautiful, how efficient those graphs are, they all requires eyes and visuals. So my goal is trying to break this rule by presenting data through audio. Since the second primary purpose of this project is to lie about data, by using audio, it's pretty easy to mislead my audience.
Actually, there is no projects or example I saw that directly inform my ideas and outcome. But as soon as I read those examples in last week's reading, my very first impression was "why can't I create an audio representation of data that is as artistic as those in the readings". So, it was my little "rebellious" mind that informed myself the idea and outcome.
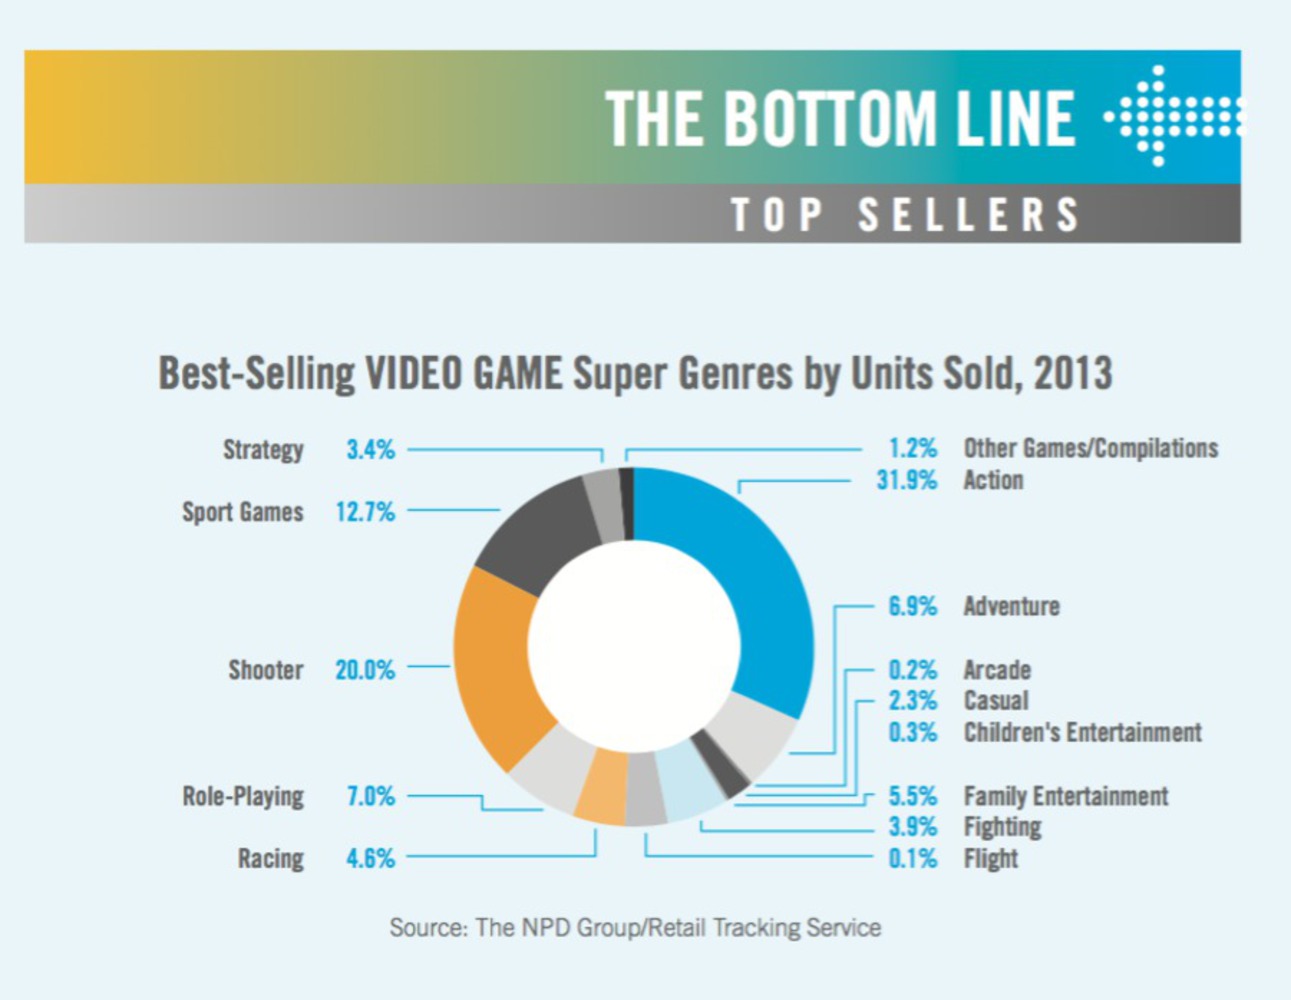
Since I'm a gamer, the very first kind of data I came up with is the data of best selling game according to genres. So I googled a report from ESA(Entertainment Software Association) called "ESSENTIAL FACTS ABOUT THE COMPUTER AND VIDEO GAME INDUSTRY". Then I selected a set of data from the report which is about the best-selling video game in 2013, sorted by genres. Then I also searched a lot of photos that can represent each genre and used them in my video presentation.
There weren't much choice to make to make an audio representation: I can either use different pitch or use the same piece of audio but different volume. In my case, the data I choose is not primary for comparison, so different pitch can't effectively present the data and thus I use different dB to present the data. I find an applause sound effect and, for each genre of the game in the chosen data, I adjust the audio by reseting it's audio gain to the number shown in the data. Since the difference of loudness is hard to detect by ear, it's a good way to lie about the data by using audio.
As for the challenges I encountered,since I don't want to make a video just to present the data, I explored a lot of animation effects in Premiere Pro and I watched a lot of tutoring video to learn how to use them and this takes me a lot of time. But the process to explore those effects is pretty exciting.
Although this project is not a perfect way to use audio to represent data, this is my first try of "visualizing", or acoustic-lizing(...?), data and my first try to make a video that has special effects in it. So I've learnt a huge lot about video-making technique. And... I learned how painful it was to list all the data and present them one by one by hand, so that's kind of get known to the hard process.
If I were to do this differently and with more time, I would probably design a set of audio representation that can present data as functional as charts and can be used for a lot of data.
You can upload files of up to 20MB using this form.