Outcome
Intention
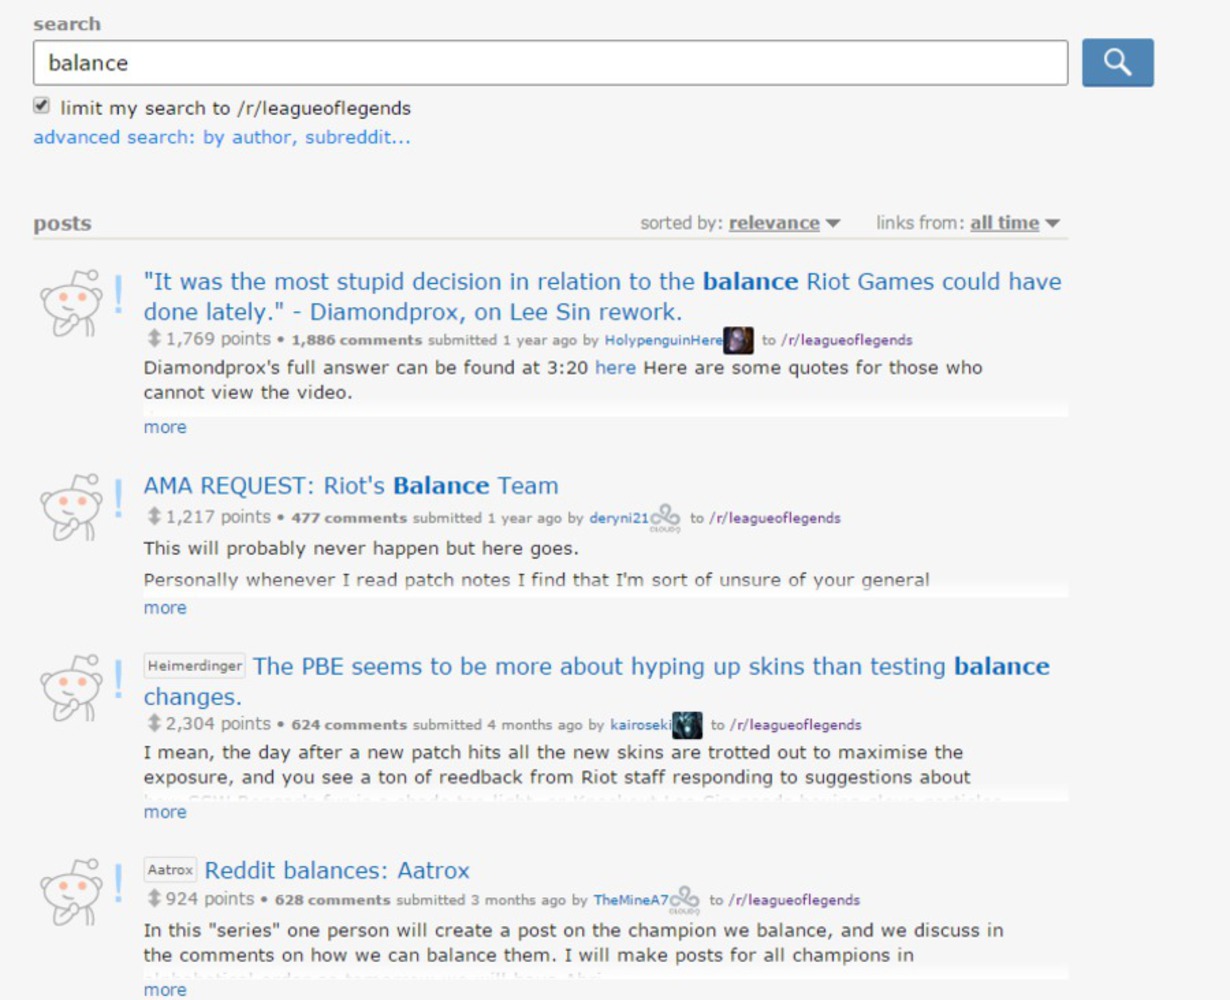
This idea came to me while I was browsing the League of Legends subreddit. Often times it is a medium in which people will vent their frustrations about "imbalanced" aspects of the game, whether it's regarding the characters (champions), neutral monsters and objectives, how certain champion abilities/spells interact with each other, etc. The number of complaints greatly outweigh the number of praises, but this is just human nature. With a game such as "LoL", it is essentially impossible to perfectly balance all aspects of game-play. Even if it was, it would be a stale environment that would never change over time, and that wouldn't be any fun to play.My intention with this project is to take on the role of a person who is negatively criticizing the way that Riot Games designs their game and the state of the current game balance. Whether or not it is true is entirely subjective seeing as there is an astronomical amount of unique games that one could play (to be specific, it would be something like (121 C 10) = 1.265x10^14 combinations, and that's not including the different roles a particular champion could play).
Context
To gather all the information that I did, I utilized the website op.gg, in particular the North America version. There they have a statistics utility that can be used to find all sorts of information including win rate, games played, kill/death/assist ratio, creep score (how many enemy minions you kill), and gold earned, all of which can be filtered for time scope (day, week, month), skill division, and game mode.For this project, I used information all from this week and from competitive (ranked) games, but varied it across skill division (all vs only highest tier). I also manually collected the win rate and number of games played for all 127 champions for this month. If this project had a larger scope I would have written a program to scrape the HTML data from the page I was using, but I only had to do it once so it wasn't worth the effort.
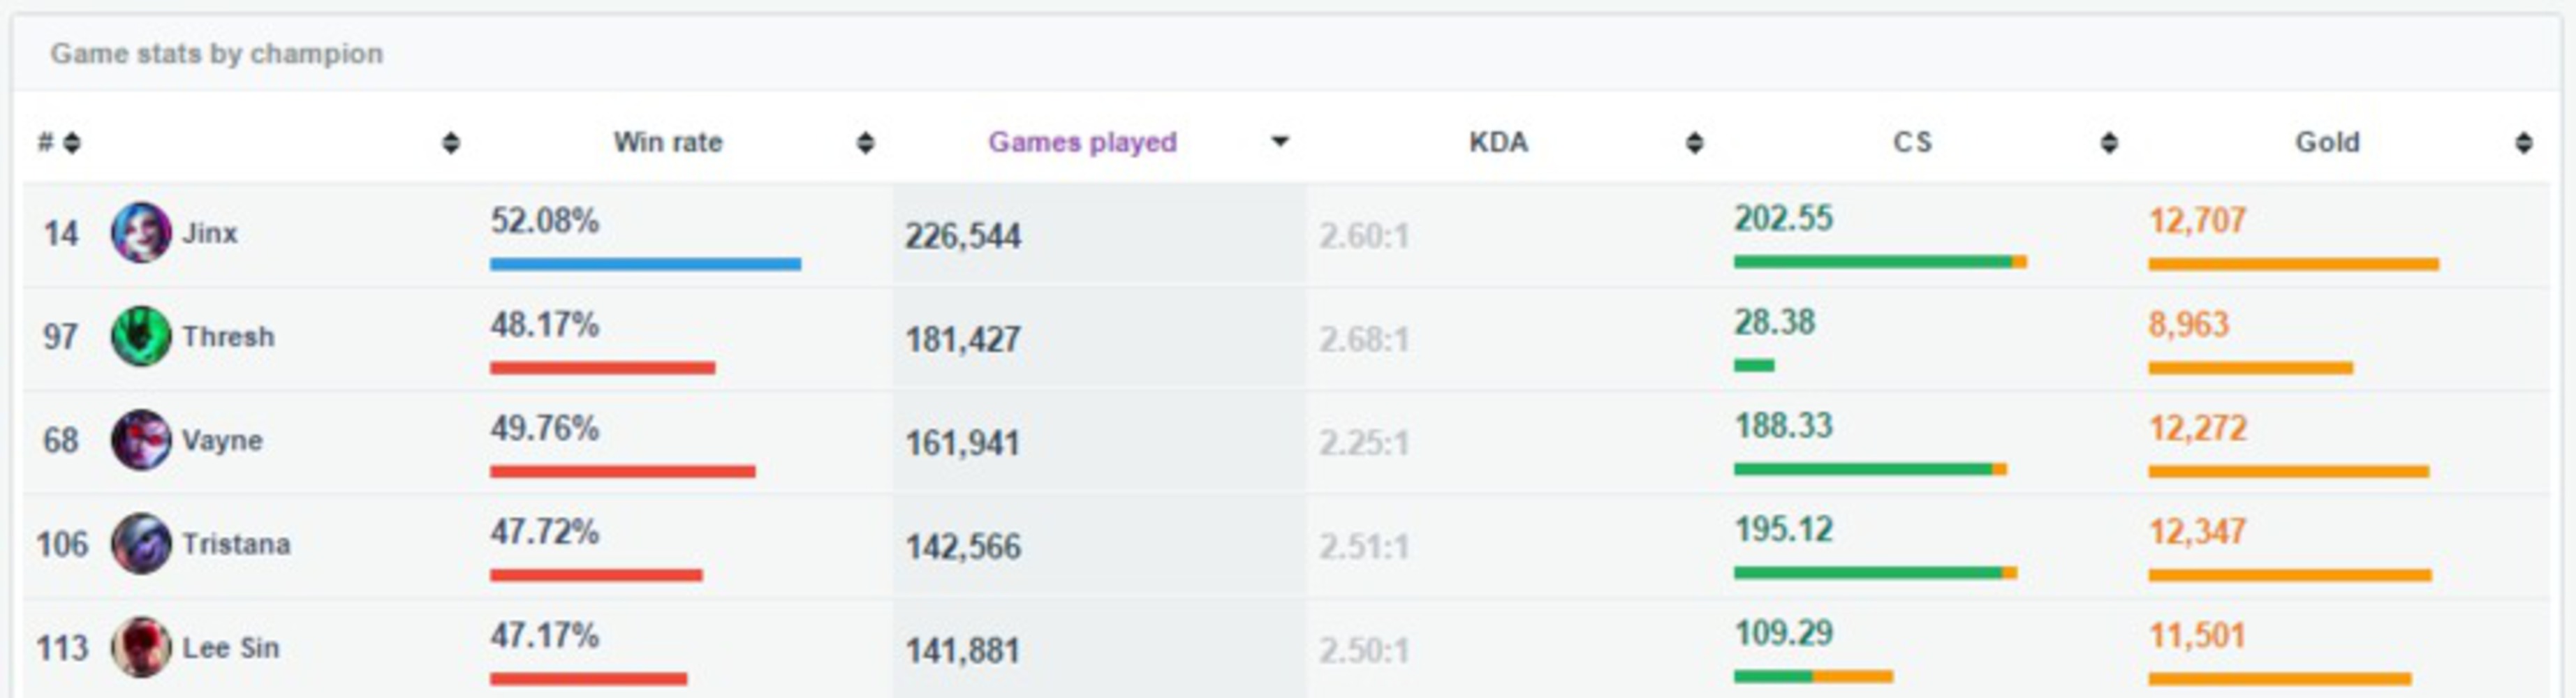
It is fairly easy to notice that only one of the top 5 most popular champions has a positive win ratio. This means that Riot does not care about what champions that people like to play and do not bother to buff (add power to) them to bring them to a 50% win rate.
Now for a look at across the spectrum of all win rates. Below are the top 2 highest and lowest win percentages.


As we can see, the top 2 win rates are at about 3.5% above average (50%) while the bottom 2 are at 7-8% below average, a difference of at least two-fold. This means that Riot neglects certain champions and aren't concerned about how they are performing abysmally compared to the majority of other champions.
And finally for a look at the Challenger Division. This is the top 200 players in the NA region in terms of solo ranking.
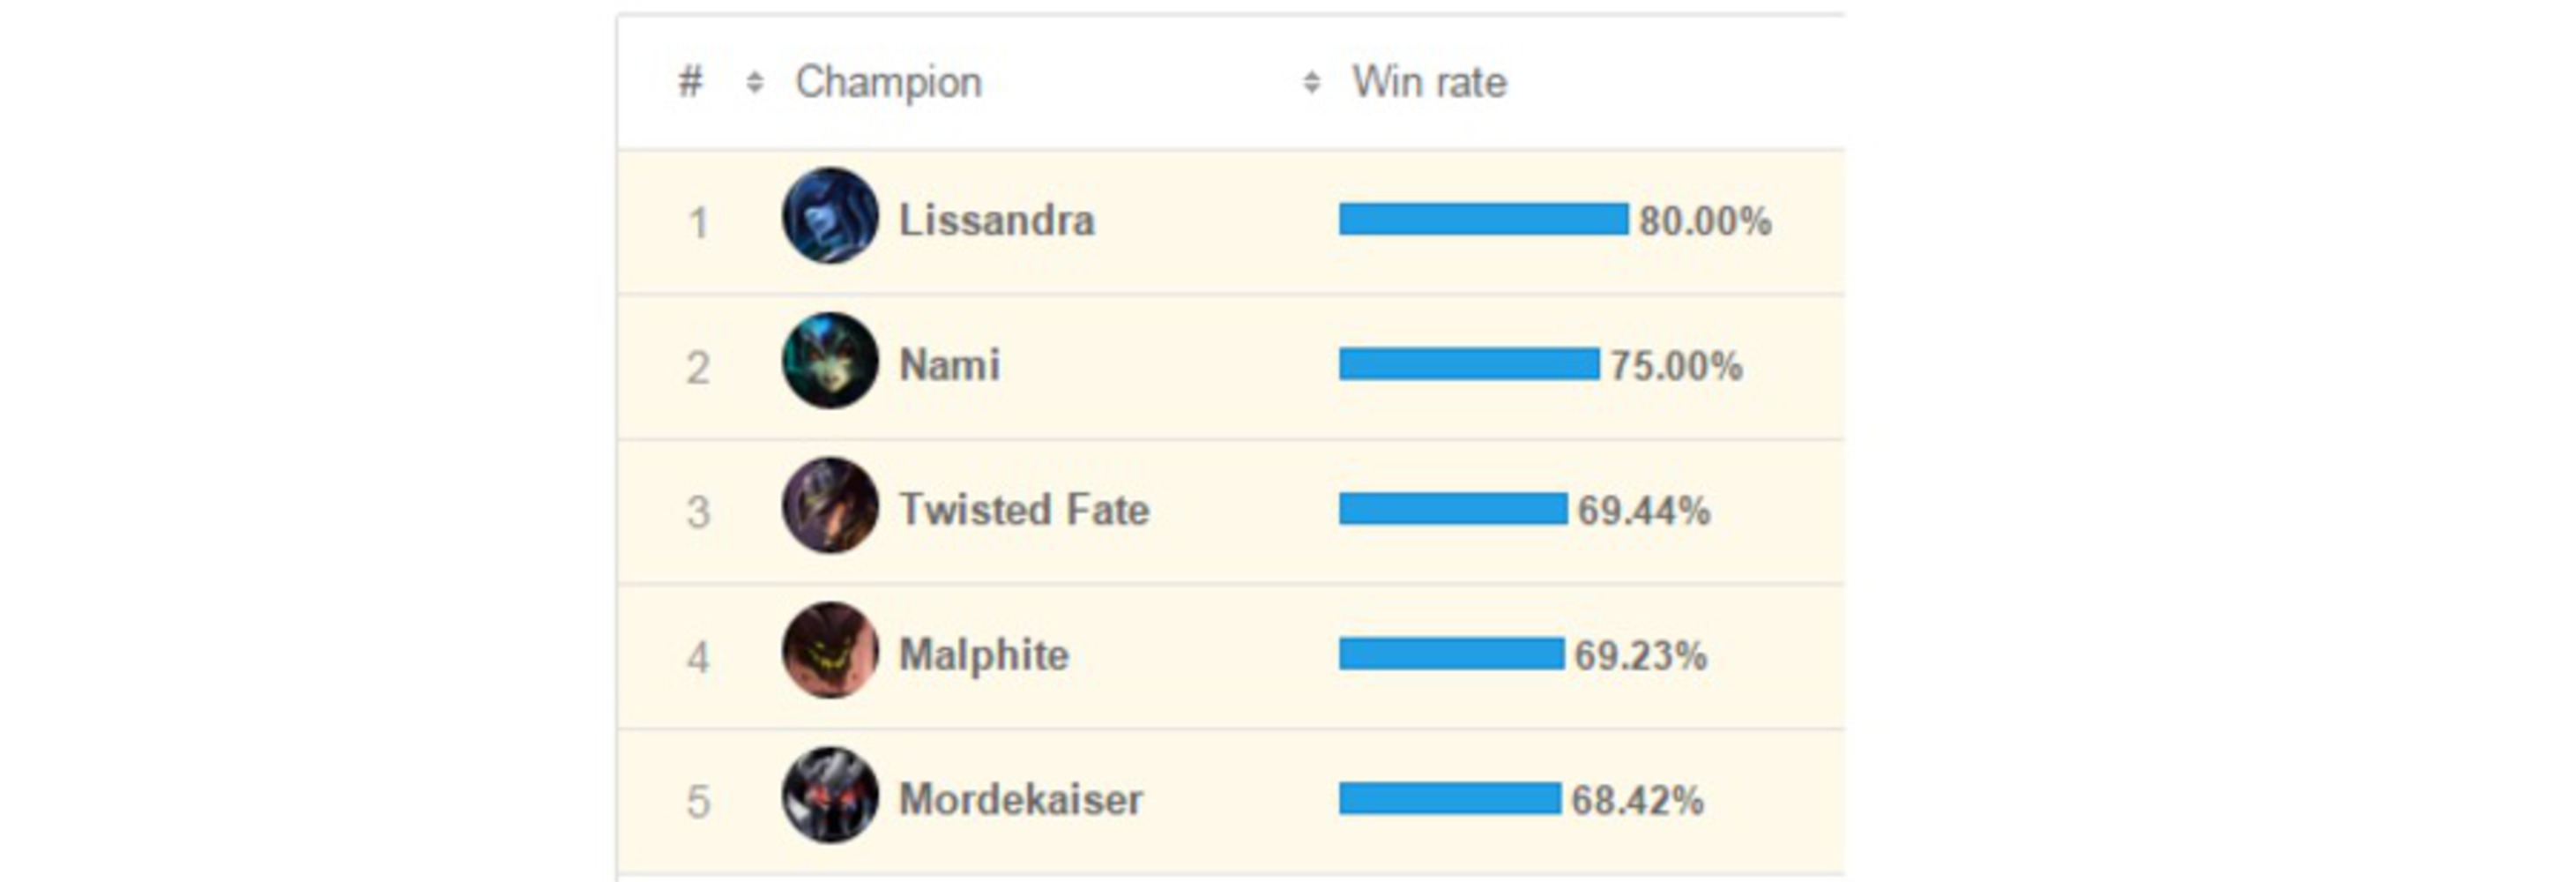
As you can see, the win rate for Lissandra is a whopping 80%! Surely there is something about her that makes her incredibly overpowered, no champion should be anywhere even close to that win percentage. 2nd-5th place are also insanely high percentages. Clearly Riot doesn't know what they are doing when balancing champions around the capabilities of the best players, something that is very important to the professional scene.
Or do they?...
Let's look back on my claims and attempt to counter the apparent flaws that they point out. I have played the game for about 5 years, so I think I have some pretty good insight about game-play that can't be explained by simply looking at raw numbers and stats.
With regards to the top 5 most played champions of the week and their apparent lack of positive win percentage, I think it is because they are either A) fun to play but hard to master, or B) easy to play but are not as strong as other picks. For example, Lee Sin is considered one of the most fun champions to play because of high mobility and opportunity to make flashy plays, but it is very punishing to play him if you are not mechanically sufficient to unlock his potential. Also, if you fall behind your opponent in terms of power, it becomes difficult to rebound and close that gap. Tristana falls under group B. She is very straightforward to play, but it takes a long time for her to become influential in the game and sometimes the game will be over before she reaches her stage of power.
Looking at highest win percent versus lowest win percent, I also have another theory. I think it isn't coincidental that both Brand and Malzahar, the two highest win percentages, are both champions that have hardly undergone changes to their abilities and stats over time. Anything that has been changed was relatively minor and there has been a good amount of time between each change. This means that people who play those champions have had a long time to master them and become familiar with exactly what their limits are. On the other end we have Ryze and Azir. Both of these champions are constantly being changed, reworked, and bug-fixed. Ryze in particular has undergone heavy changes to his abilities and play-style multiple times. Every time he is changed, it is like having to start from scratch for the people that enjoy playing him.
Finally, with the highest win percentages in the Challenger tier statistics, it is easy enough to explain the numbers if I just add a little more to the picture.
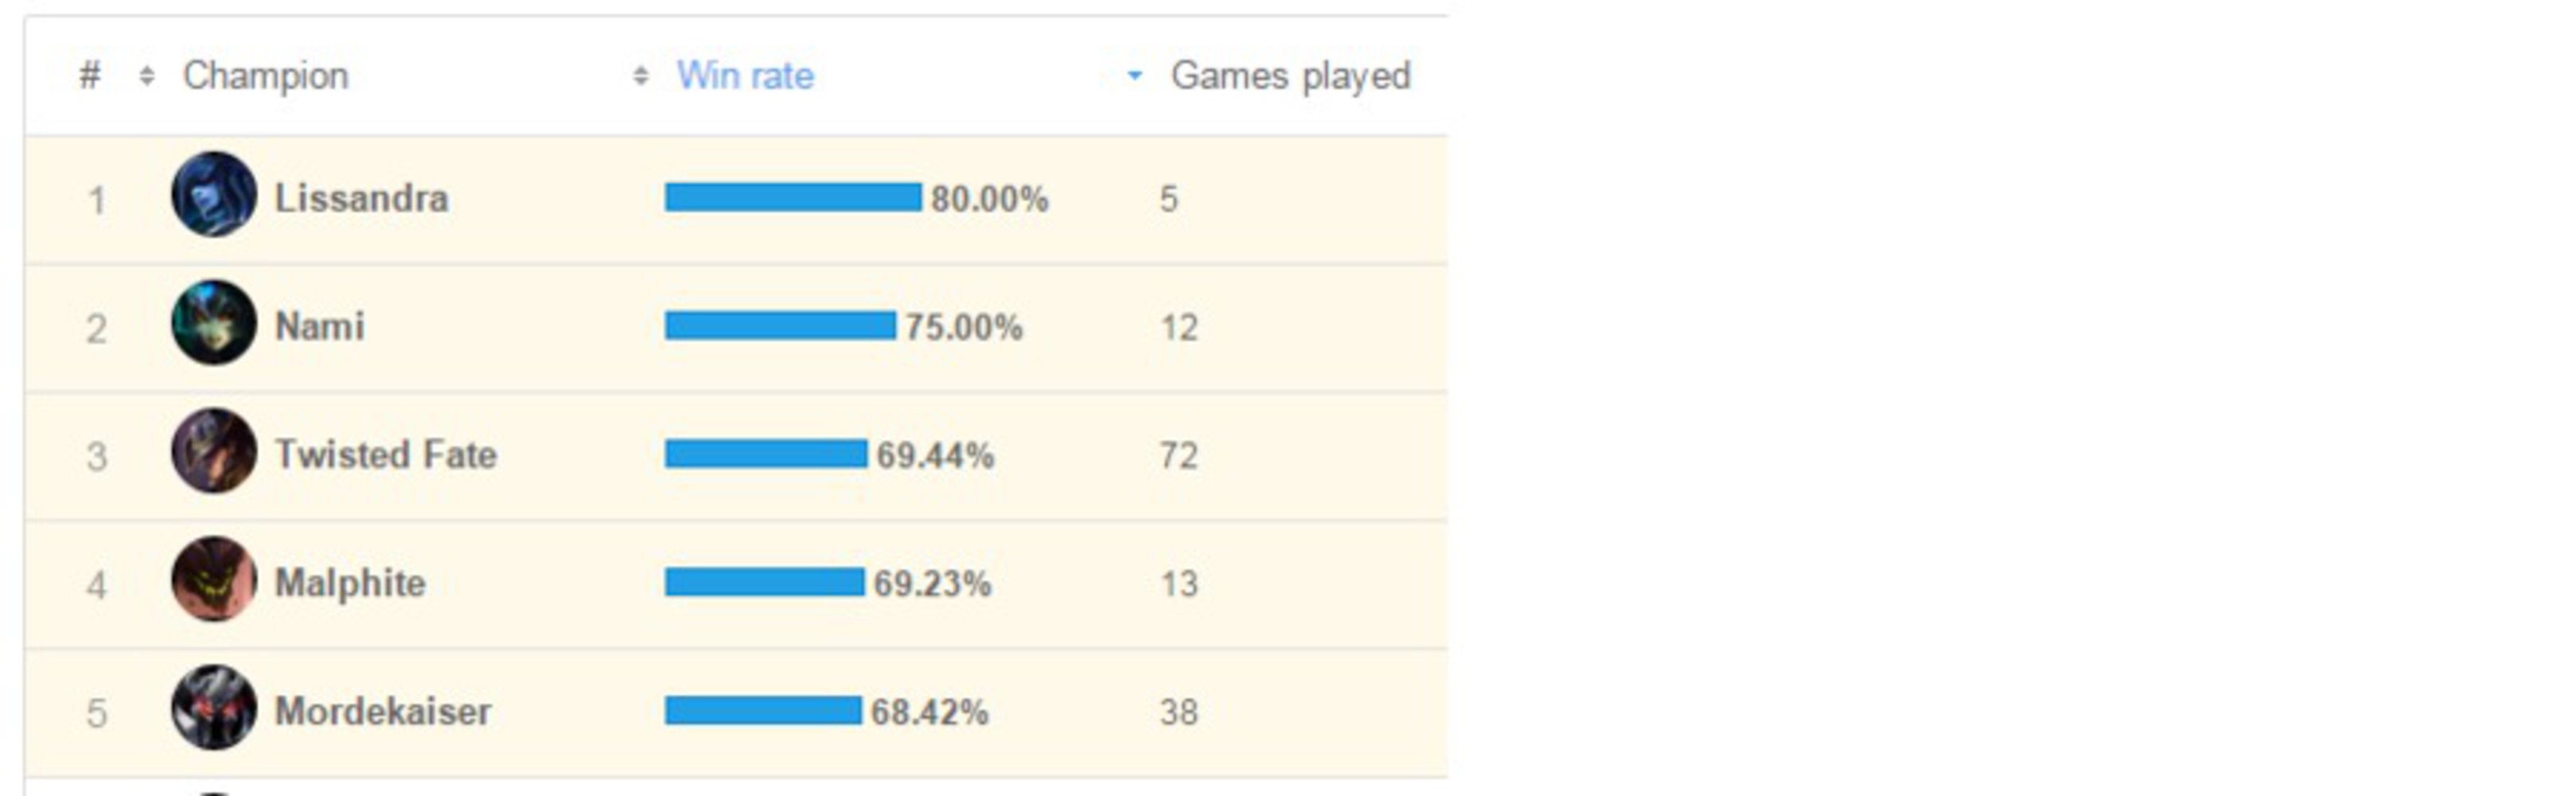
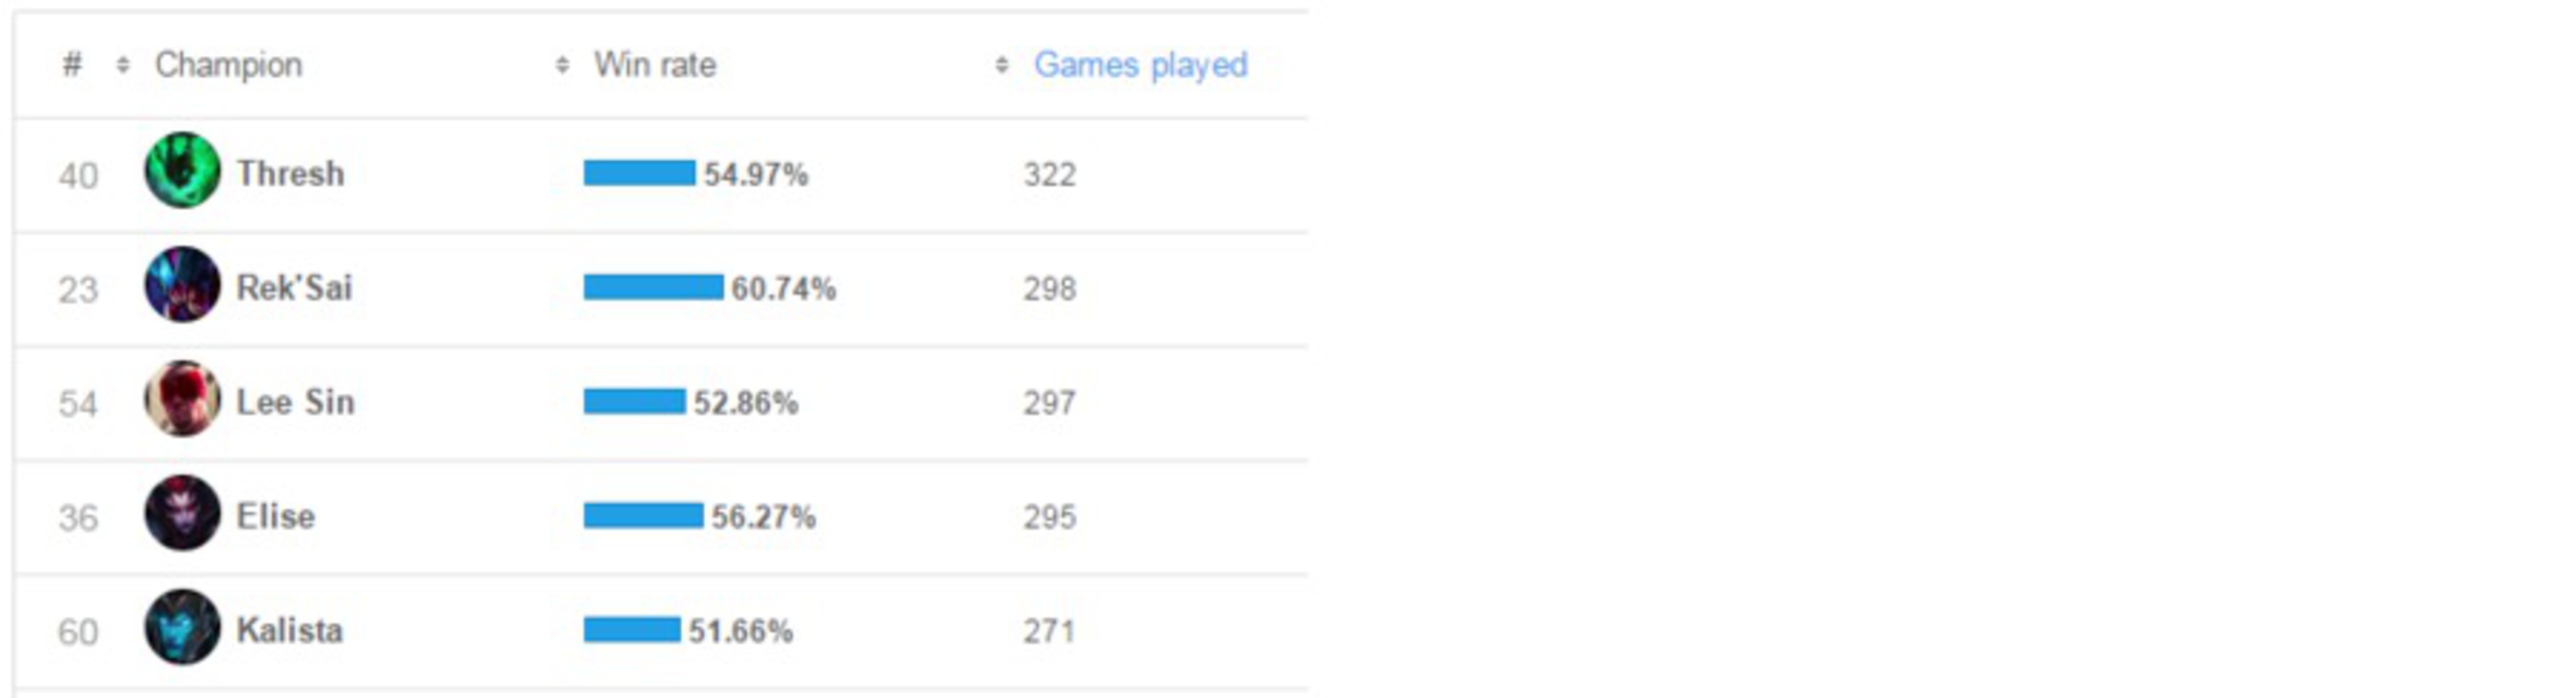
As you can see, there was merely 5 games played the entire week in the Challenger tier with Lissandra in it. That means there was 4 wins and 1 loss. That is an incredibly small sample, meaning that the win percentage has no real weight to it. Normally in statistics, the bare minimum for sample size is 30. To give some reference, the 5 most played champions in Challenger were in about 300 games each for the week. Their win rates still vary quite a bit, but they are much closer to 50% (seen below):
Reflection
Overall, I quite enjoyed doing this project. I like working with numbers and statistics and analyzing their meanings. Occasionally there will be projects similar to this posted which is where I drew inspiration from. I think I learned a bit about micro versus macro analysis and being able to put reasoning to numbers where words aren't so easily derived from. If I hadn't have known so much about the subject I was doing the project on, I think it would have been much more difficult, but luckily I manged to find something that I enjoy and apply this project to it.Also to add to my reflection, I decided to create a Games Played vs Win Rate graph for all champions for the past month.
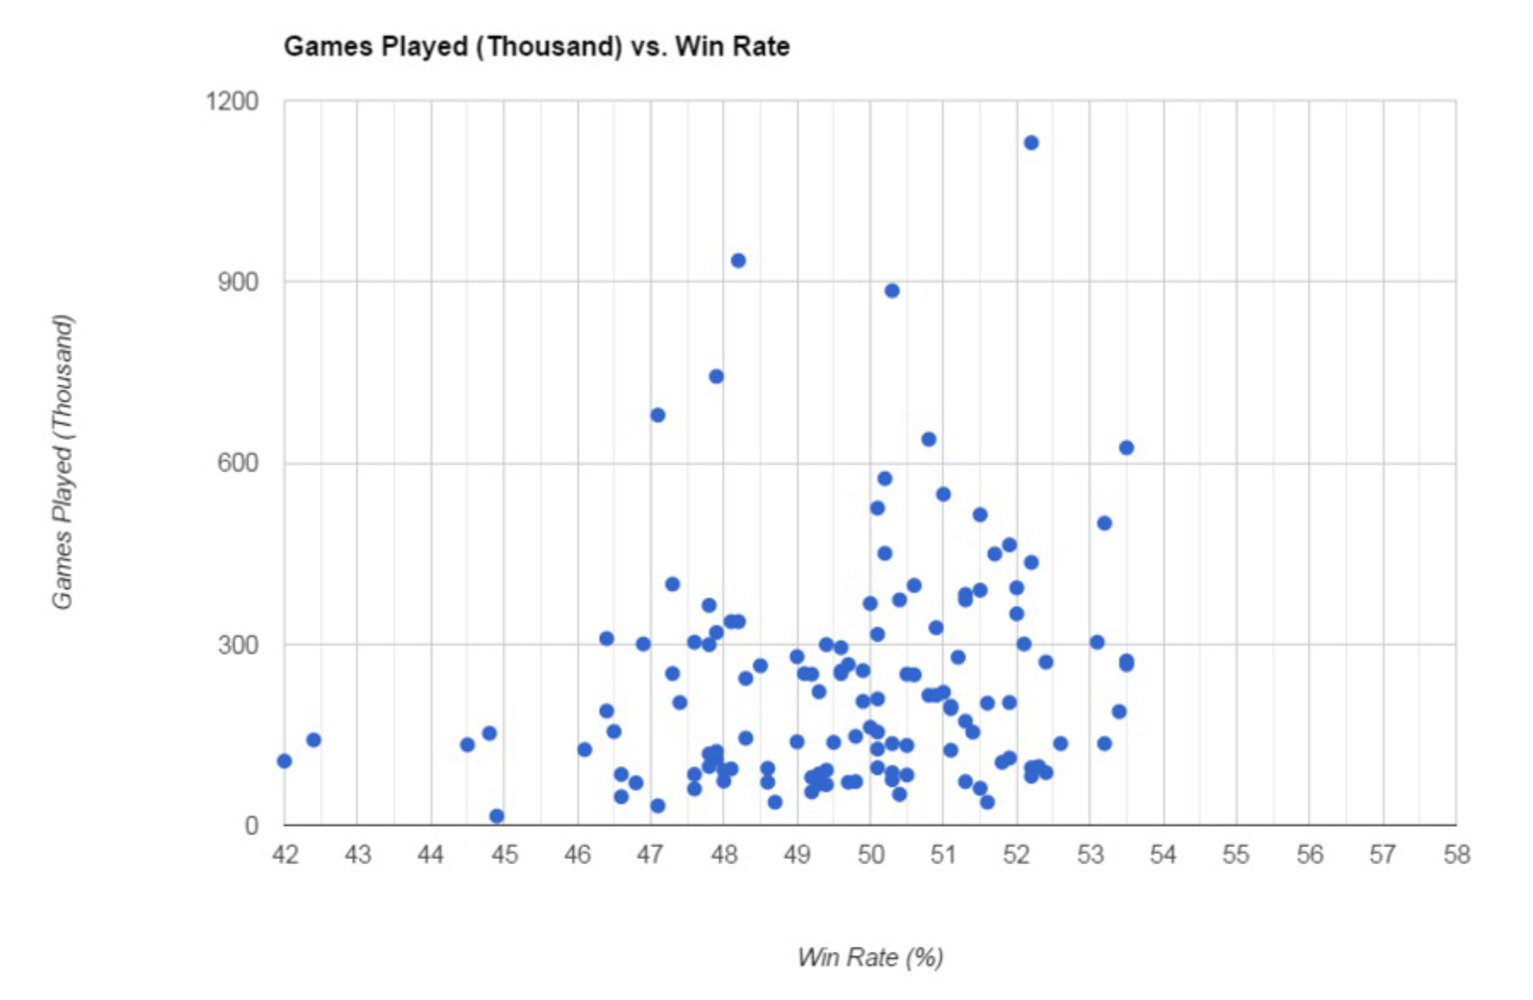
With the exception of a few outliers on the low end, win percentages are quite balanced around 50%. I think Riot games deserves credit for being able to come even close to such a spread considering there are over 100 unique characters in the game and even more items that each can use. Can it be improved? Of course, I think it gets into a philosophically gray area as there are so many aspects to consider.
I know this is a big wall of text, but I found this more enjoyable that I thought it would be.
You can upload files of up to 20MB using this form.