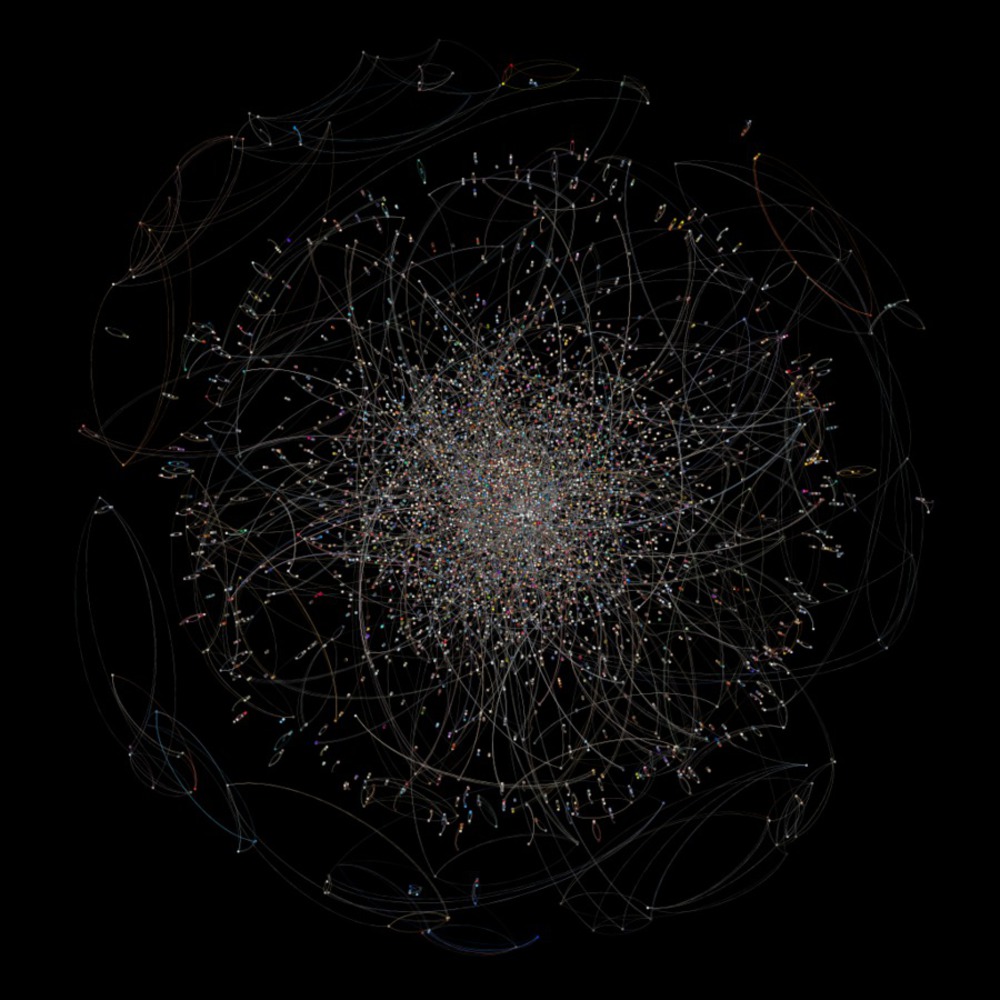
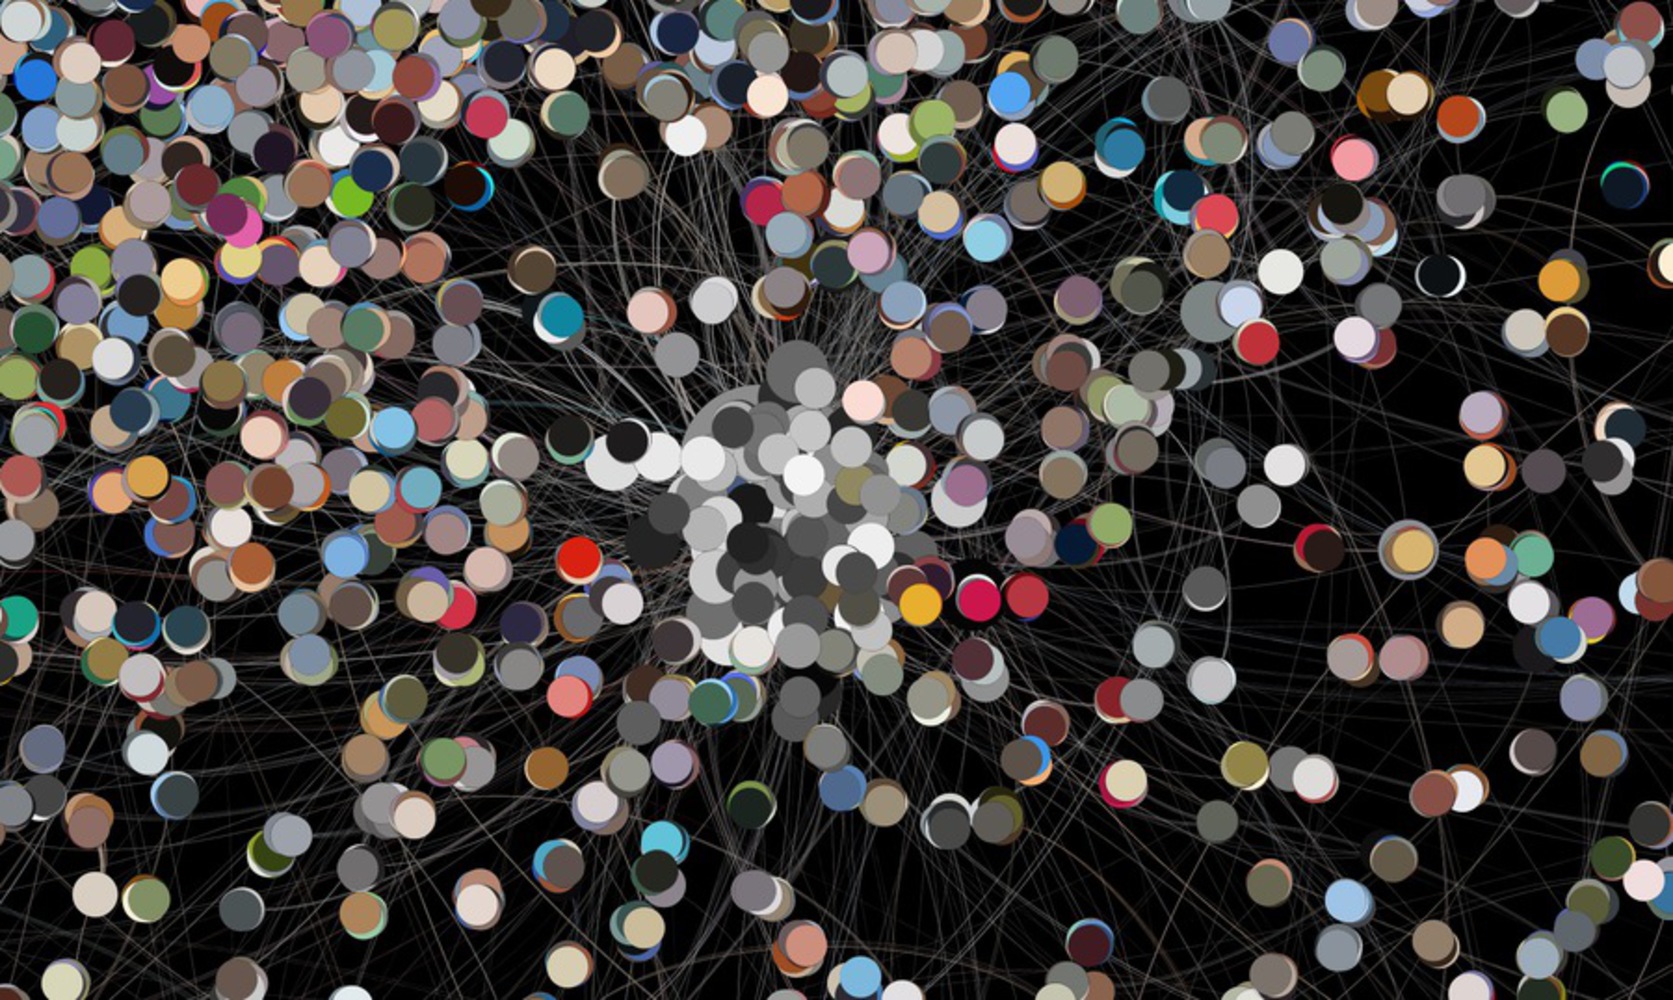
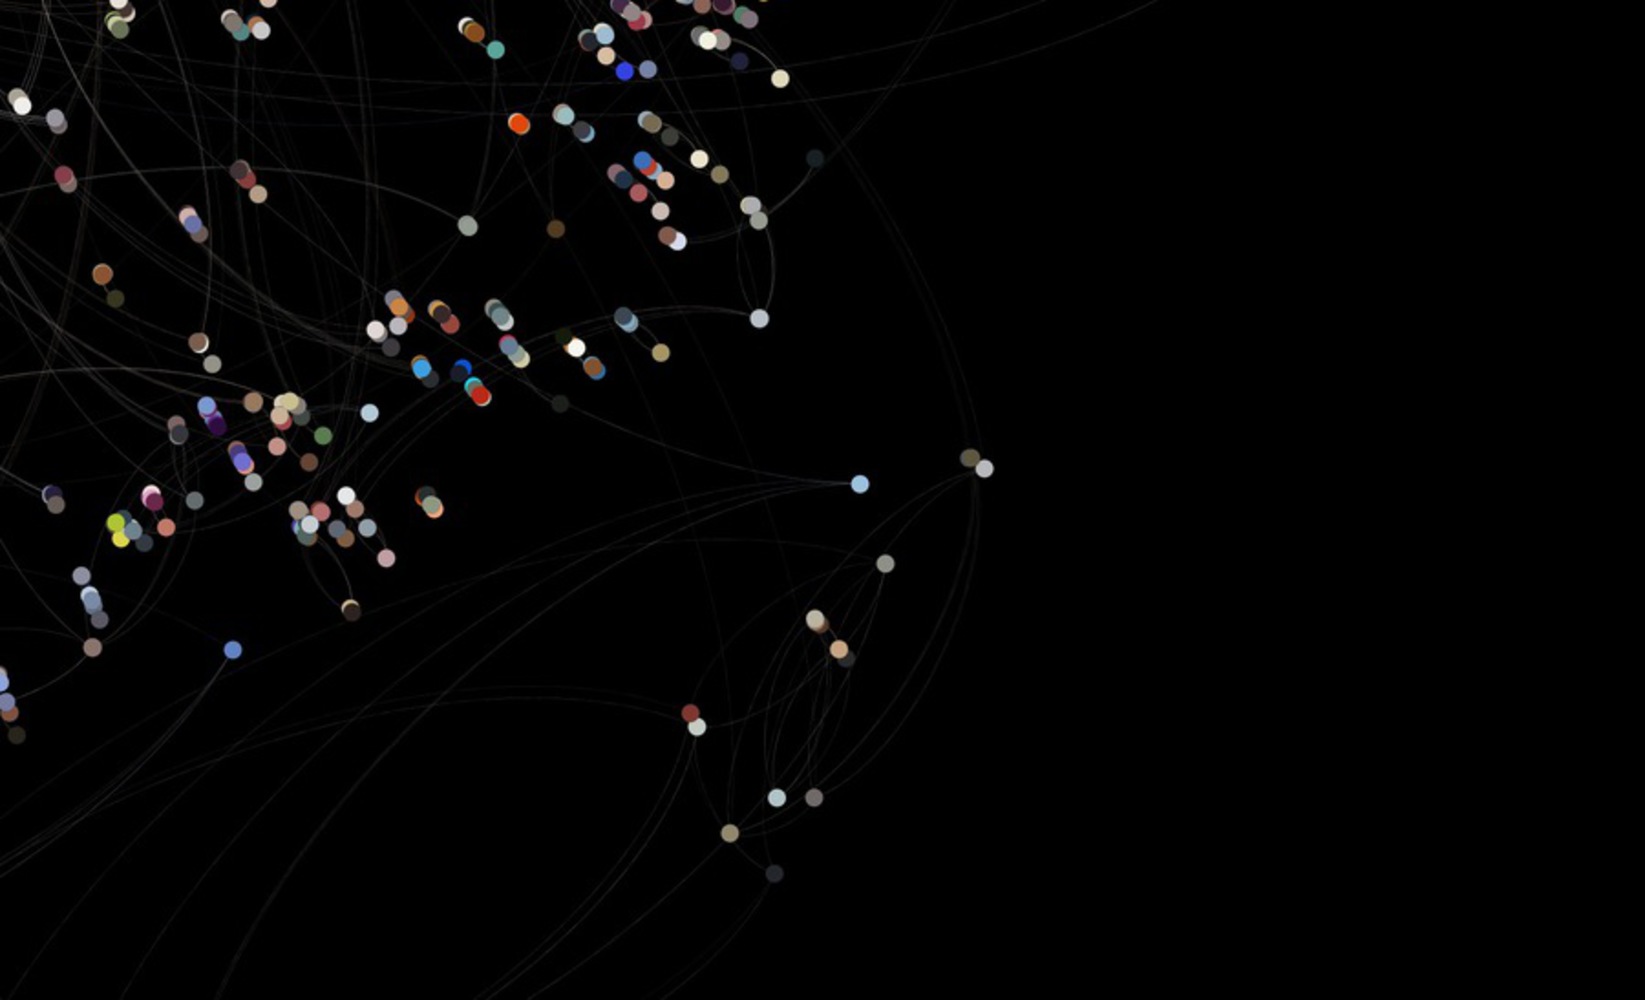
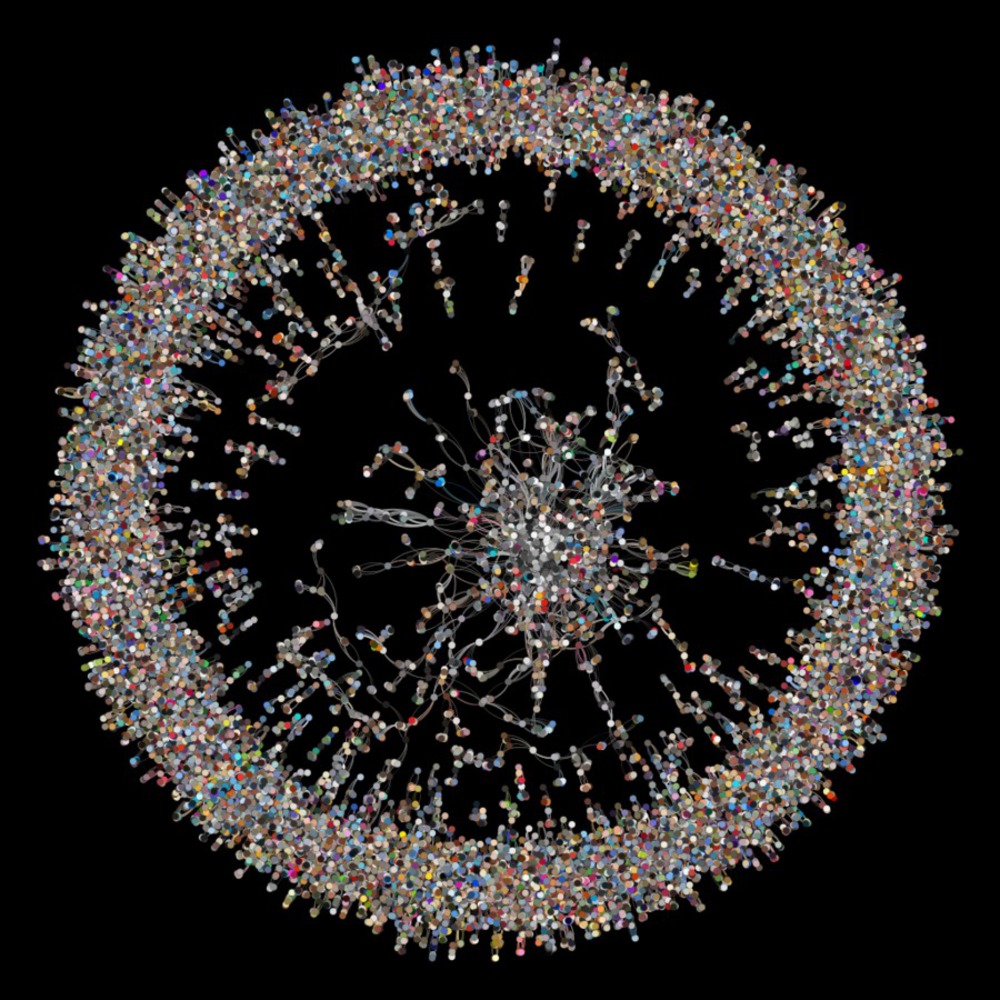
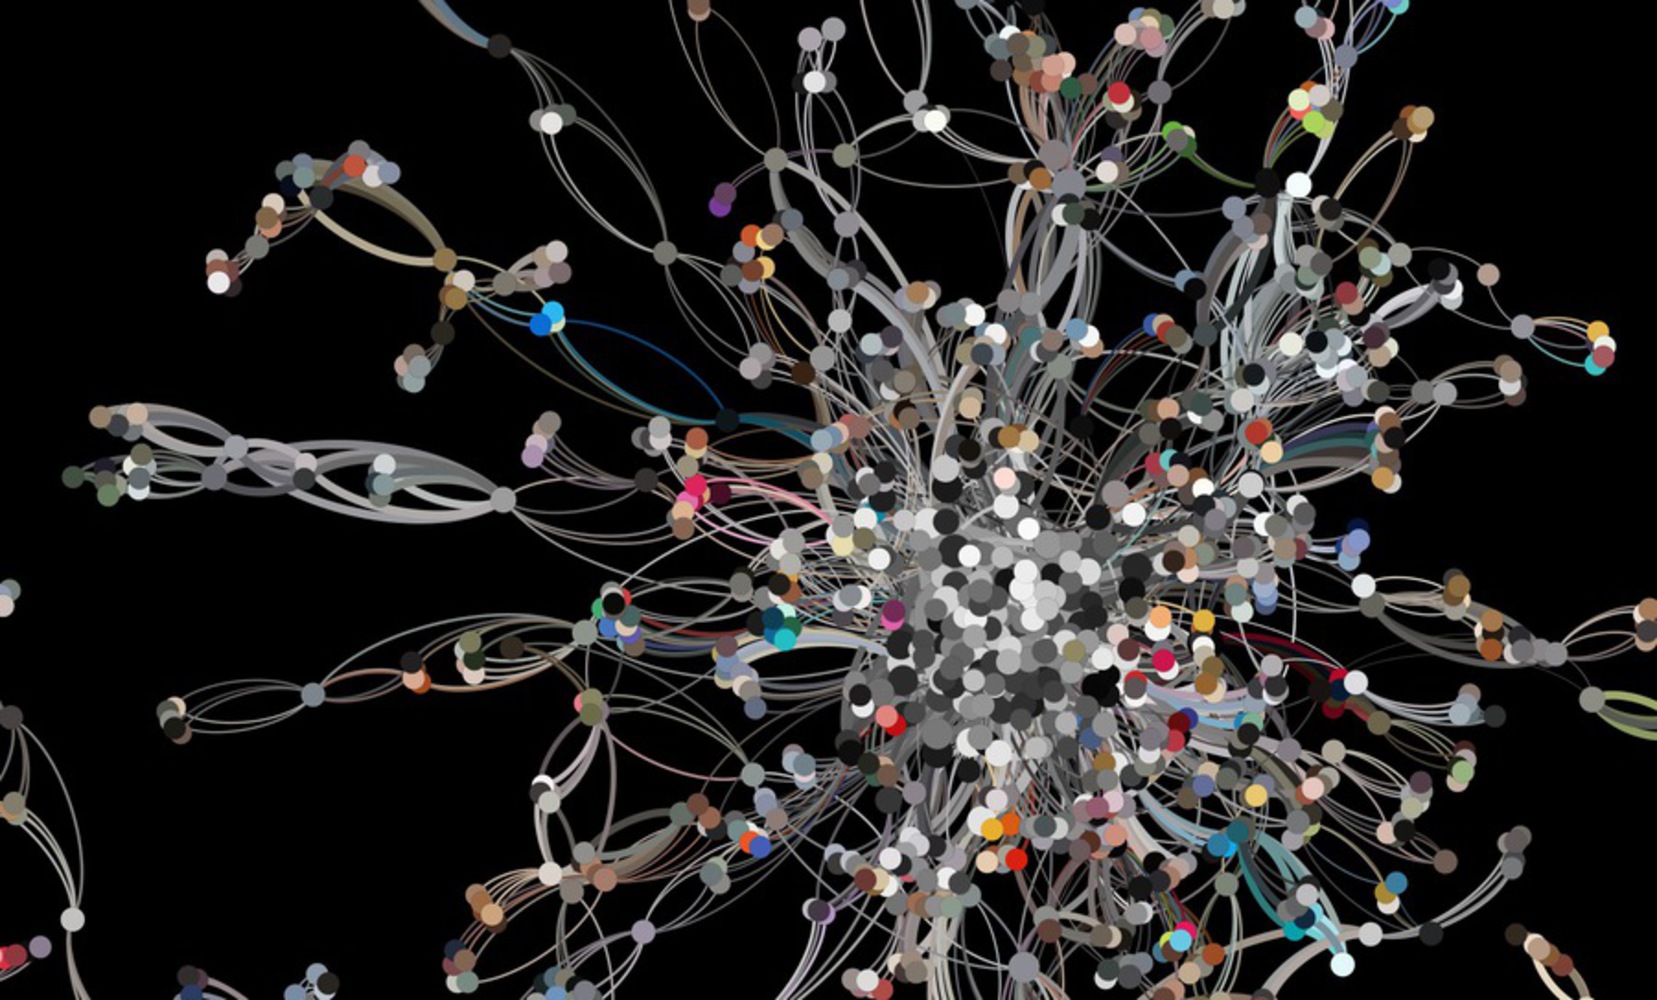
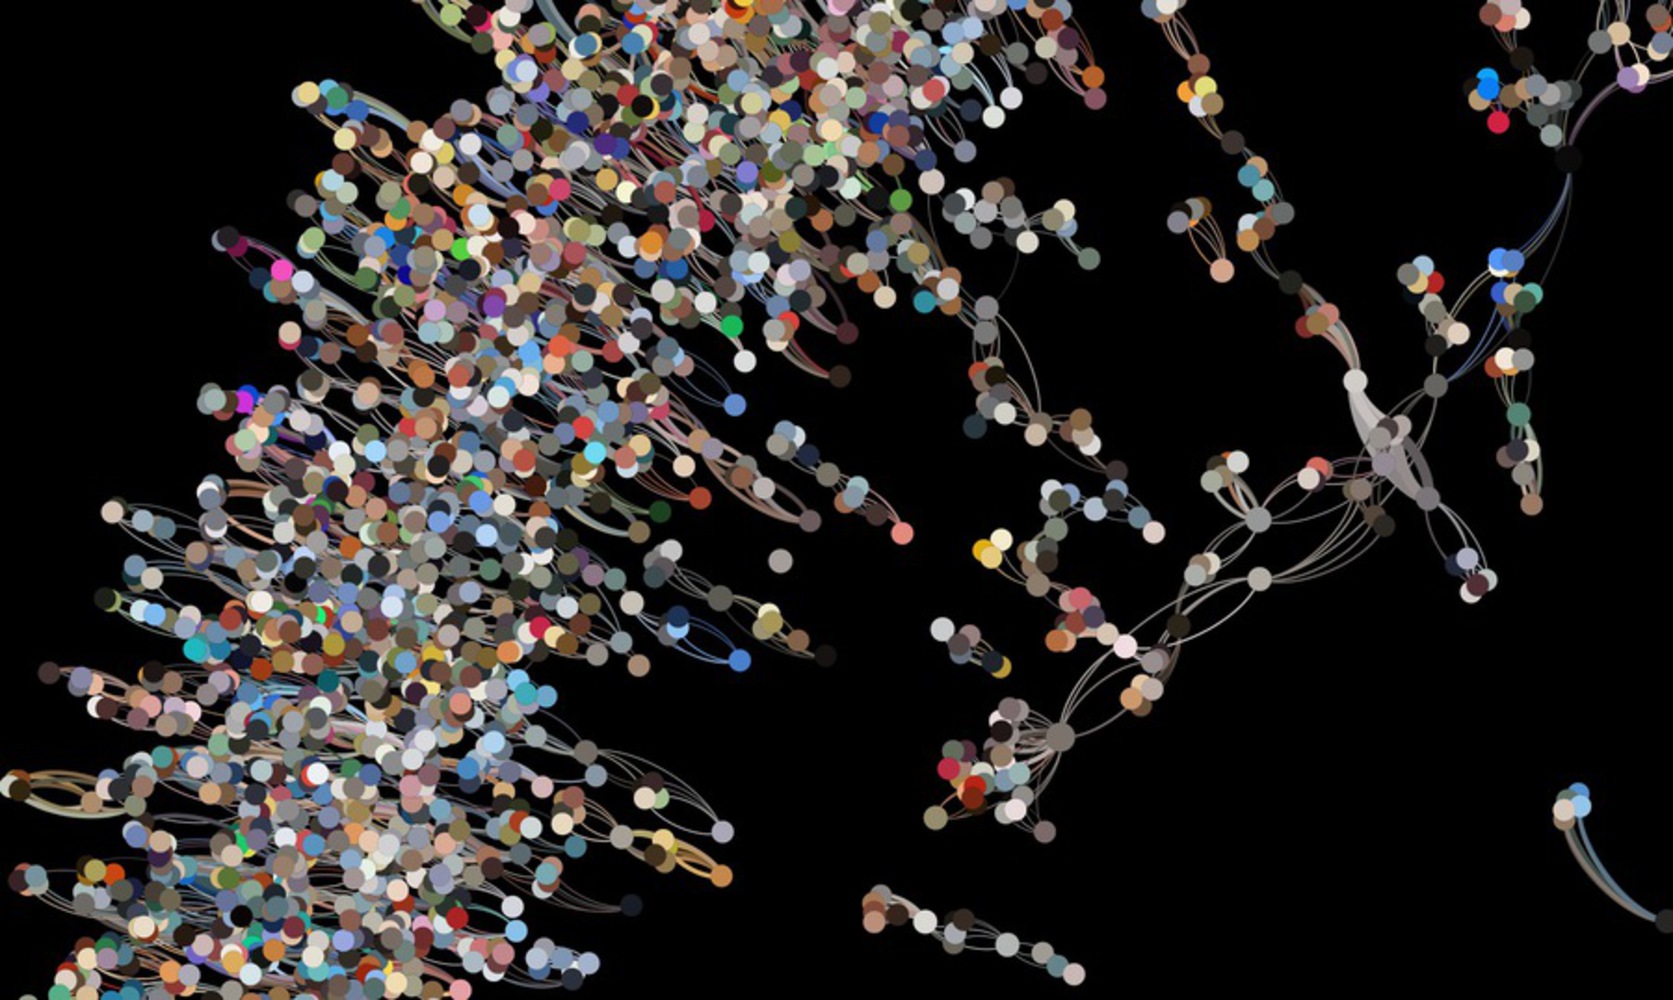
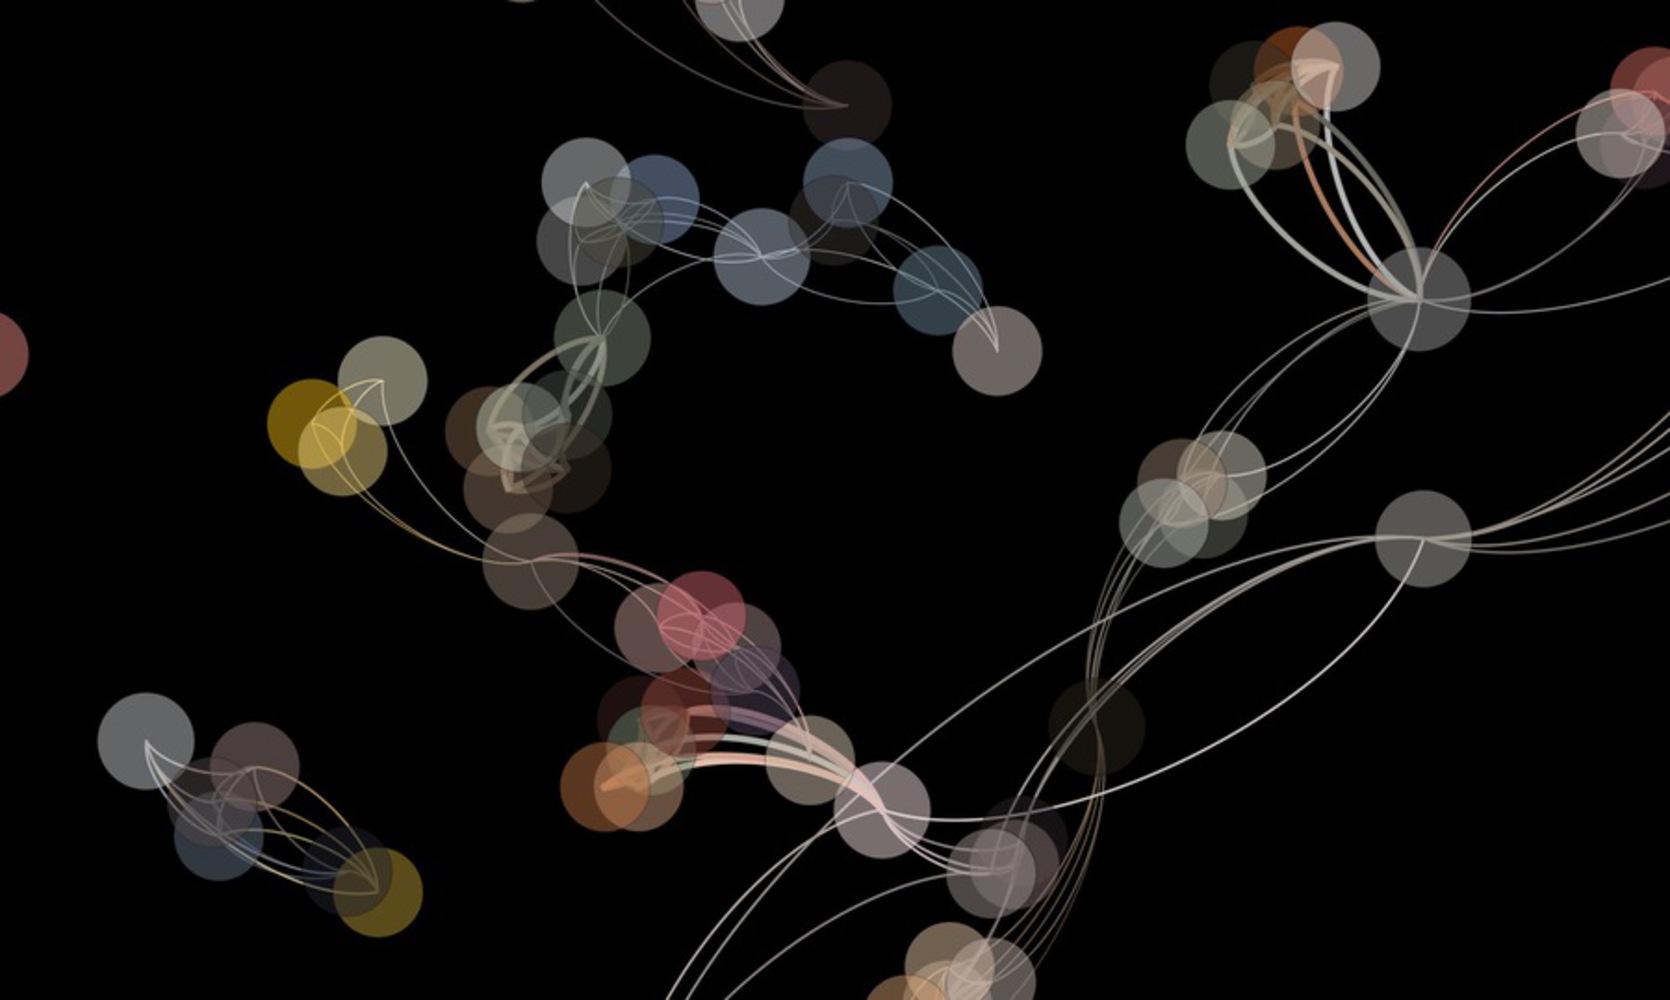
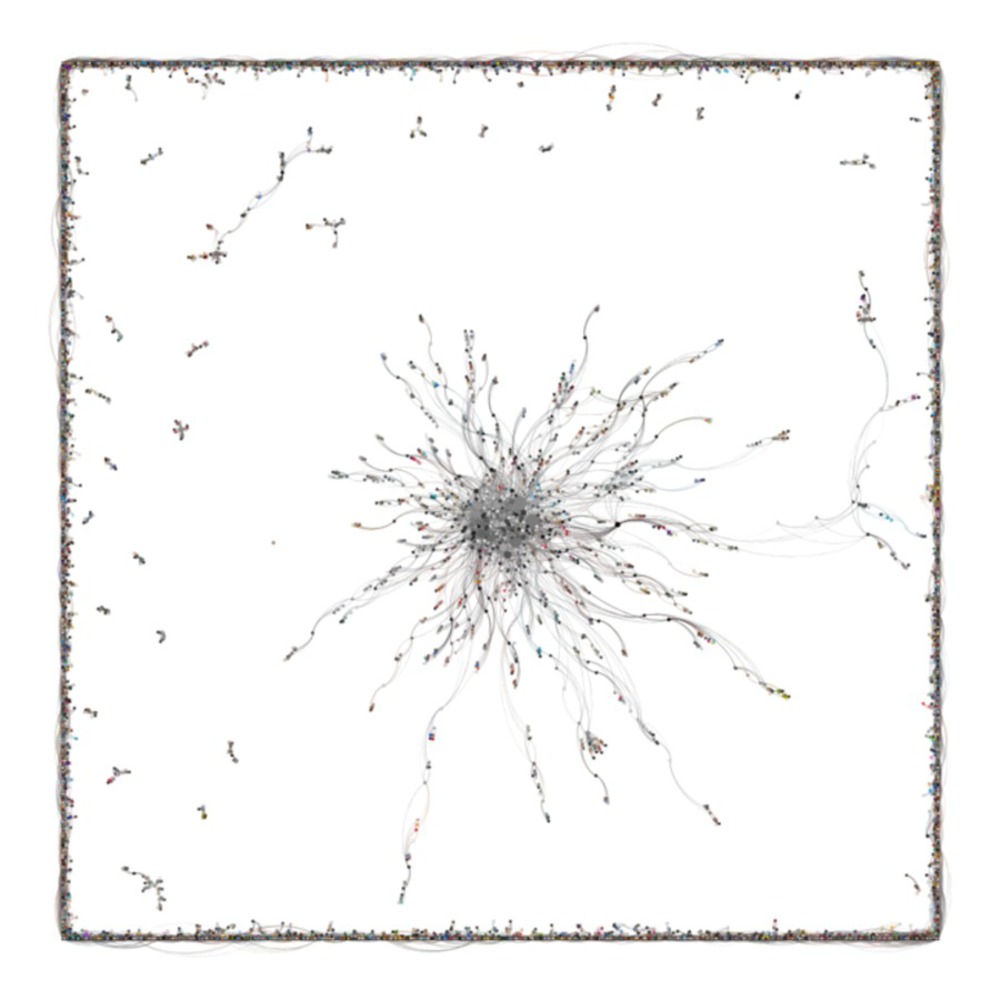
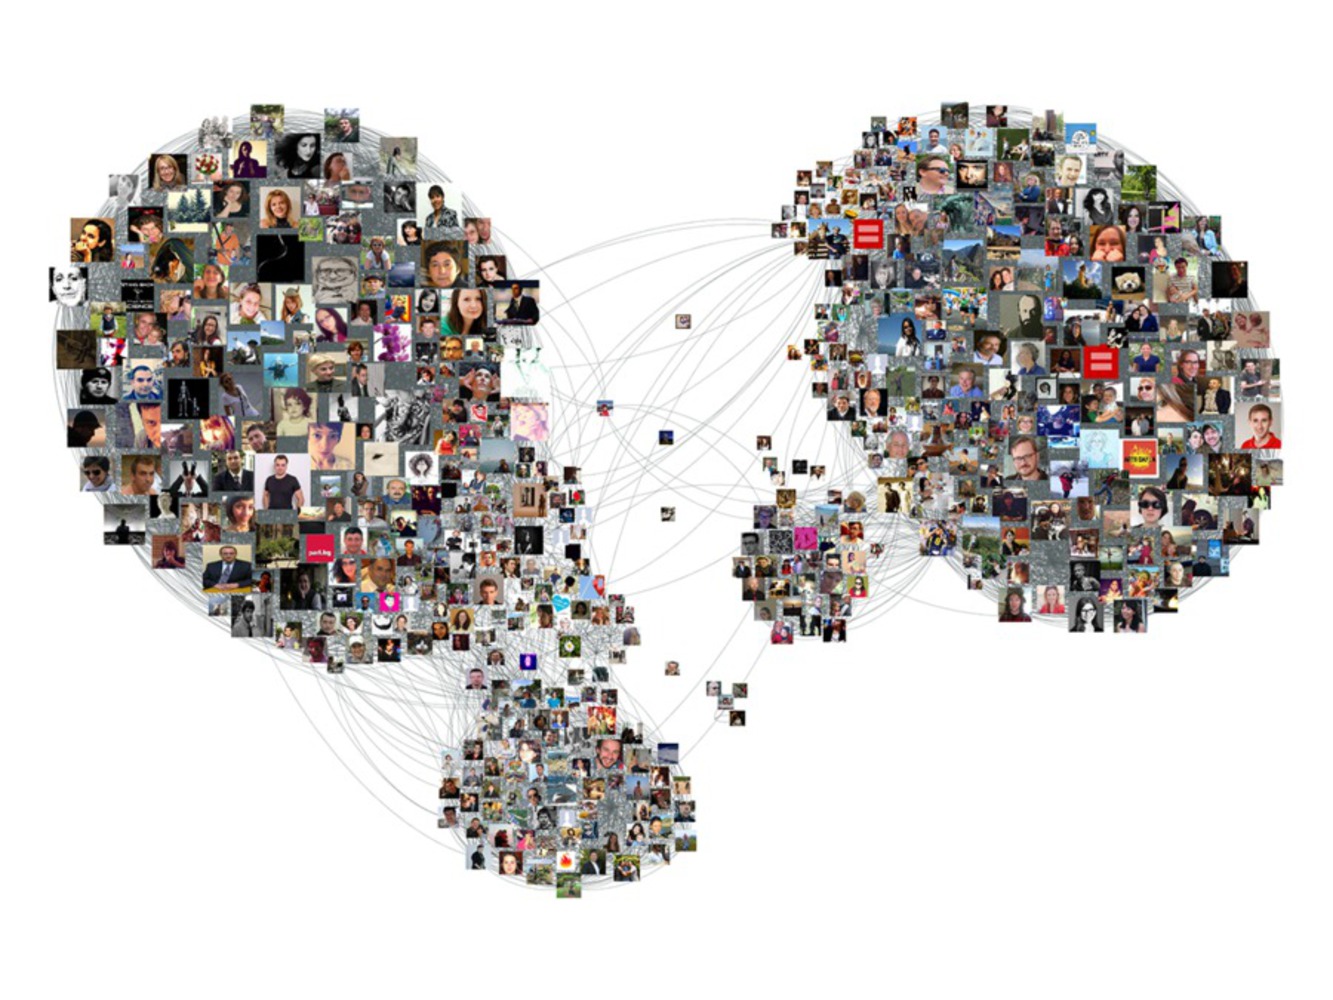
Color Network
Made by Chun(Pure) Zheng ·
Made by Chun(Pure) Zheng ·
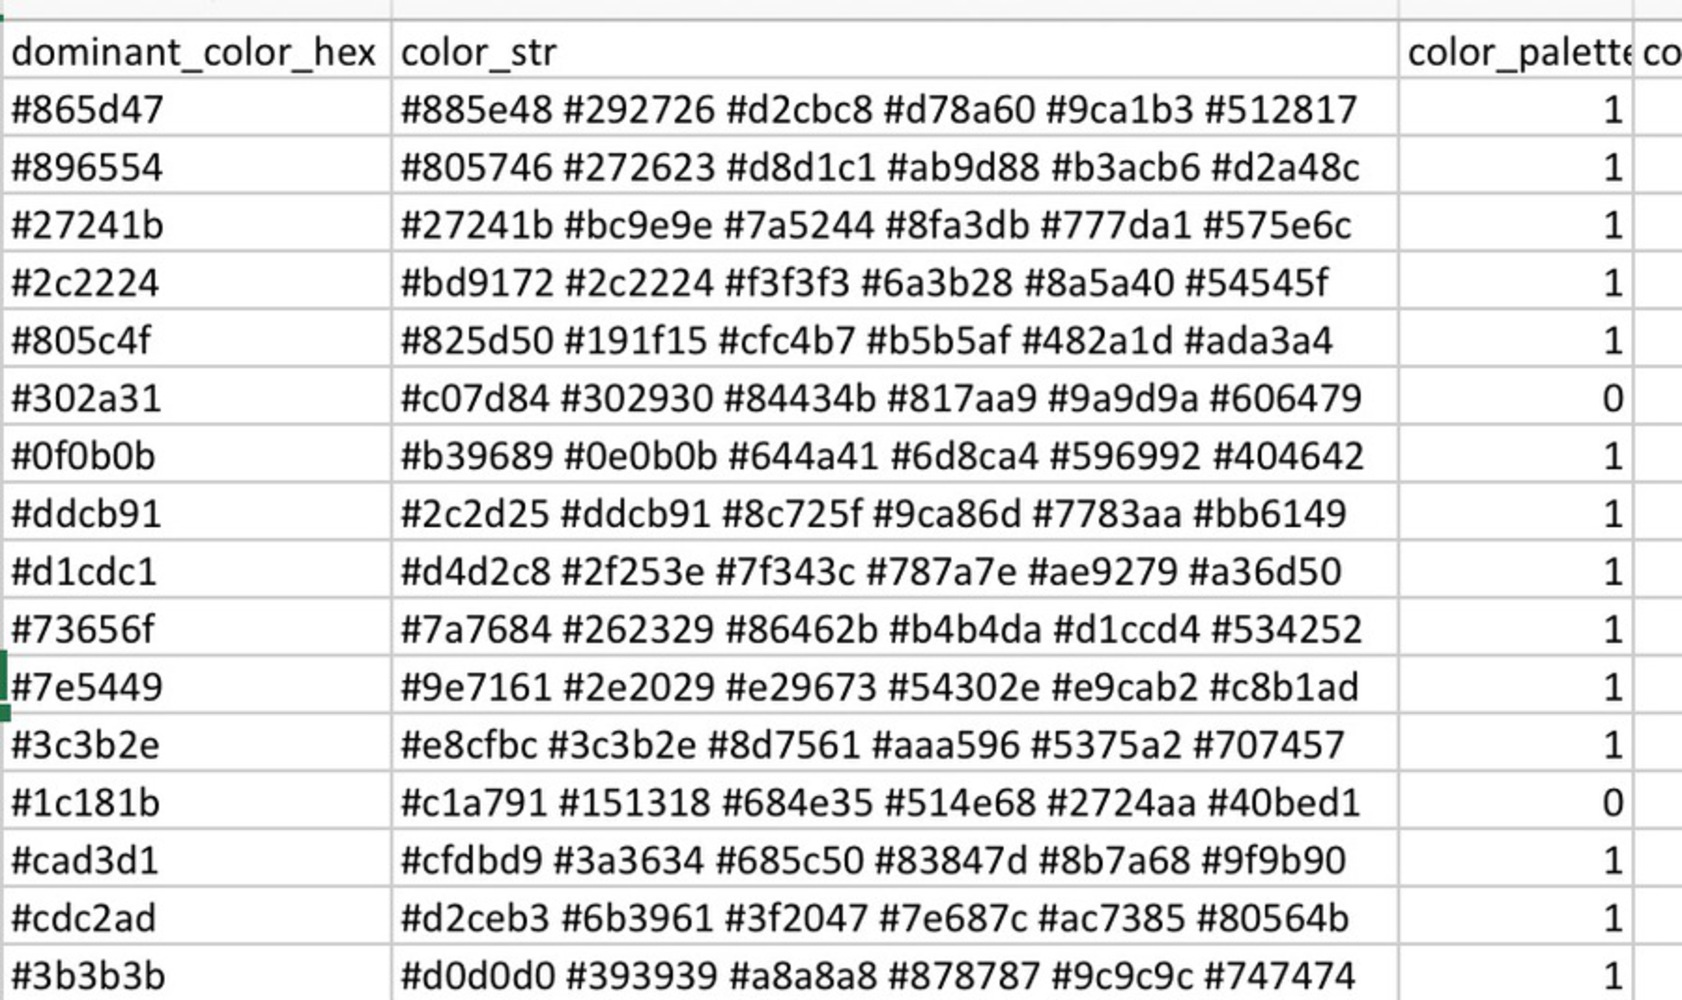
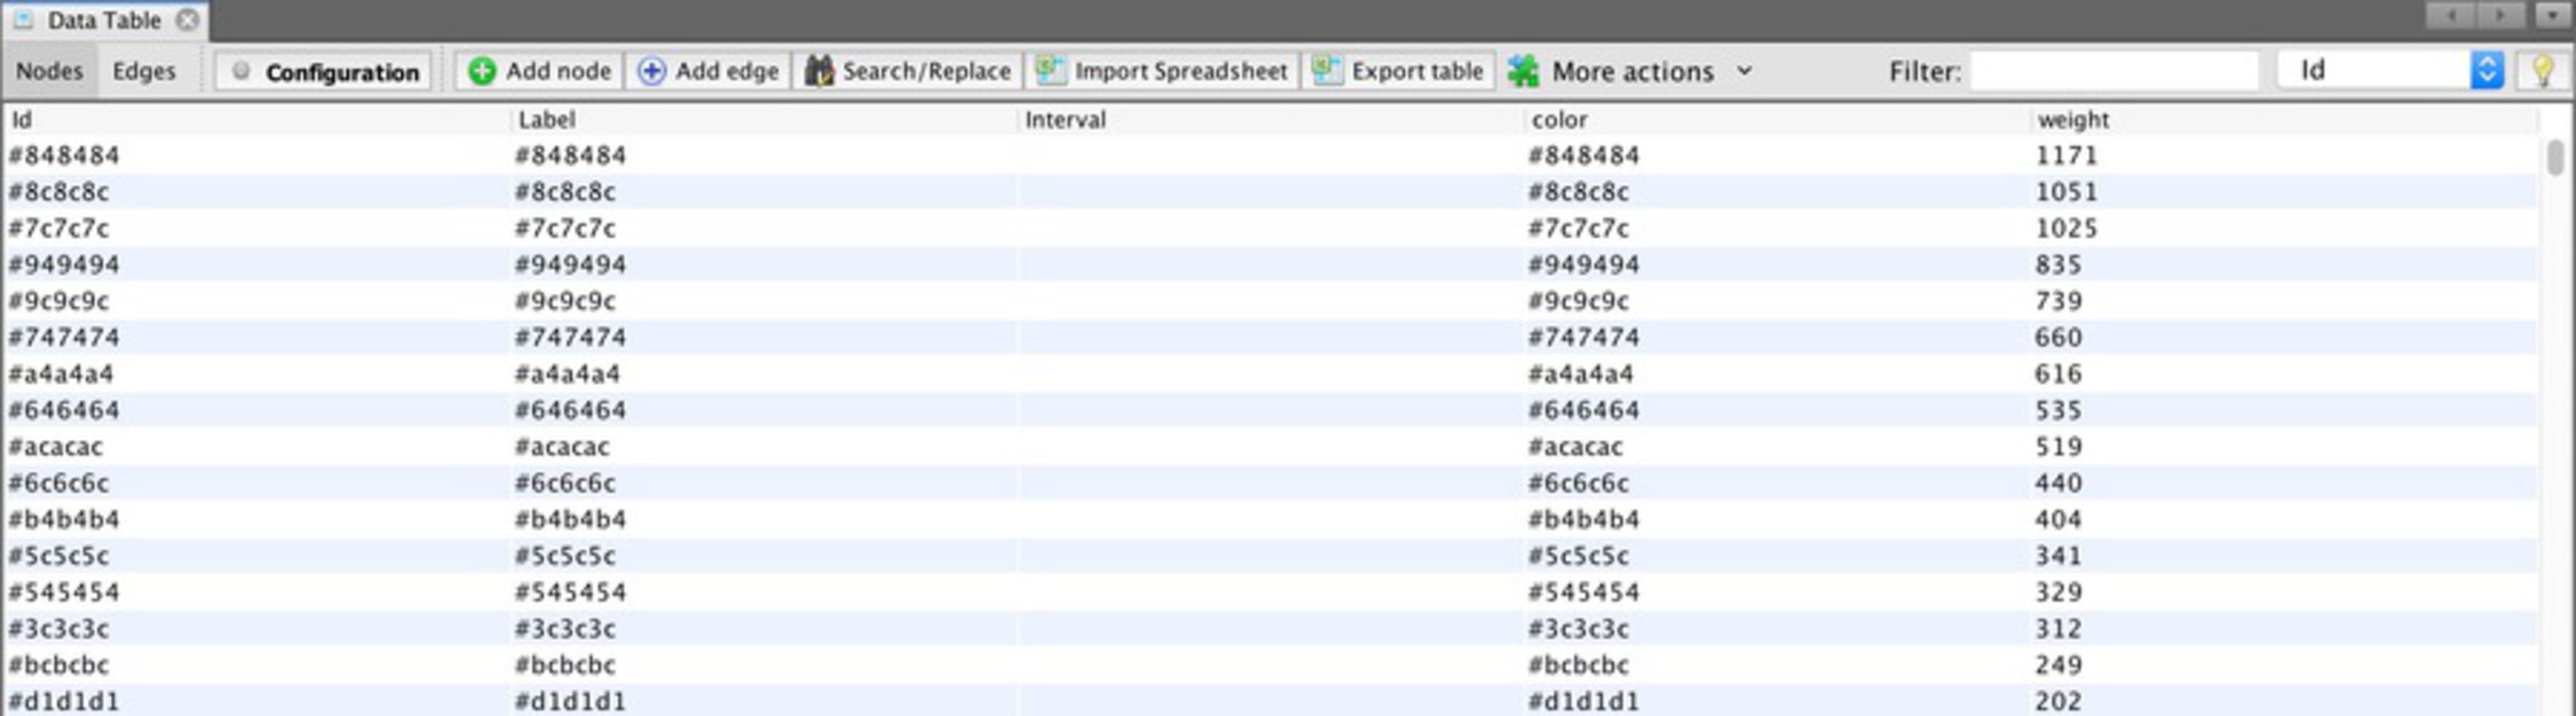
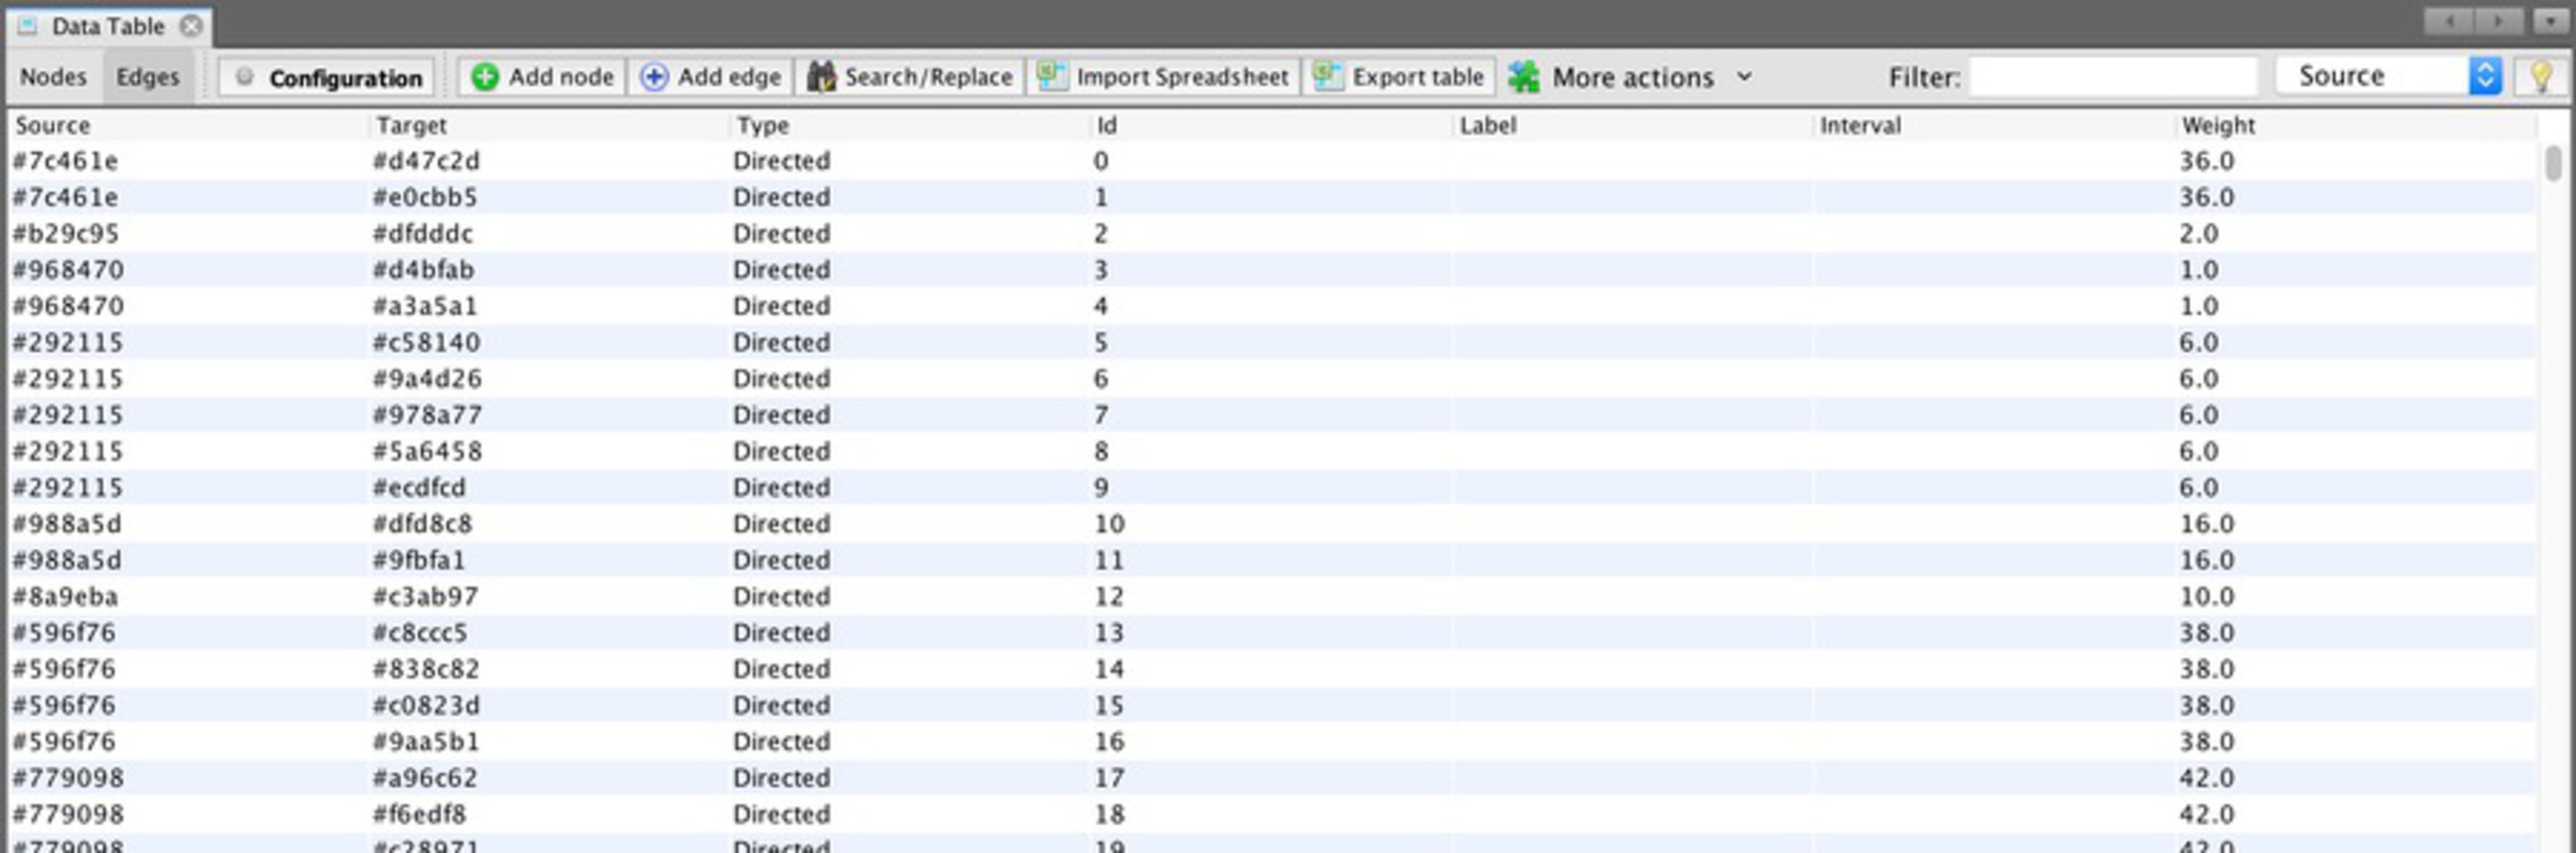
Explore one aspect of the social life of the city (use of space, mood, social interactions, quality of life, experience, texture, etc.) through the online social data sources.
Created: October 29th, 2017
This project is only accessible by signed in users. Be considerate and think twice before sharing.
Explore one aspect of the social life of the city (use of space, mood, social interactions, quality of life, experience, texture, etc.) through the online social data sources.