Sentiment Patterns of Pittsburgh

Made by Yidan Gong

To analyze the sentiment changes in Pittsburgh in terms of time and spatial location.

Created: October 29th, 2017

0

Motivation

Is emotion influenced by where you are and what time you are being at? As I feel I usually feel more emotional during the night than day and feel relaxed at home than school. I am wondering how this experience shared by people in Pittsburgh in different areas.

0

Data Set

To explore this idea, I took a look at the sentiments of Twitter of Pittsburgh from 9th- 22nd Oct 2017 in terms of locations and day-by-day time period. 

0

Process

First, with Daragh's help of extracting the sentiments polarity of all posts from the twitters with the information of time and location.

And then I got the congregation of sentiments in grids of 700 ft by 700 ft to get an overall pattern of the sentiments in Pittsburgh.

0

Visualization

Start from having an overall view of the congregation of sentiment for 13 days and analyze it by colors. Orange shows more positive, while blue is more negative. It is interesting to see that there is an obvious pattern of different sentiments. The hill area and north side are relatively negative compared to the other areas. And the Westend area is much positive.

0

Zoom in to the neighborhood scale, the patterns of the sentiment correspond to the boundaries of neighborhoods to some extent.  For instance, the cluster of Squirrel Hill, Shadyside and Greenfield have a higher sentiment, while Strip District and Polish Hill have a lower sentiment. 

0

In Squirrel Hill, the pattern seems to correspond to land use. Along Murray where commercial and retails congregate, the sentiment level is relatively higher than the surrounding residential areas. 

0

Animated patterns of sentiment in terms of day-by-day

0

Insights

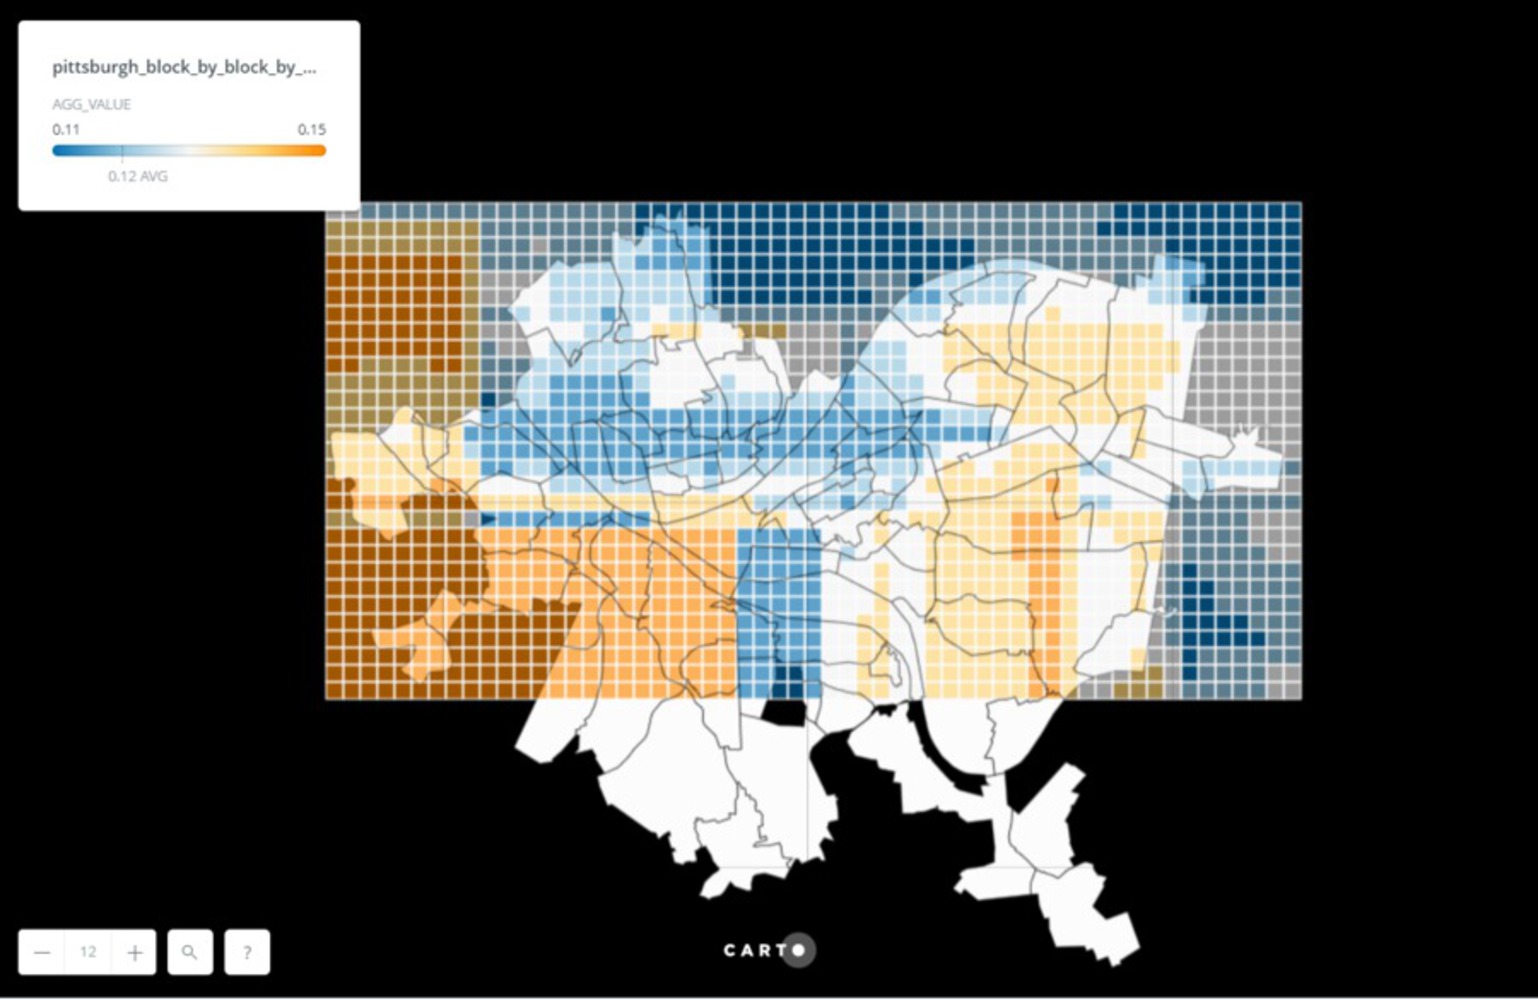
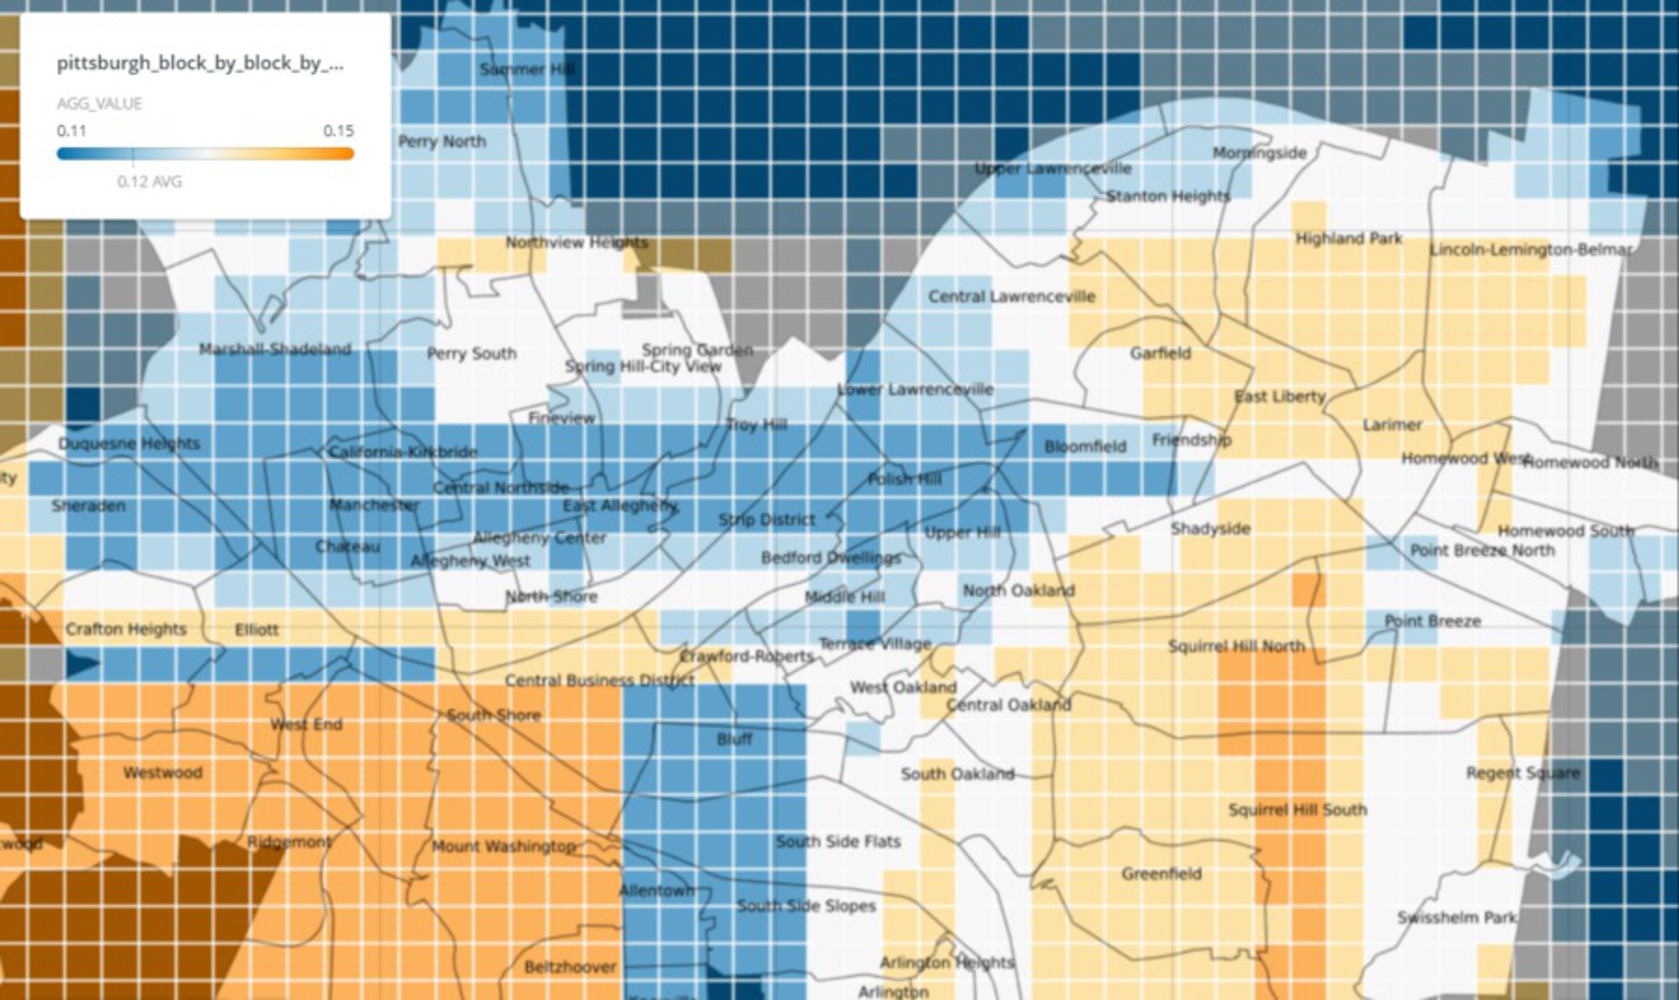
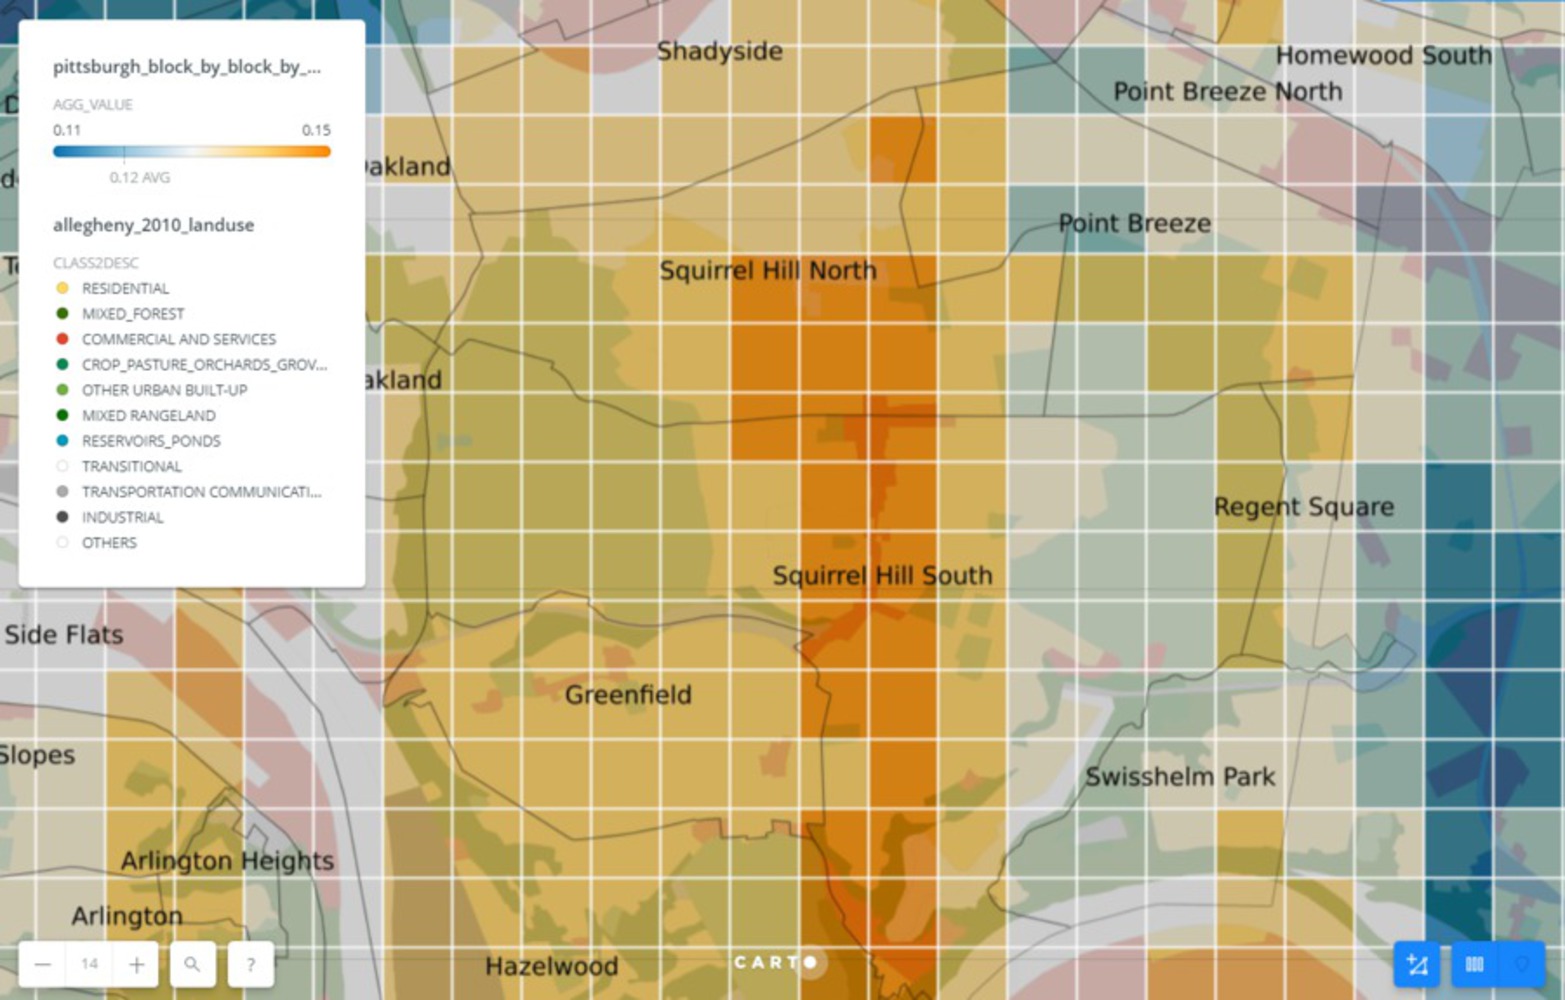
It is interesting to see that the sentiments of posts from Twitter reveals patterns geographically and correlate to neighborhood boundaries to some extent. And it will be meaningful and more in-depth to discover what could affect the sentiments in certain areas, such as land use, types of retails, income level, etc., which might give us a better understanding of the relationship between emotions and space. 

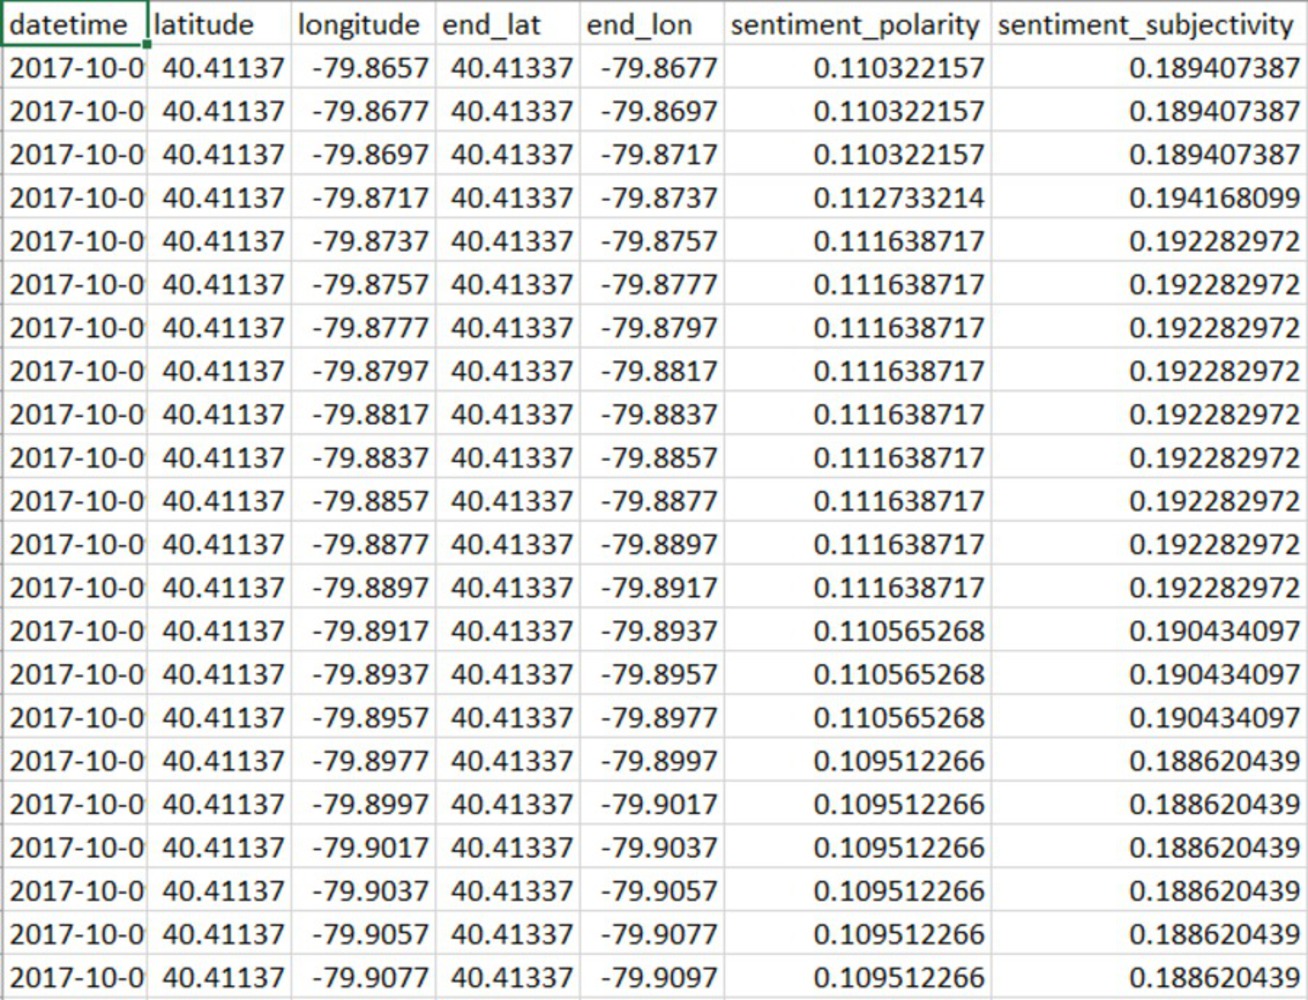
Right now, I animated the emotion day by day, however, the pattern is not clear and quite weird. If I do the analysis again, I would like to analyze several single days in terms of hour and see what could be the changes of patterns from day to night. 

x
Share this Project


About

To analyze the sentiment changes in Pittsburgh in terms of time and spatial location.