Social Steelers fans
Made by Ernest Bellamy
Made by Ernest Bellamy
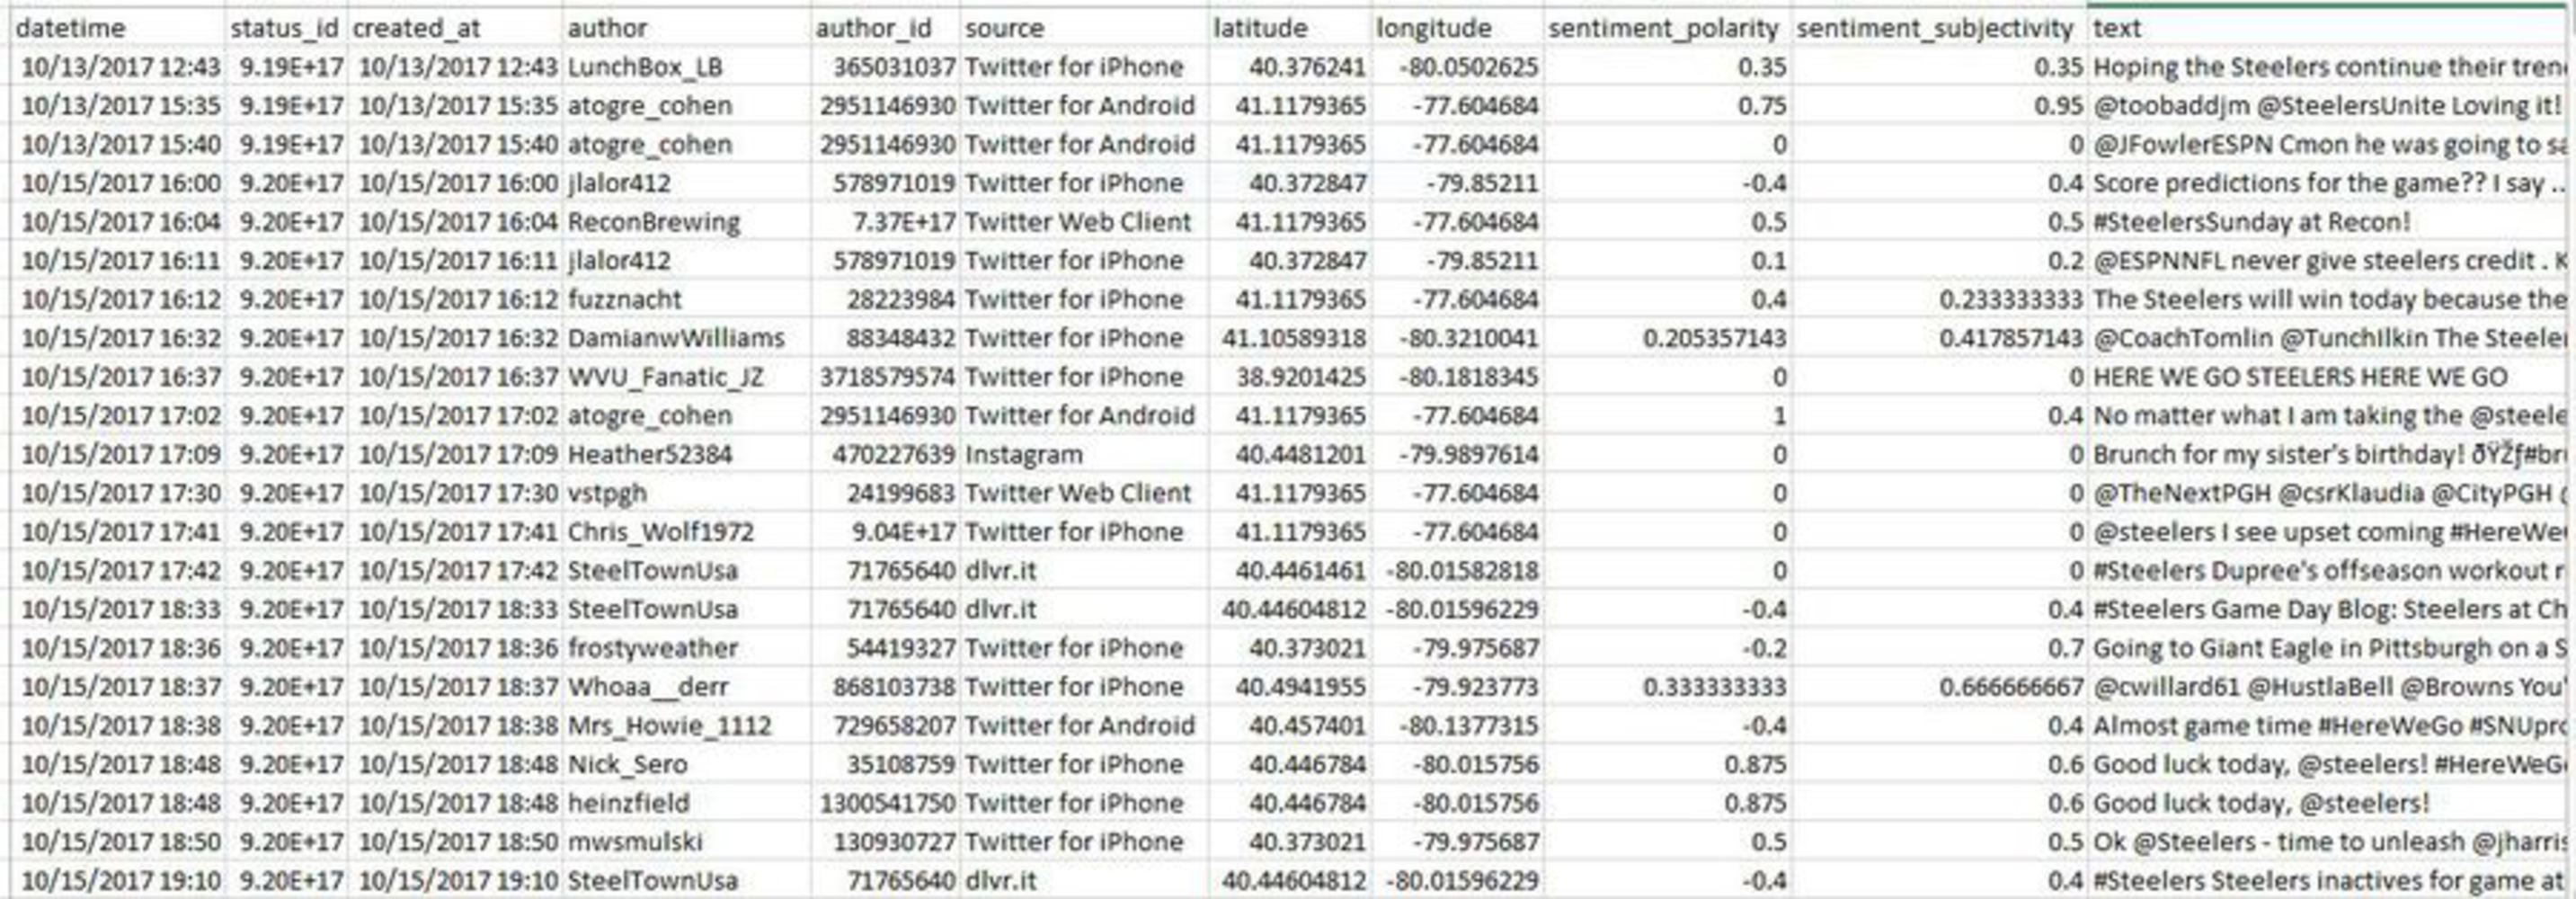
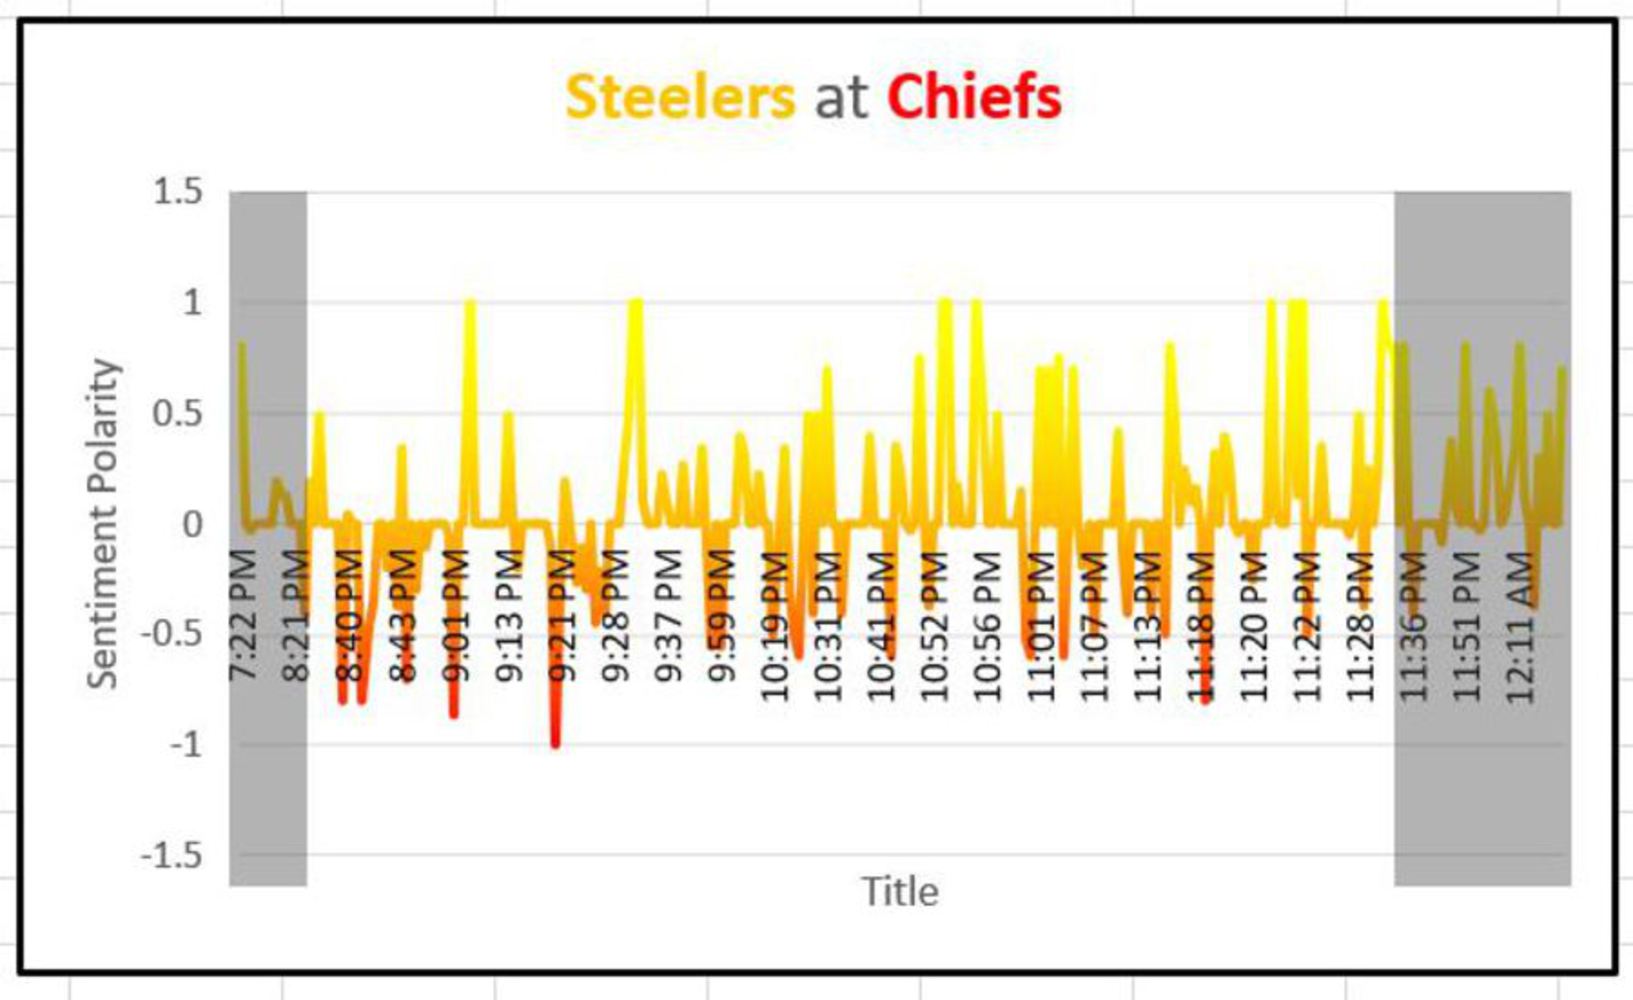
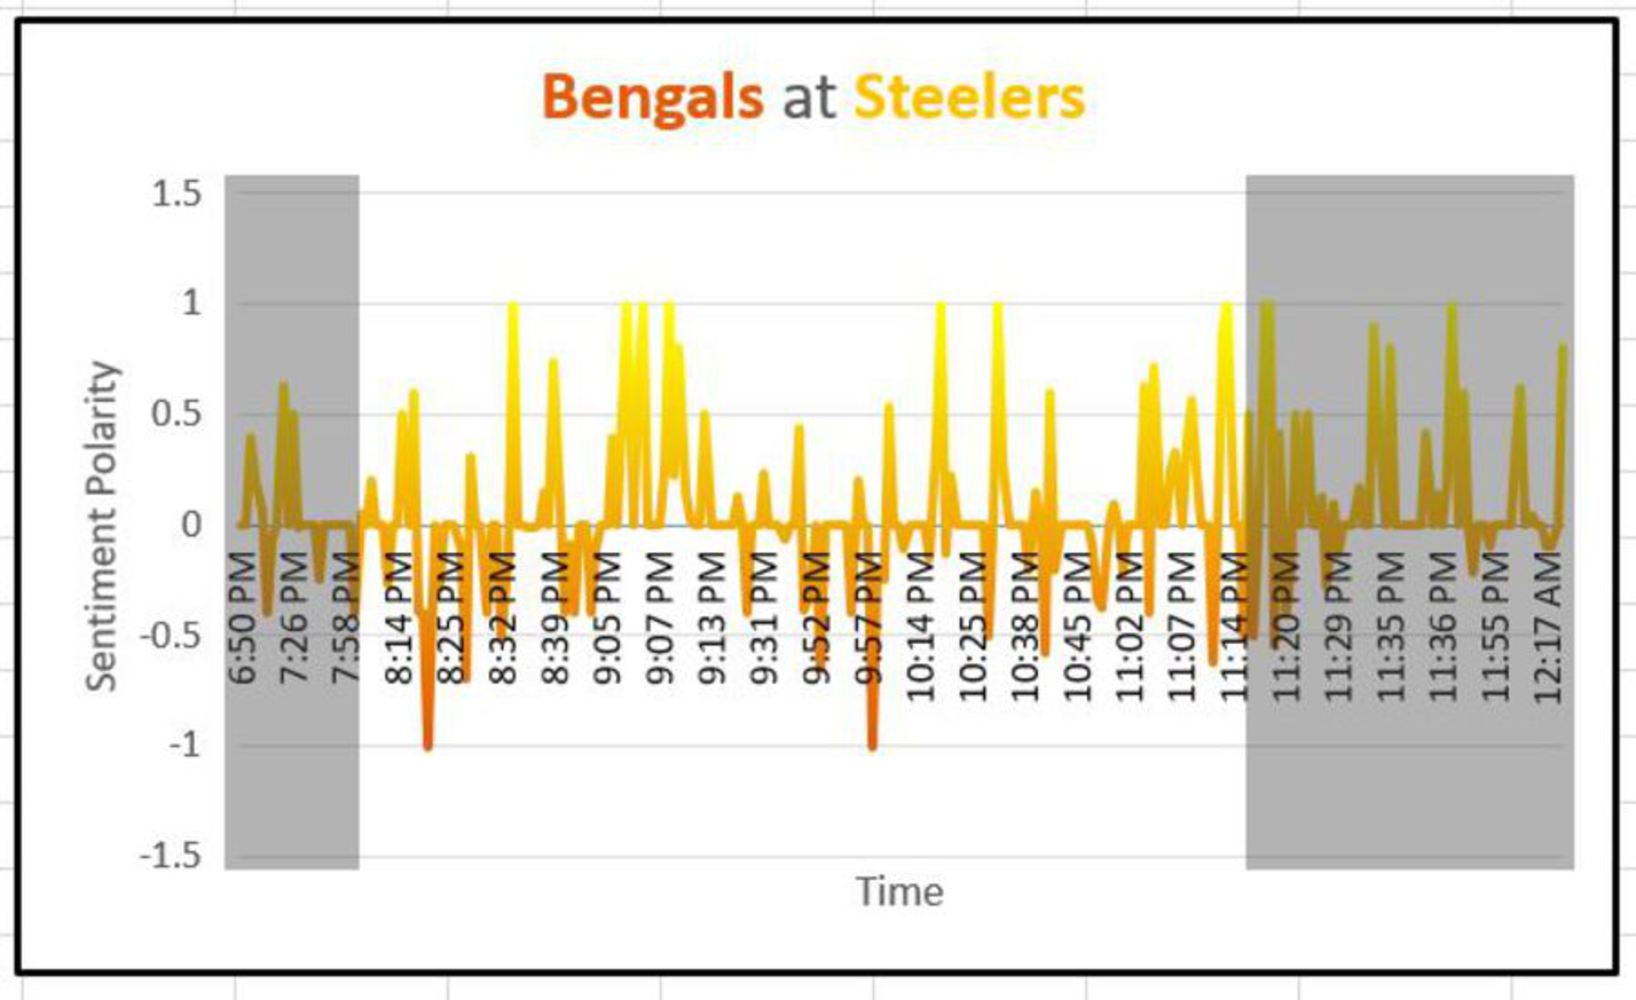
Reflect by tweets where the most avid Steelers fans are located throughout a 10 day period, as well as reflect the sentiment of tweets during two game days.
Created: October 30th, 2017
Reflect by tweets where the most avid Steelers fans are located throughout a 10 day period, as well as reflect the sentiment of tweets during two game days.