Weekend Rides in Correlation with Weather
Made by Yidan Gong ·
Made by Yidan Gong ·
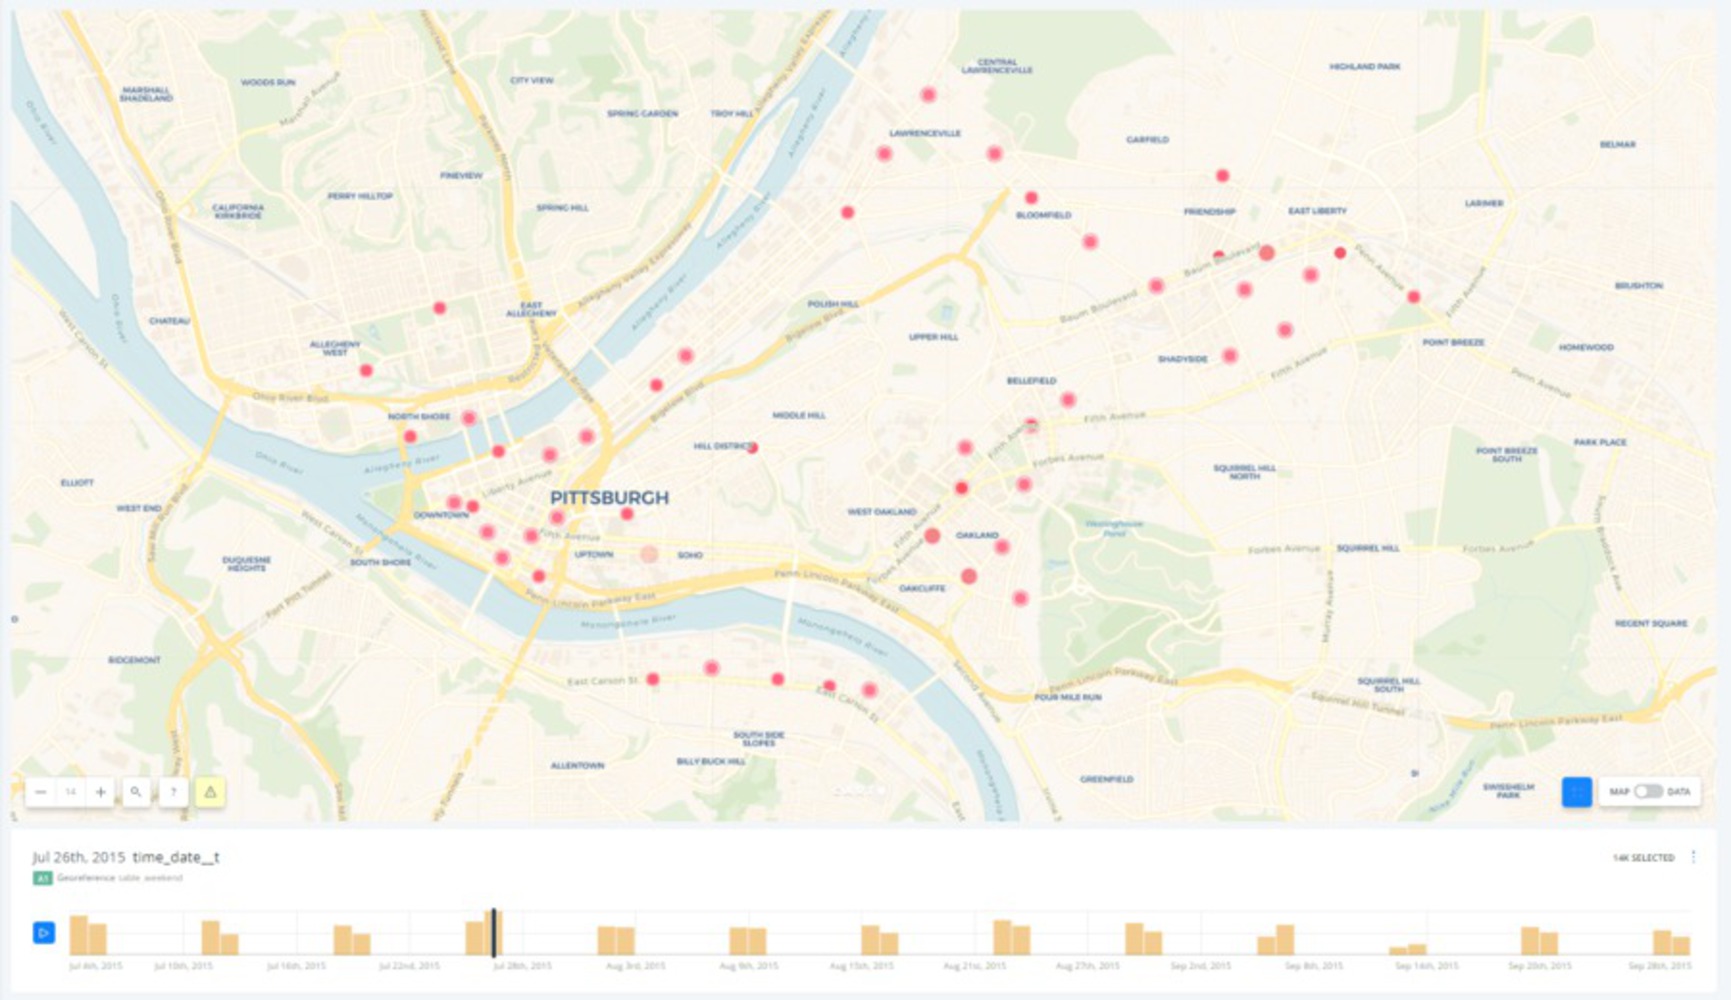
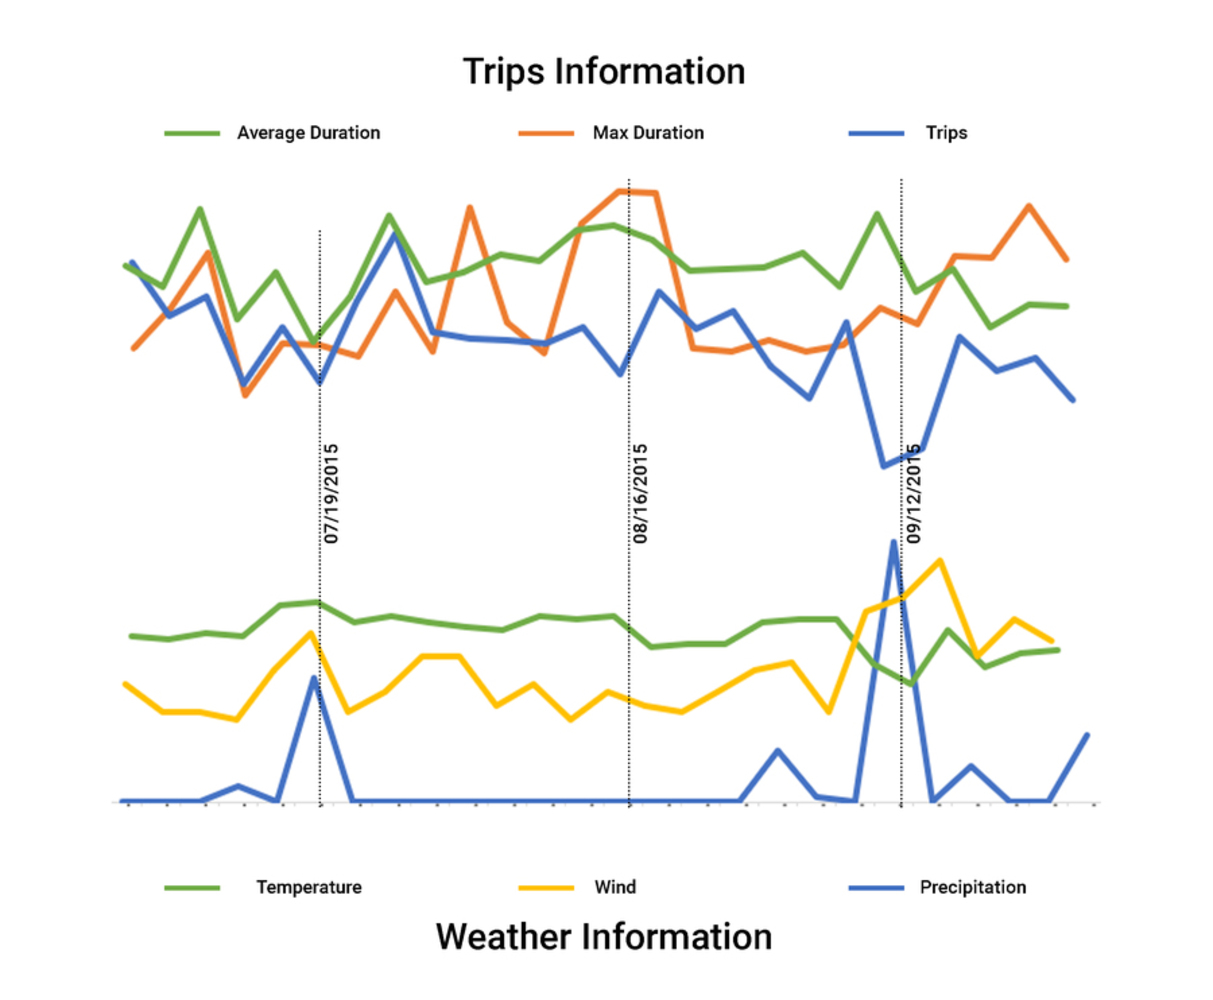
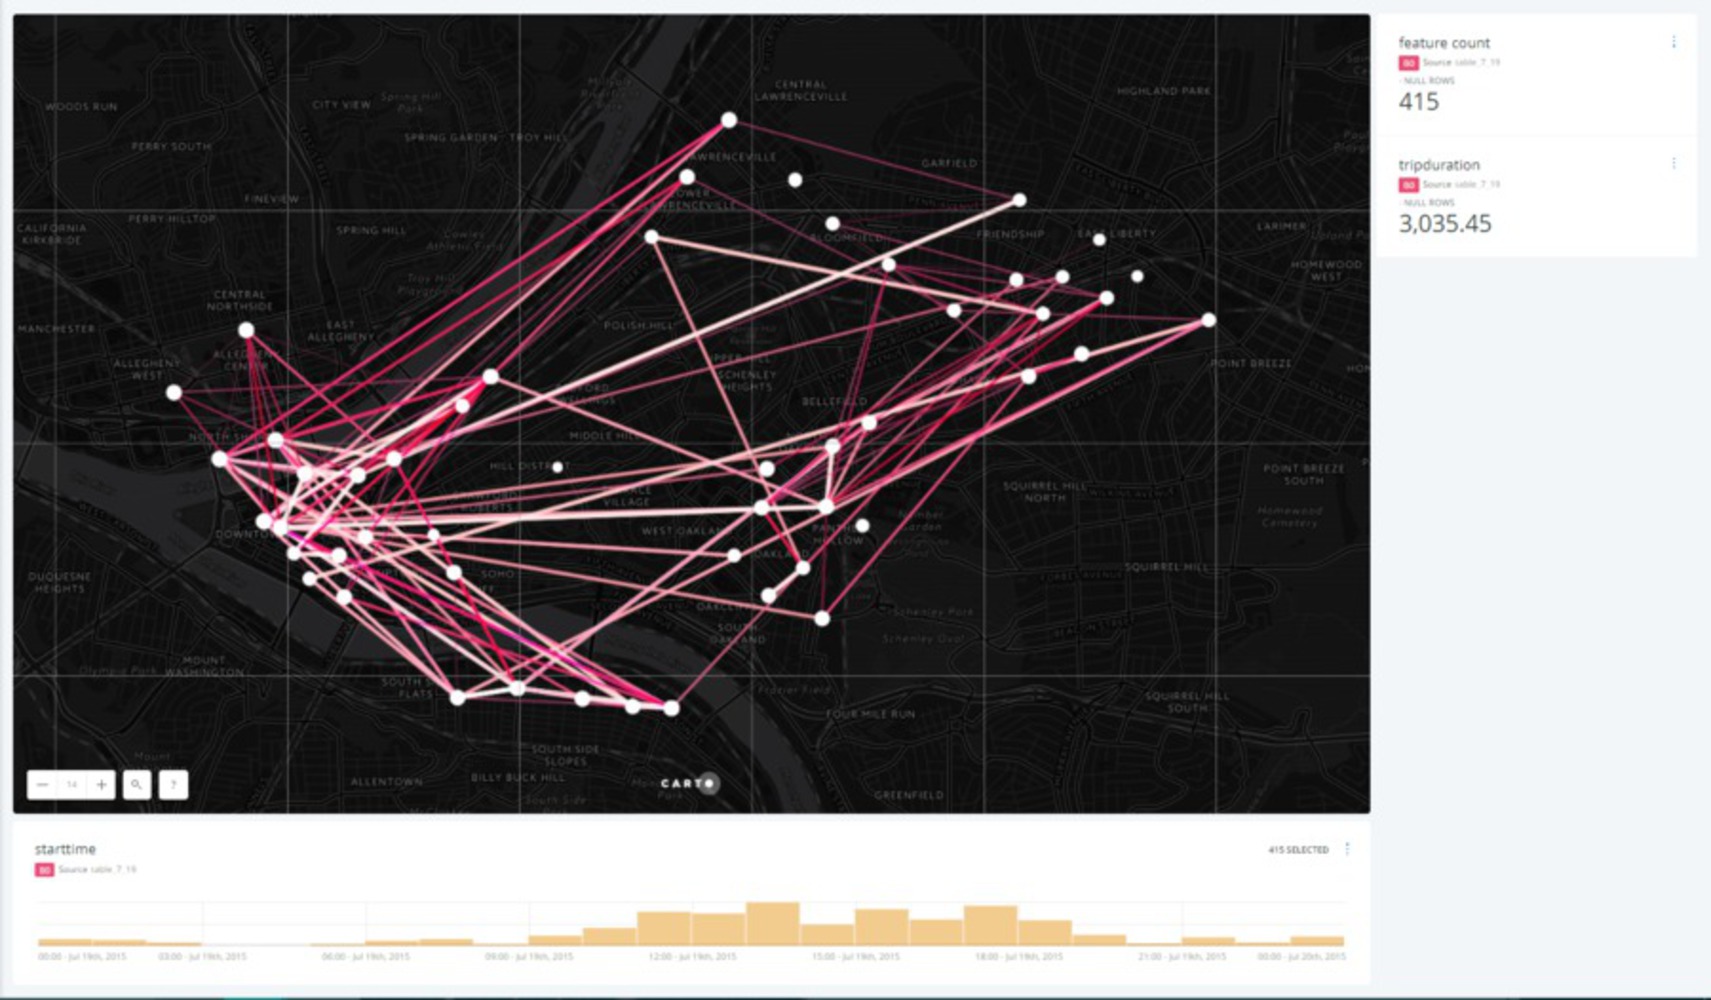
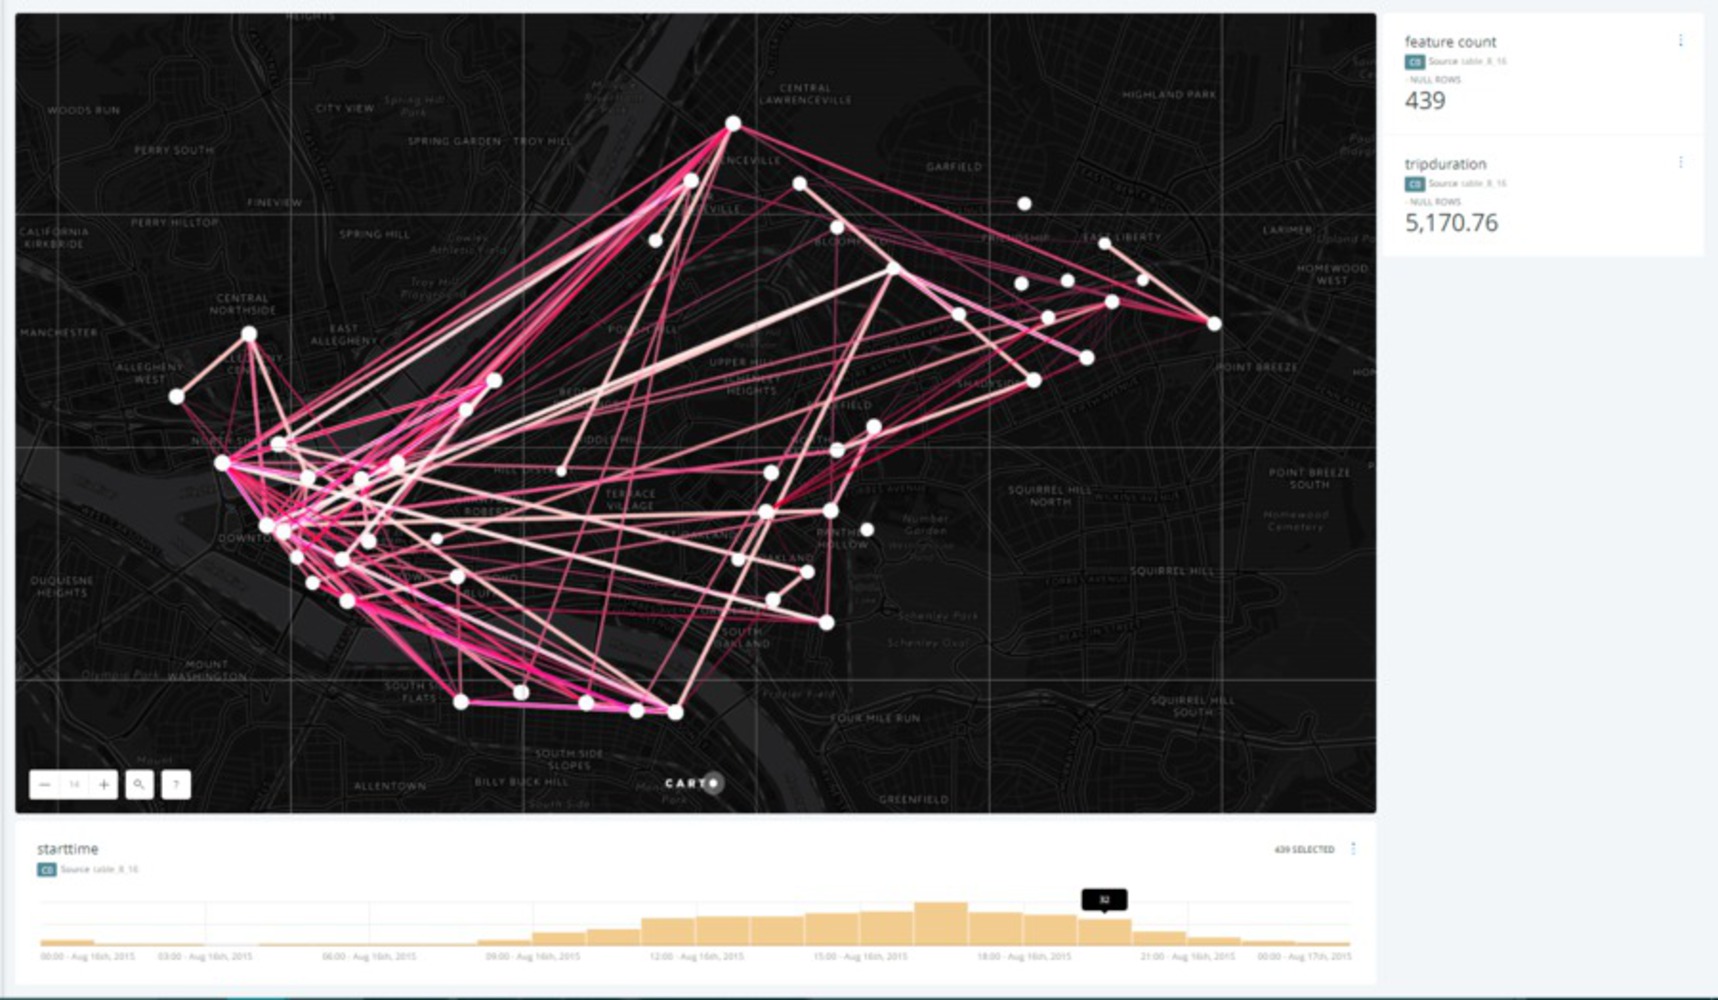
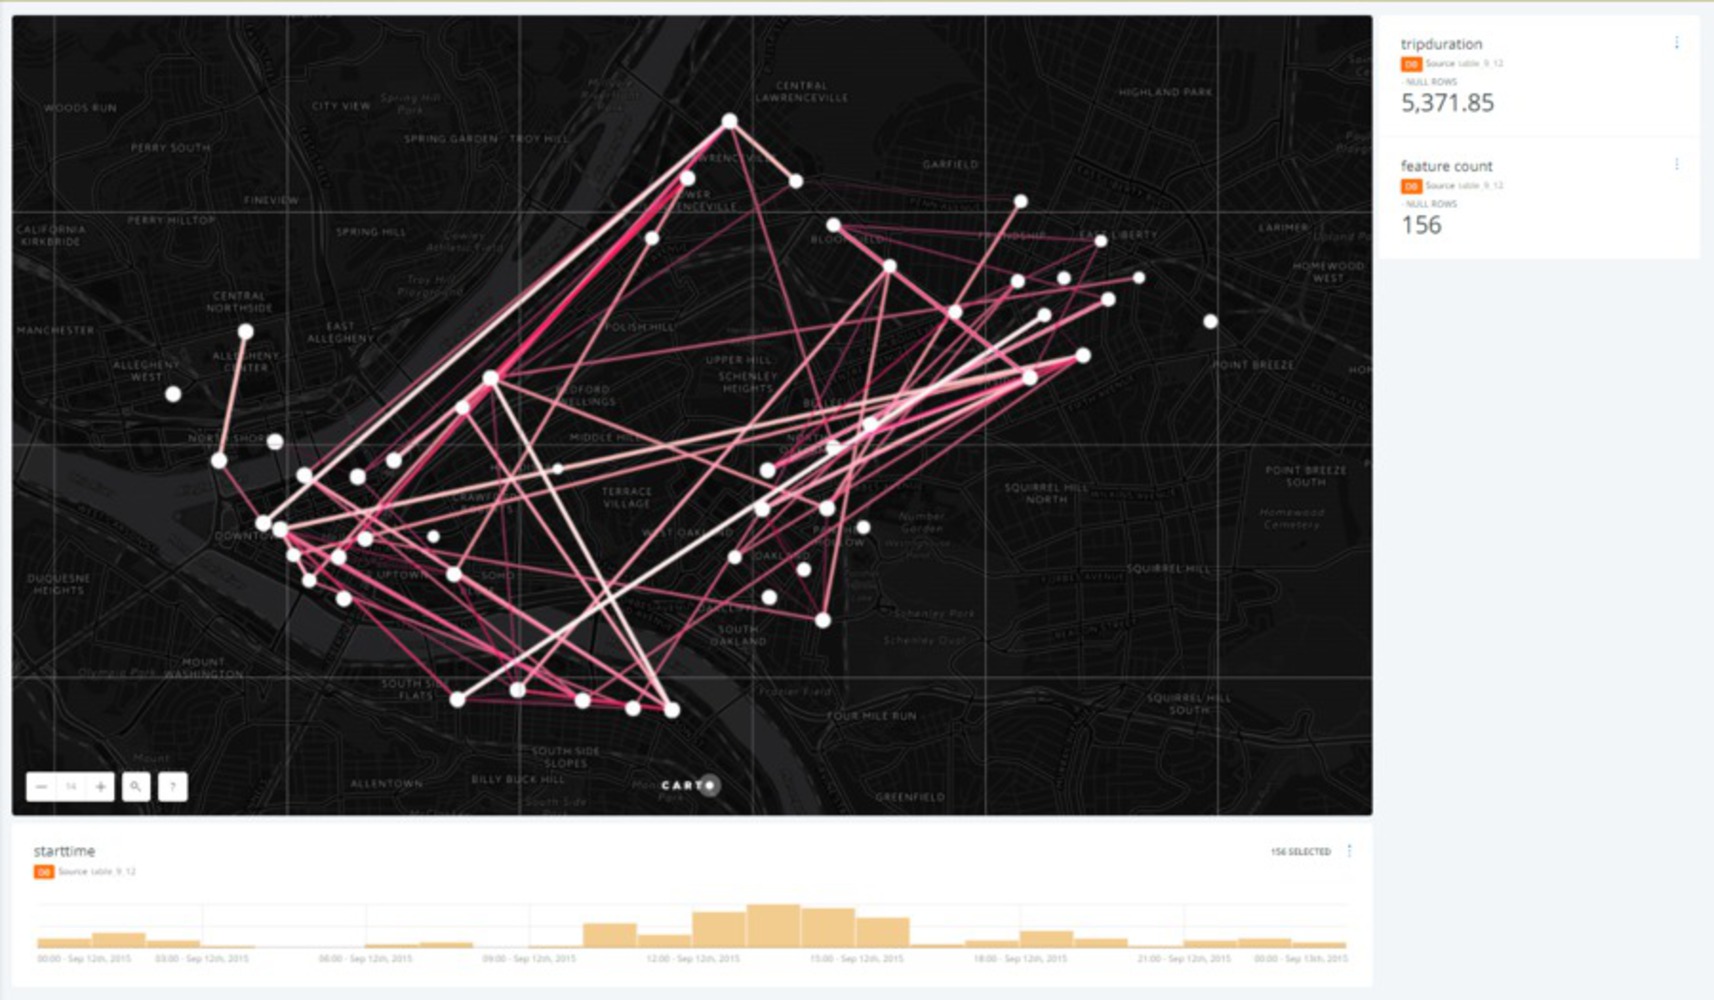
I would like to peel out the information of HealthyBikes Rides in terms of weather and geographic location. To explore whether precipitation, temperature, and wind influence on the usage of HealthyBikes and where to use them.
Created: November 26th, 2017
This project is only accessible by signed in users. Be considerate and think twice before sharing.
I would like to peel out the information of HealthyBikes Rides in terms of weather and geographic location. To explore whether precipitation, temperature, and wind influence on the usage of HealthyBikes and where to use them.