Correlation Corruption

Made by Ricardo Tucker

The purpose of this project is to show that correlation between data points does not necessarily mean the two ideas being compared are actually related.

Created: November 2nd, 2015

0

Product

I created a graph that shows the trends of both deaths in the United States caused by being tangled in bed sheets and deaths caused by people falling down the stairs over 12 years (1999-2010). While the two seem to be completely unrelated events, the correlation coefficient (R^2 value) of the data sets is 0.953074, which suggests that perhaps the two are actually related somehow?

0
Does getting tangled in your bed sheets lead you to fall to your death down stairs? With a correlation of r^2 = 0.953, perhaps it does...
Bed sheets vs falling.thumb
0

Intention

When looking at graphs that contain numerical data, we have always run with the assumption that if the data of the two ideas being compared correlate with each other, then the two must be related. However, in this project, my goal was to make graphs of things that are completely unrelated but coincidentally have similar data trends that would cause them to have high correlation coefficient values.

0

Context

My girlfriend is a Statistics major, and one day she told me how in class her professor mentioned that the correlation coefficient (R^2) between two data sets is effectively pointless to use. When I asked her why, she described essentially the same idea behind this project: you can find data sets that happen to work well together that mathematically say they are "correlated," but logically don't make sense together. This is due to a "confounding variable," a variable that is directly correlated to two other variables that makes them seem like they are related to each other.

0

Process

While looking for potential events to use for this graph, I happened to come across this article about more people dying last year from selfies compared to shark attacks, implying selfies were more dangerous than sharks. This made me want to find two somewhat ridiculous-sounding variables that would seem even odder when compared against each other. Finding data that actually worked together was the hardest part, and it basically consisted of scouring through old Center for Disease Control death rate records (which are all available online, conveniently).

0

Reflection

I think that the outcome of the project was kind of simple, despite all of the time that went into finding correlating data. If I found an easier way to find data that correlated well like this, I would have liked to design a series of graphs that starts out with variables that seem like they could be related, then slowly progressing to graphs that have more and more unrelated variables to the point where it's ridiculous for them to be correlated at all.

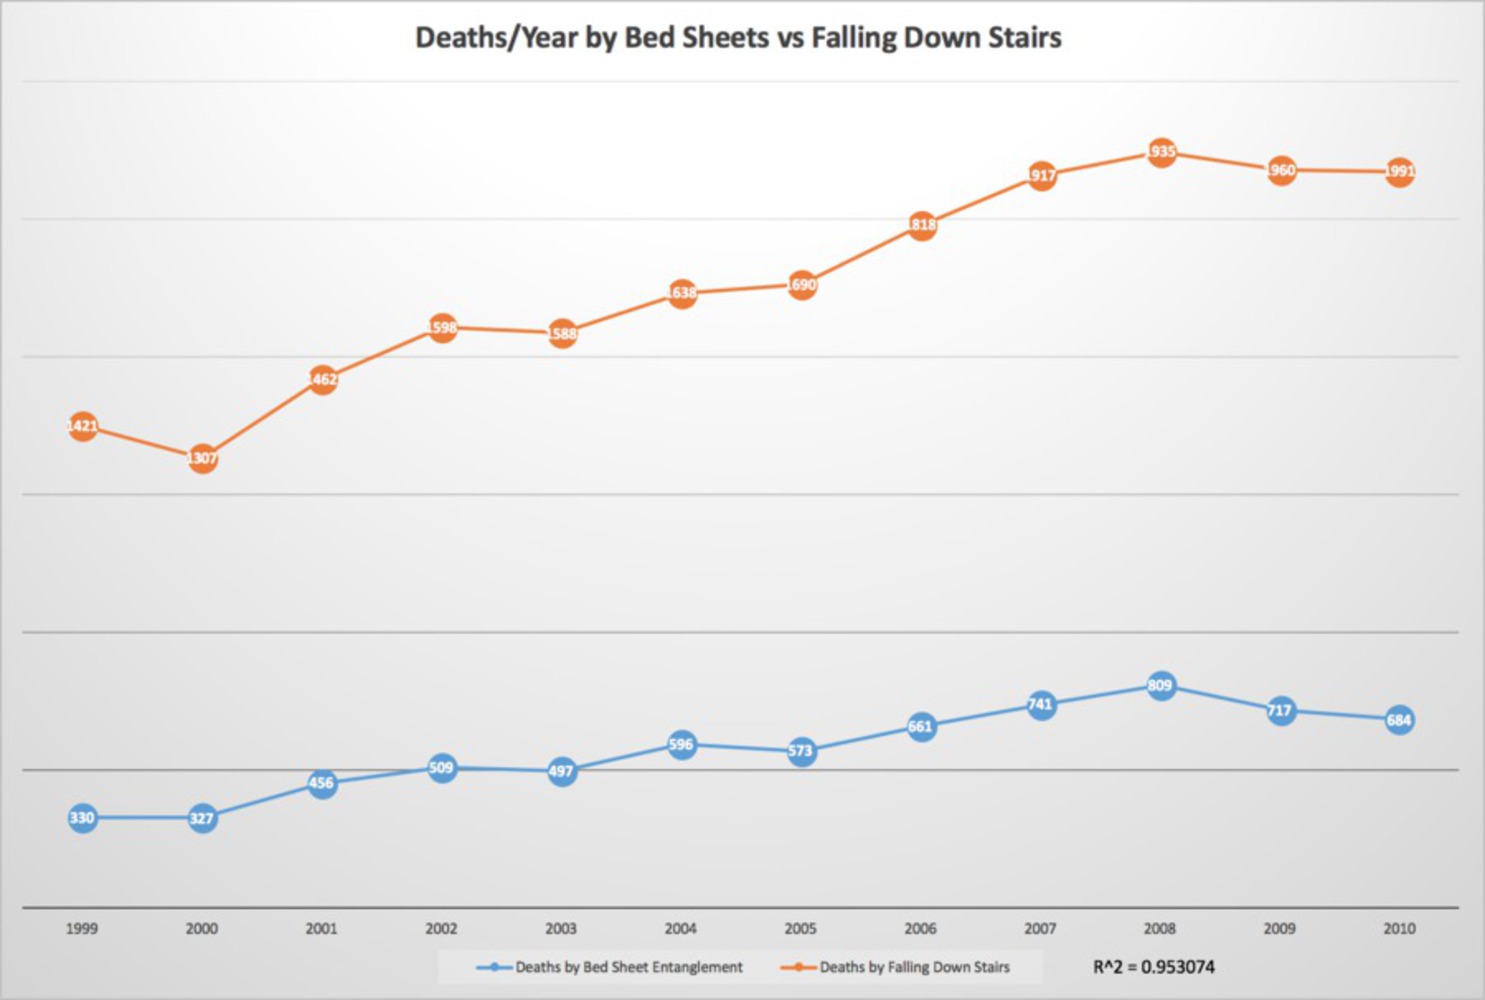
However, doing this project has certainly taught me to be wary of graphs on initial inspection. We are even taught in school that the closer the r^2 value of a graph is to 1, the more closely-related the variables of the graph are. However, this is a clear example of a way to completely take advantage of this fact to create fake ideas that appear mathematically sound. How many "official" scientific findings or news studies have made conclusions that are actually incorrect because we believe that the data seems to correlate?

x
Share this Project


About

The purpose of this project is to show that correlation between data points does not necessarily mean the two ideas being compared are actually related.