Describing Pittsburgh
Made by Tamara Cartwright
Made by Tamara Cartwright
Attempt to analyze the descriptive words tweeted throughout Pittsburgh to gain a sense of its characteristics.
Created: October 29th, 2017
The intent of this project was to analyze tweets posted throughout Pittsburgh to gain a sense of its characteristics based on descriptive words used throughout tweets. In theory the collection of words could be used to create a word cloud that would show the describing characteristics of neighborhoods based on tweets tweeted in those areas.
A dataset of selected adjectives was scraped from PGH Twitter last week.
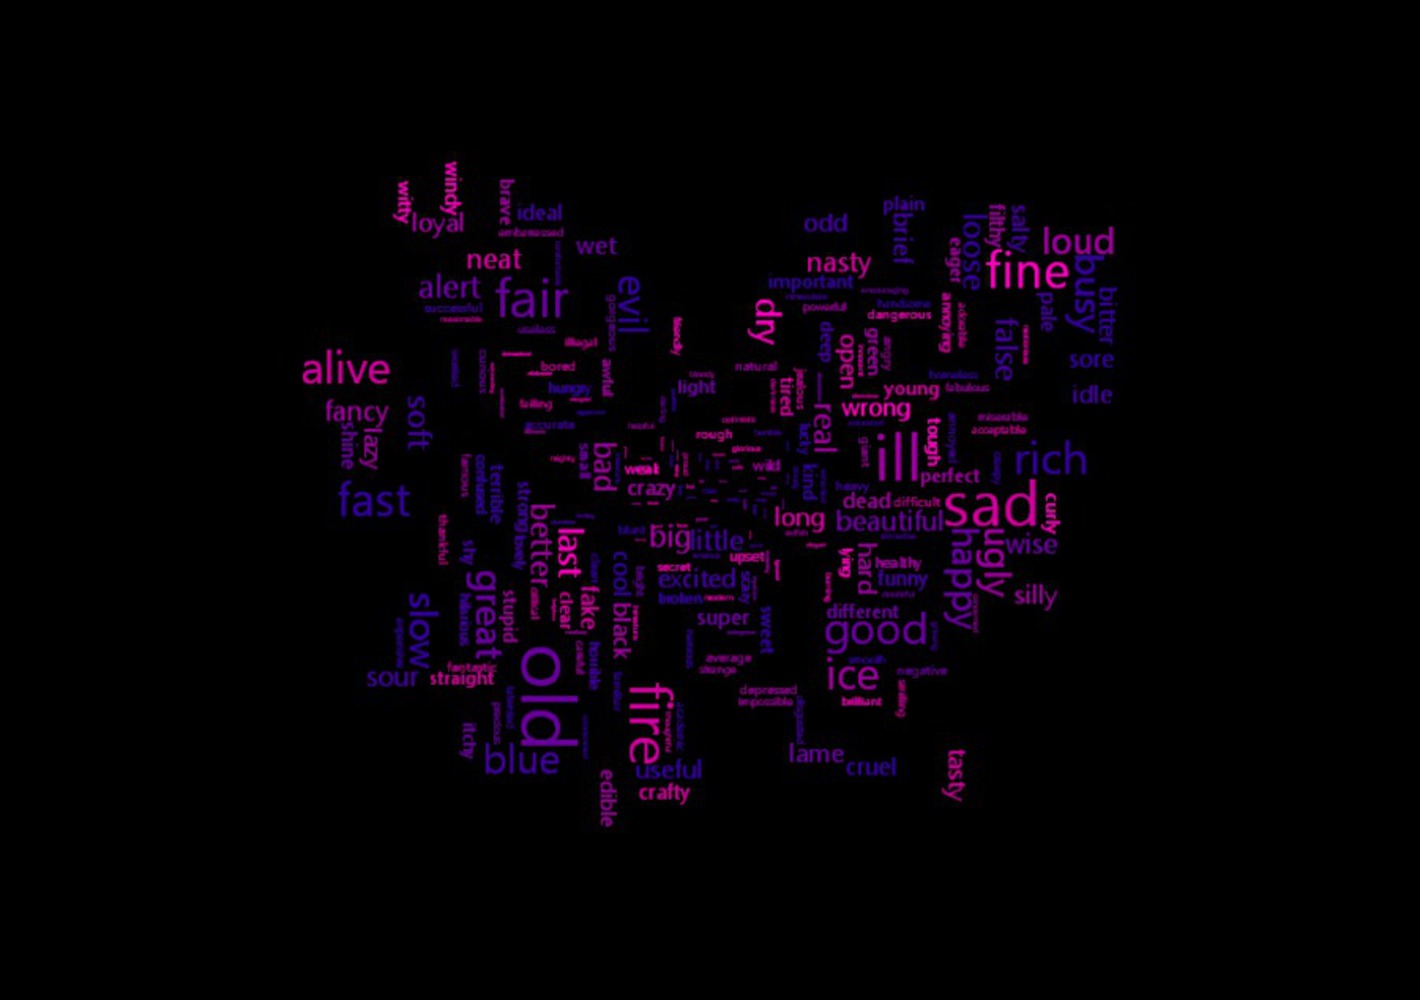
This data will be used in Wordaizer, to form a word cloud of the city that will allow us to see the most common descriptive words used throughout PGH tweets.
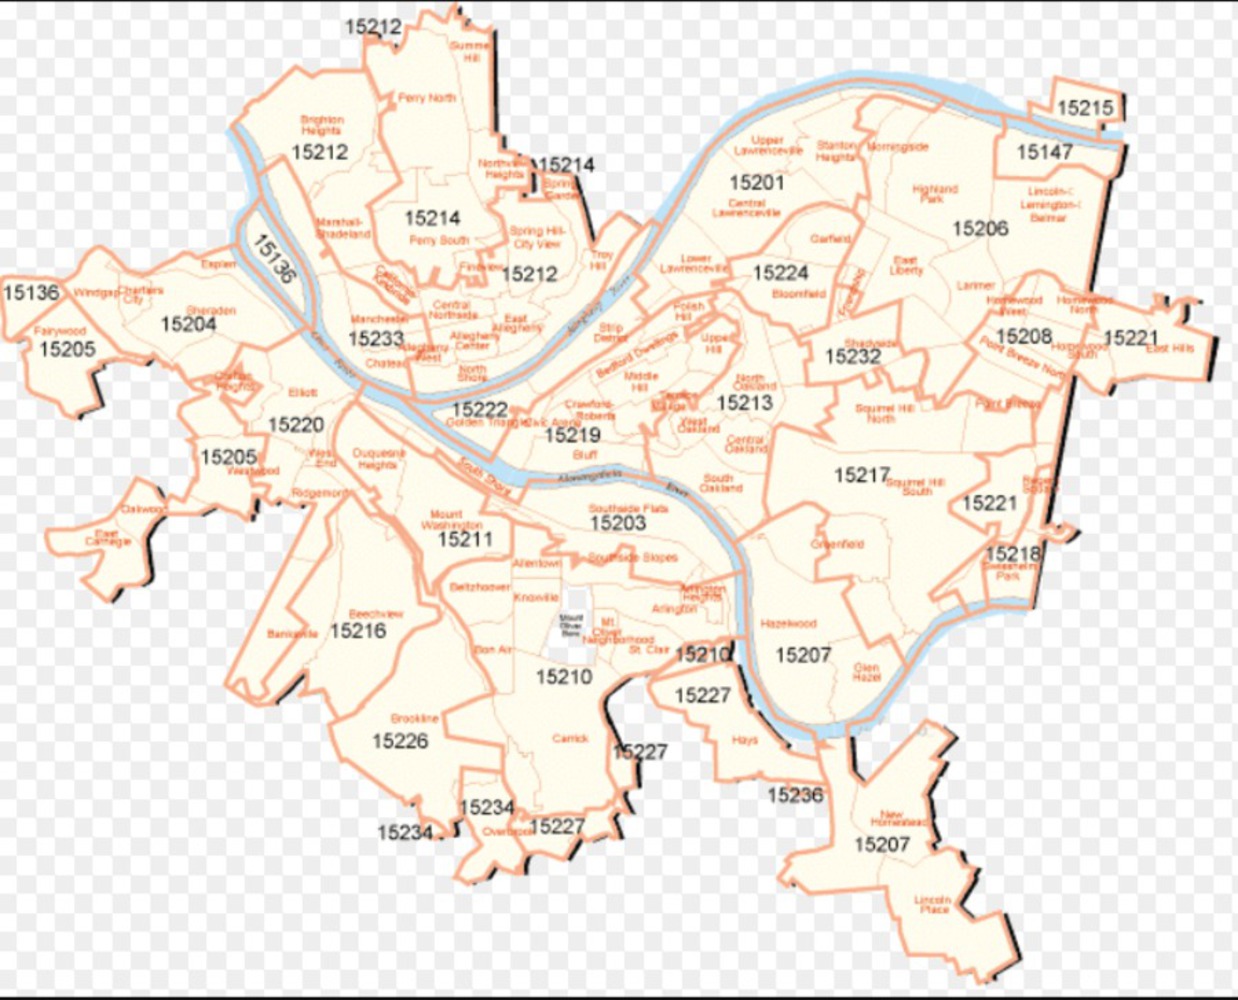
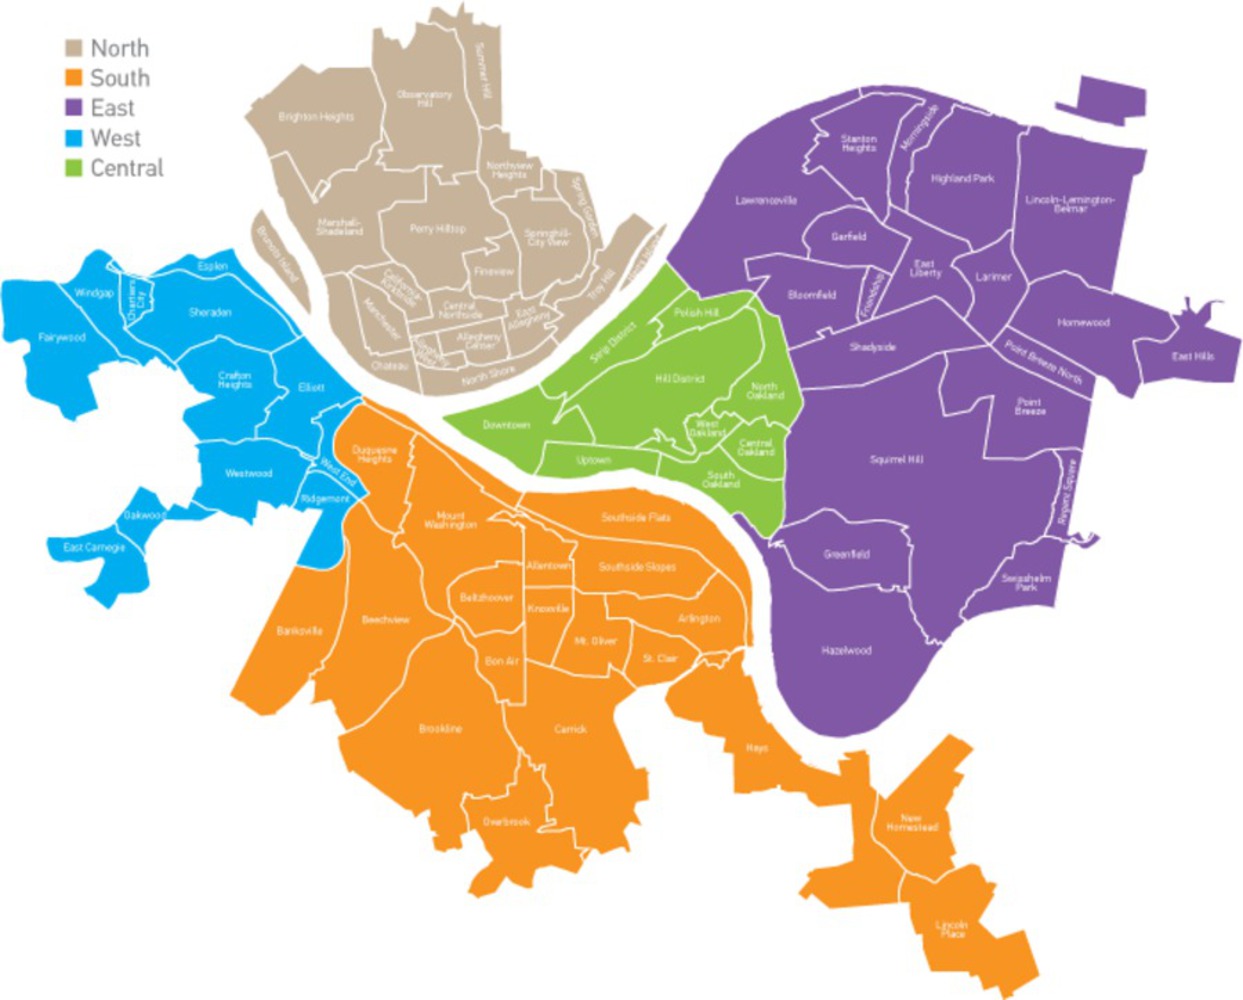
The dataset is a week of scraped twitter data, sorted via postal codes and arranged into the different regions of Pittsburgh- North, South, East, West and Central.
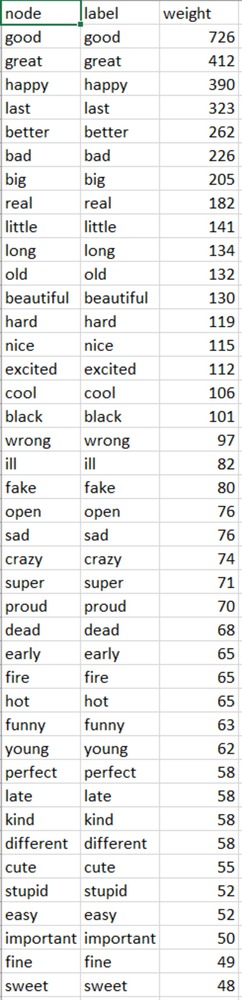
A target list of adjectives was used to pull counts from the tweets. From this we can see which regions tweet which adjectives the most.
Again, the postal codes of each region was combined to one text file that registered the count of each time the adjective was tweeted.
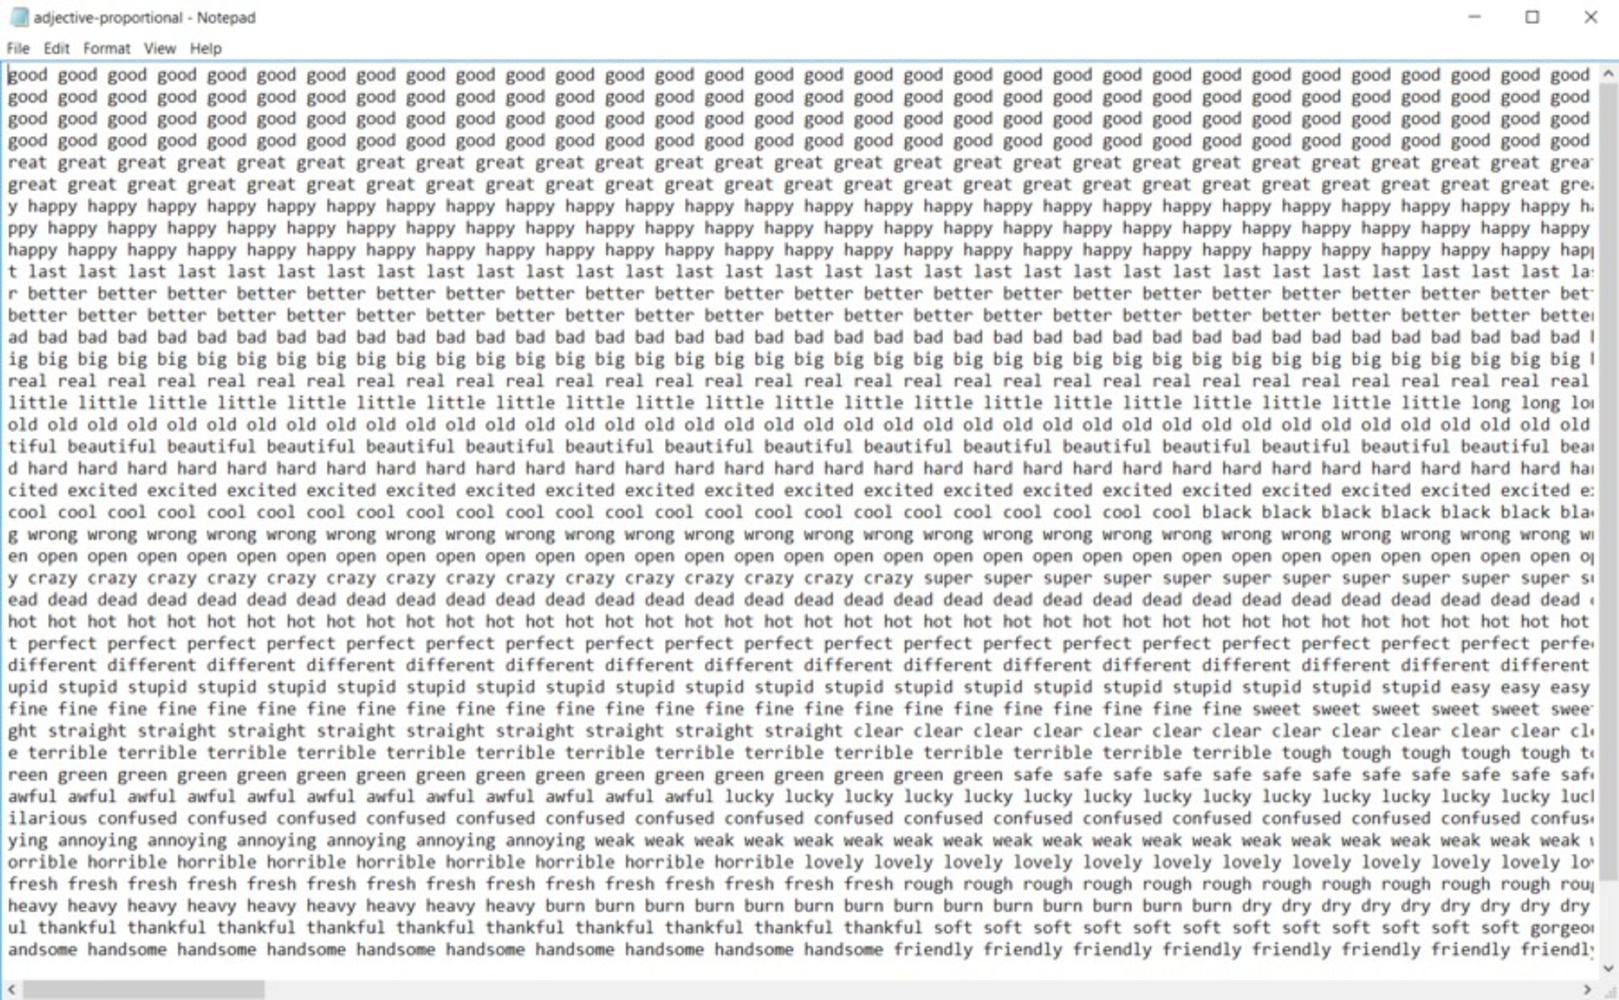
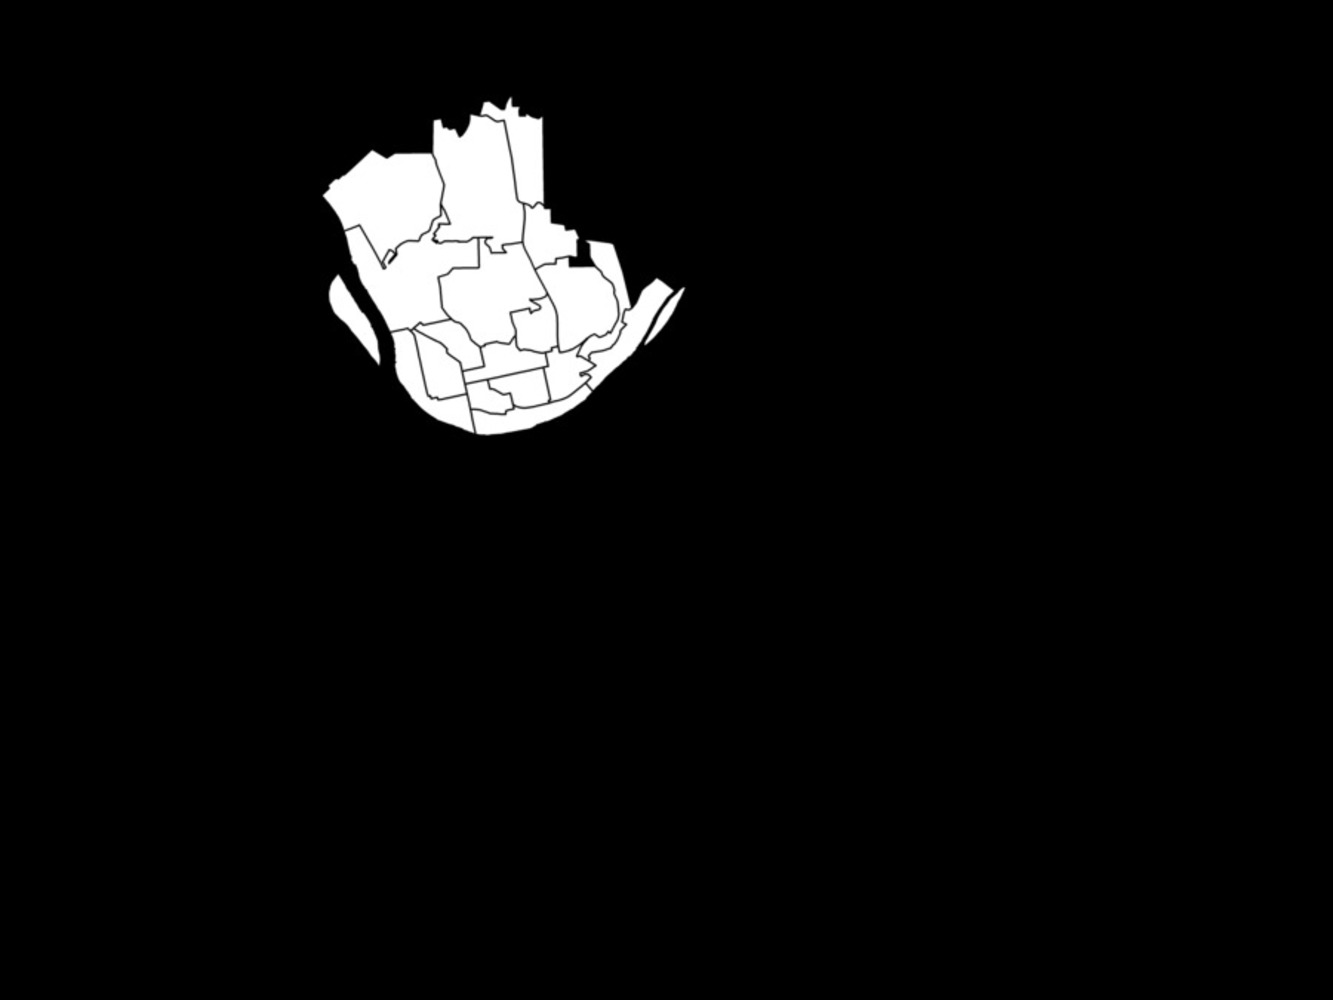
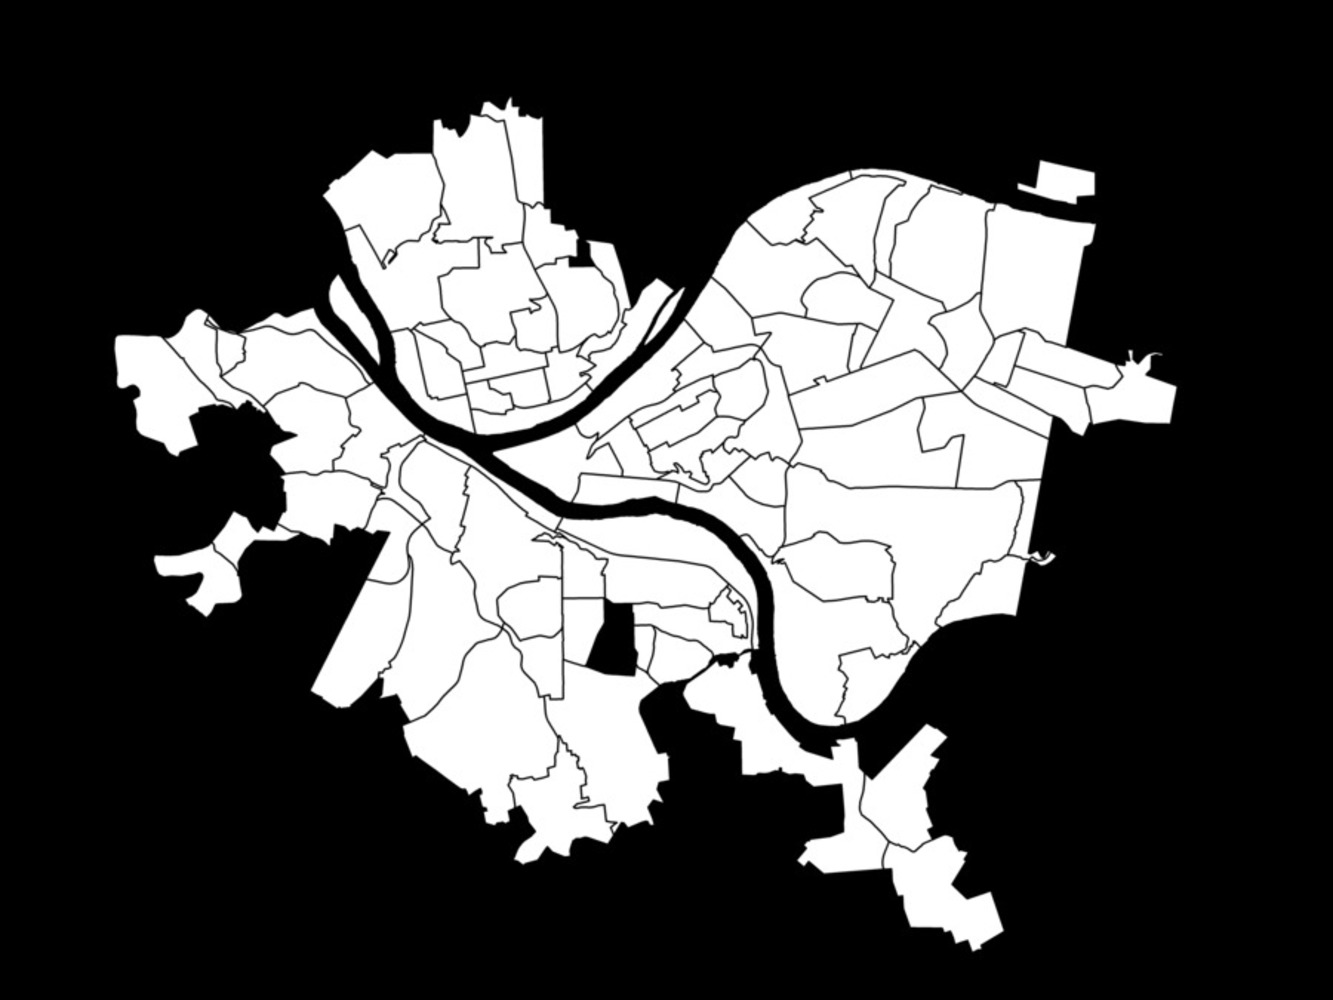
The data was then used to form a textfile that would be compatible with Wordaizer, the app that would sort through the word counts and establish a hierarchy for the visualization of the data. In order to do this all text files for zipcodes within a particular region were combined. Additionally, bitmaps were created for each region that would act as the mask to confine the words to in Wordaizer.
Below: Bitmap of the North Side.
Upon attempting to create the 5 different Word clouds that would be used to form the large map of Pittsburgh however, I ran into quite a bit of hiccups.
Limitations when sorting the data:
1. Postcodes jump boundaries!.... and districts! In some cases one zip code is on both sides of the rivers. This proved to be very difficult when trying to sort the data to demonstrate the different characteristics of regions, let alone my original plan to do it based on neighborhood boundaries.
2. Some zip codes are almost fully outside of the PGH boundaries, but may still apply for tweets within the boundary. I made the choice to keep any zipcode data that fell within a region boundary.
3. Because of the overlap, some zipcode data was doubled. For instance, 15207 falls both in Hazelwood (which is in the East) and also in New Homestead (in the south)
Limitations with Wordaizer App:
1. There wasn't enough data to be read by the Wordaizer map for all regions.
2. Because the amount of words were too repetitive (because the data was scraped from just one week of tweets), the map was very open and loose.
Ultimately I had to combine all region data to achieve a denser map that when combined could remotely look like Pittsburgh. My final results were created using one text file with all occurrences of words pasted to a Pittsburgh master-file. I then created a bitmap for Wordaizer of the PGH boundaries.
This is unfortunate because this means that the words have been randomized to any location on the map and may not reflect descriptive words used in a particular neighborhood to tell a thorough story.
Moving forward, it would be nice to see the different kind of map produced from a longer scrap.
Ideally I would love to have each neighborhood representative of the words tweeted within their boundaries. I think it could lead to a very informative map of the city dynamics.
Attempt to analyze the descriptive words tweeted throughout Pittsburgh to gain a sense of its characteristics.