Healthy Ride Trip data Analysis
Made by Ankita Patel · UNLISTED (SHOWN IN POOLS)
Made by Ankita Patel · UNLISTED (SHOWN IN POOLS)
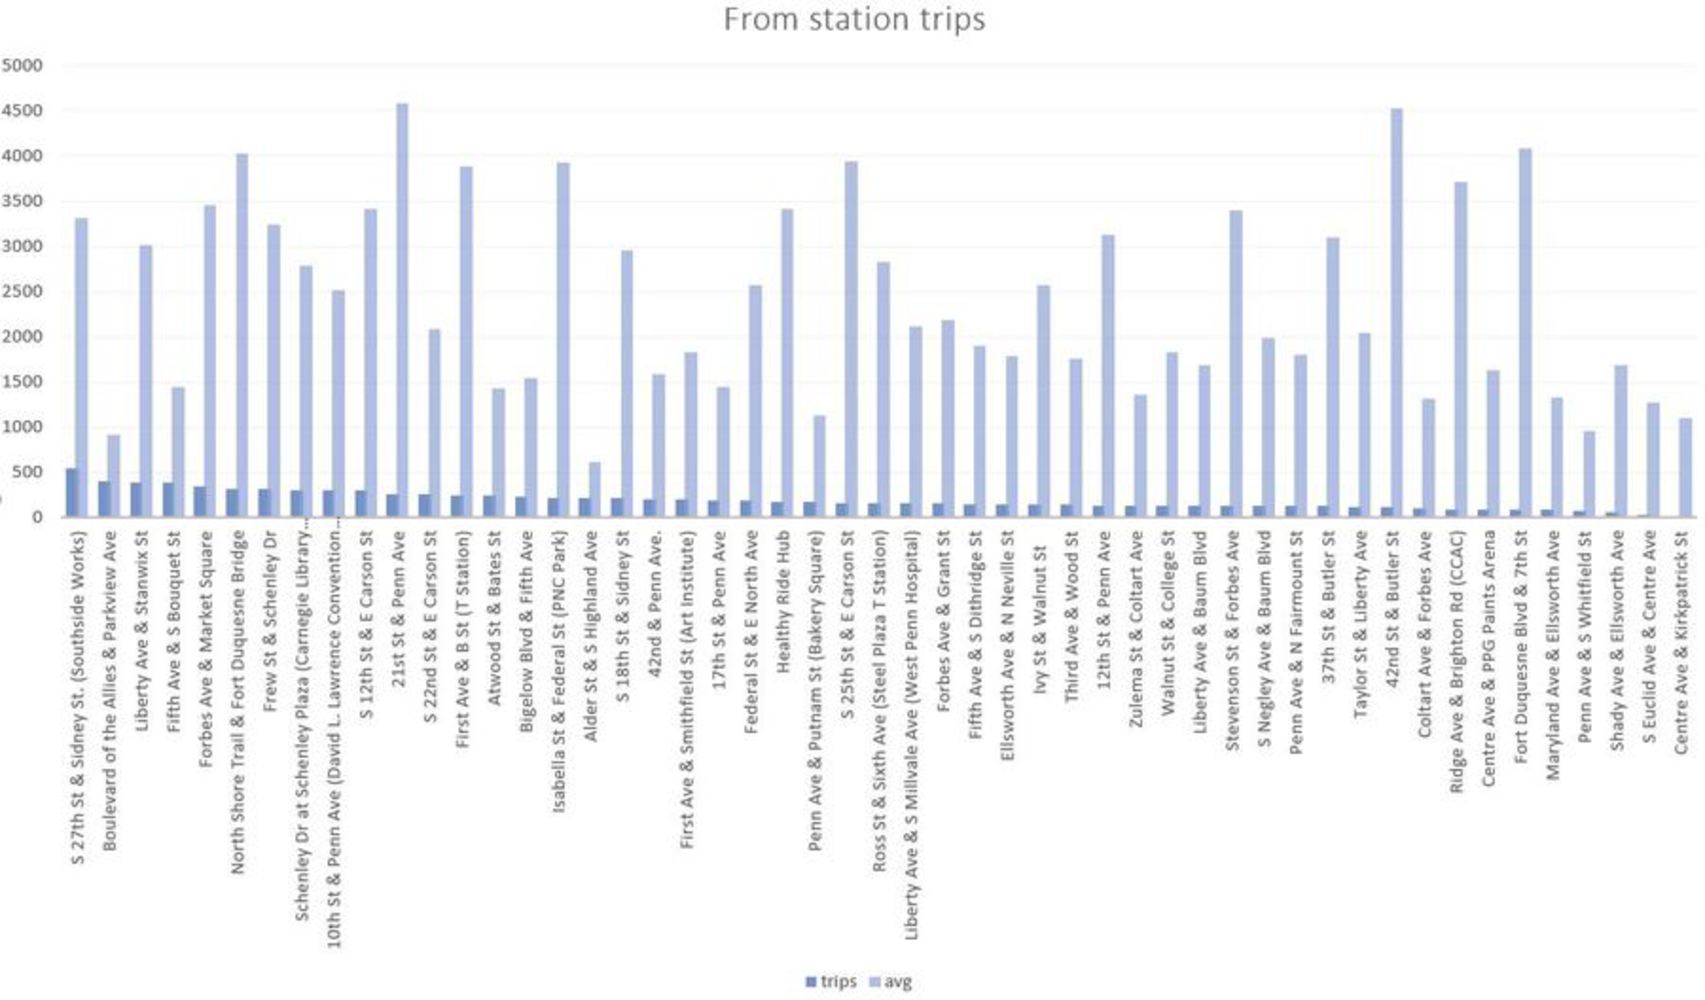
To study the shared bikes movement in the Pittsburgh city and trips made using them
Created: November 22nd, 2017
This project is only listed in this pool. Be considerate and think twice before sharing.
To study the shared bikes movement in the Pittsburgh city and trips made using them