Hill District - Housing Conditions

Made by adobriya

Created: October 7th, 2017

0

Motivations-

Data Category Chosen : Real Estate

Having spent most of my time here in CMU working on real estate projects, this seemed liked an obvious choice and it also aligns with my career interests.

Data Set Chosen : Market Value Assessment data 2016 for Pittsburgh

This data available on WPRDC is very valuable as it gives us an insight into cause and effects of property assessment values across the city. It could be used to also decide where (neighborhood) to put your project in and the expected future value of that property. (https://data.wprdc.org/dataset/market-value-analysis-urban-redevelopment-authority)

Area Chosen: Hill District

The Hill district is a collection of five neighborhoods and presents a unique opportunity to compare neighborhoods with widely varying income levels and housing standards.

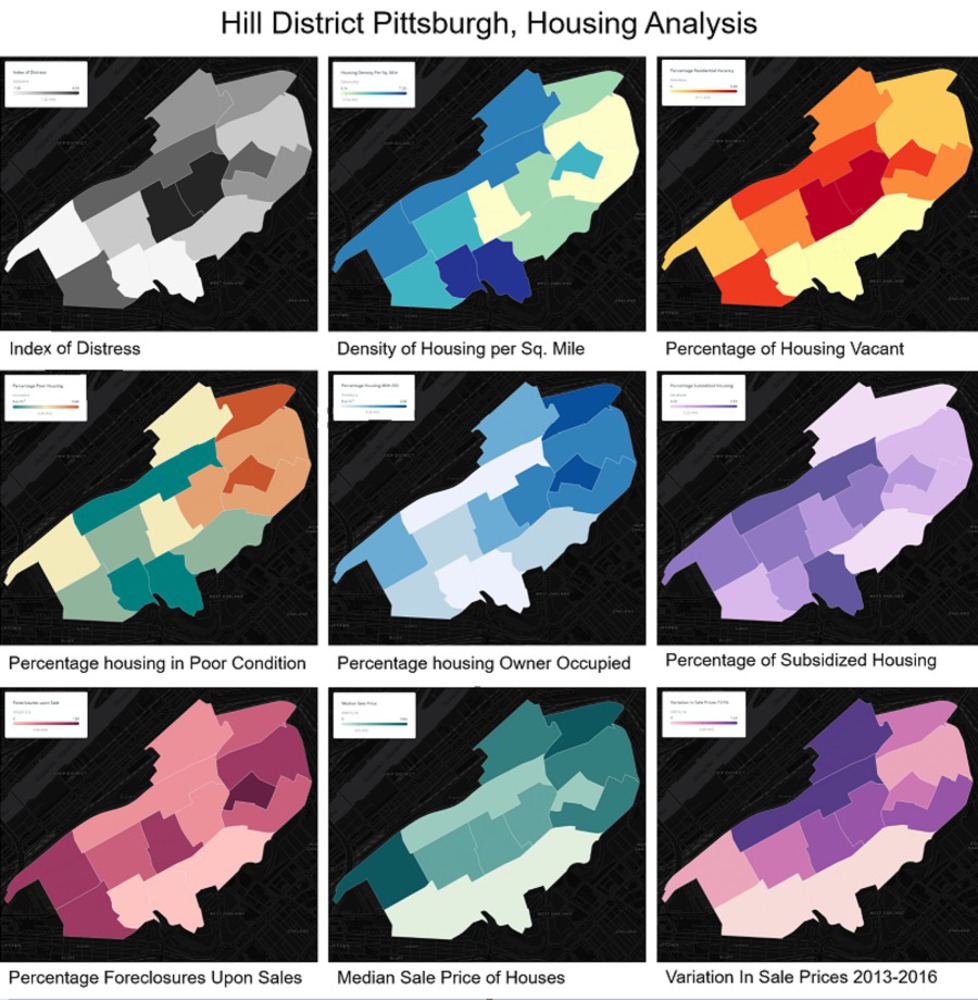
Visualization Type Used: 3X3 grid by Oliver O'Brien , UCL Dept. of Geography

0

The Story that ‘Raw’ data tells us about Hill District!

The United States of America has roughly 132 Million housing units on a total land area of 3.5 Million square miles. This gives a housing density of 37.3 houses per square mile of land area.

We compare this data with the Hill District, Pittsburgh which is taken to be comprised of 5 neighborhoods; Polish Hill, Upper Hill, Middle Hill, Bedford Dwellings & Crawford Roberts. The Hill district has a vacancy rate of 6%-25%, compared to the city rate of 7.7%. This brings out the fact that even with an above median number of houses per unit area, there is a high vacancy rate. This data suggests shortcomings in the housing sectors in the area.

Pennsylvania has a house density of 124 and Pittsburgh has a house density of 5,521 houses per square mile. The Hill district located has a house density of 7,250 to 19,320 making it a very densely populated residential area putting it at least 35% above city median. This gives us a brief idea about how important the housing data is for this part of the city and how big an impact a successful housing analysis would create.

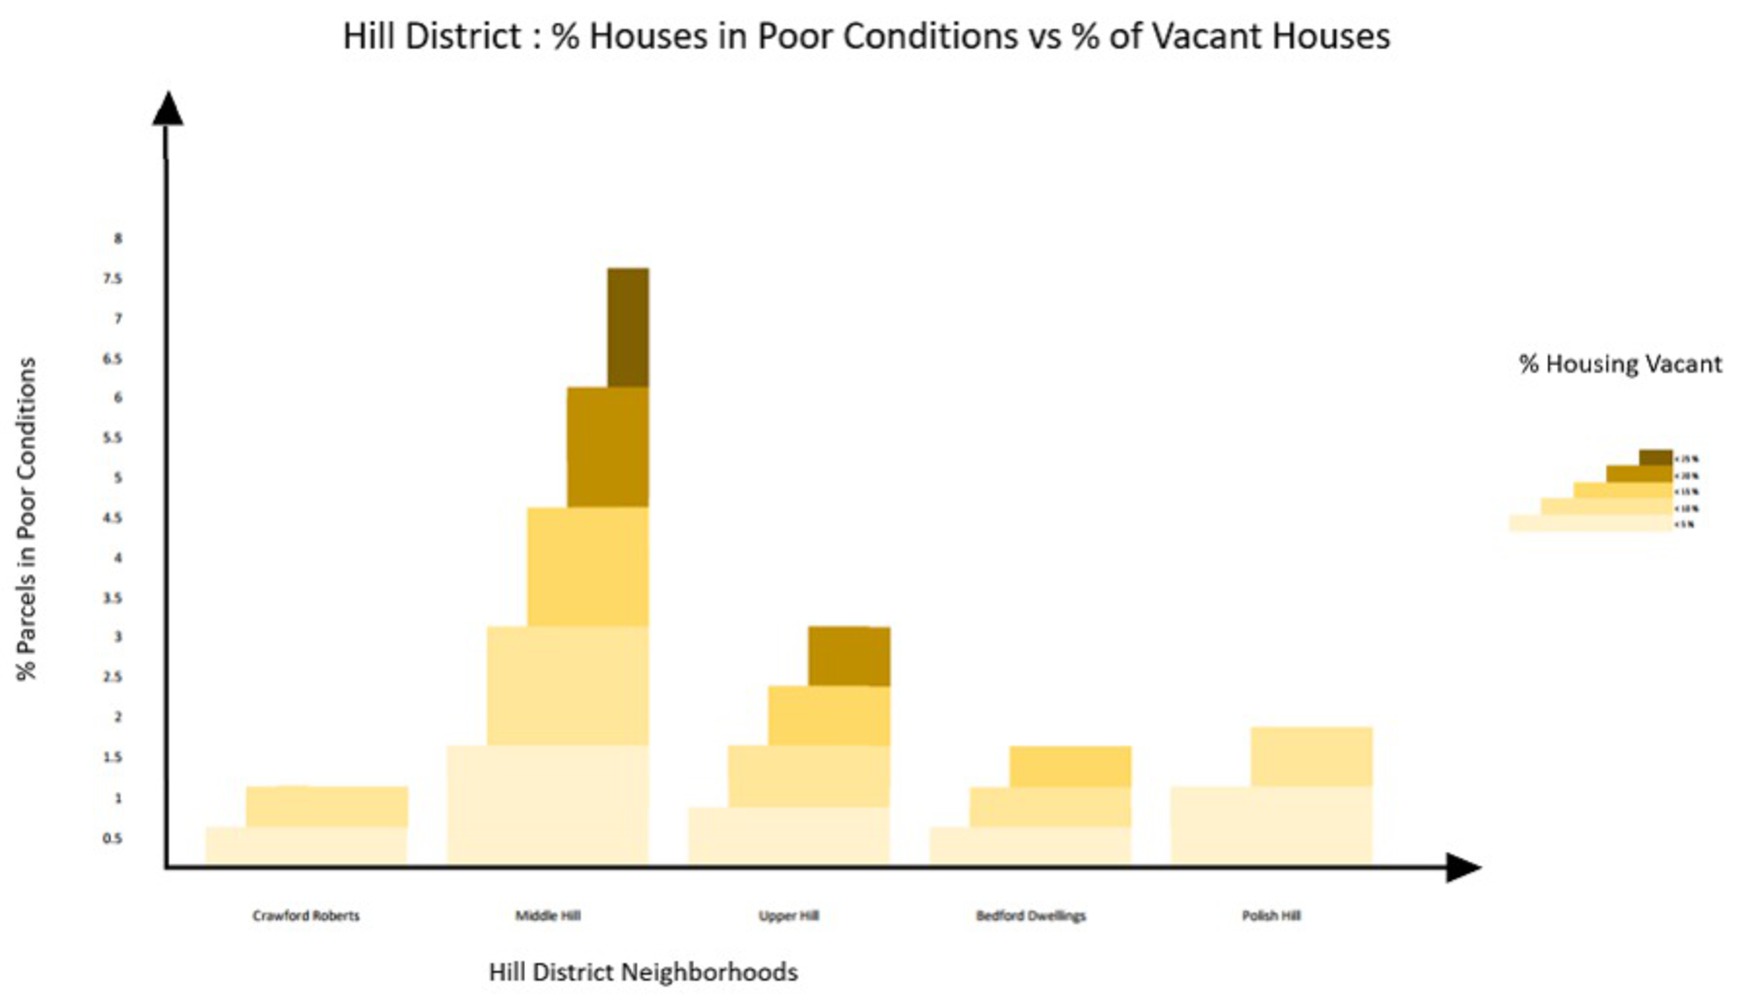
These can be attributed to the high concentration of houses with poor conditions (as defined by Allegheny County). The census data puts the percentage of housing in poor conditions at 5%. This translates to 500 houses per mile in poor conditions. That is a lot of housing and based on average household size could house at least an additional 1250 residents per square mile.

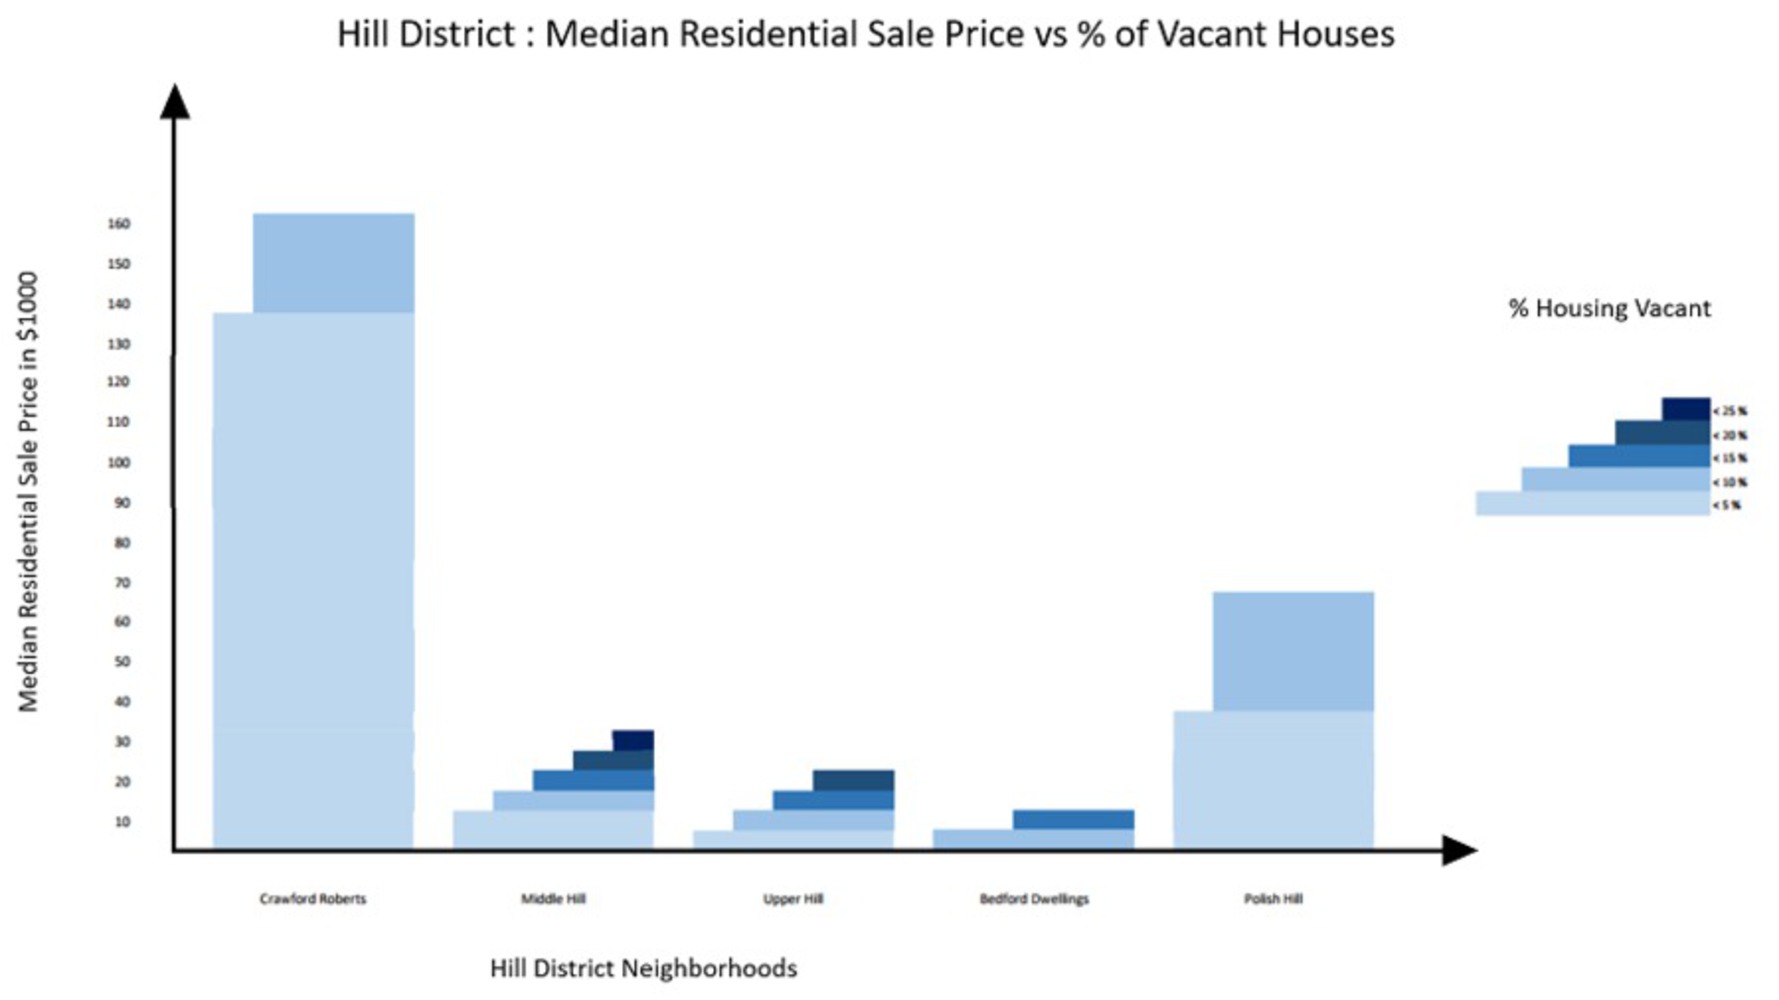
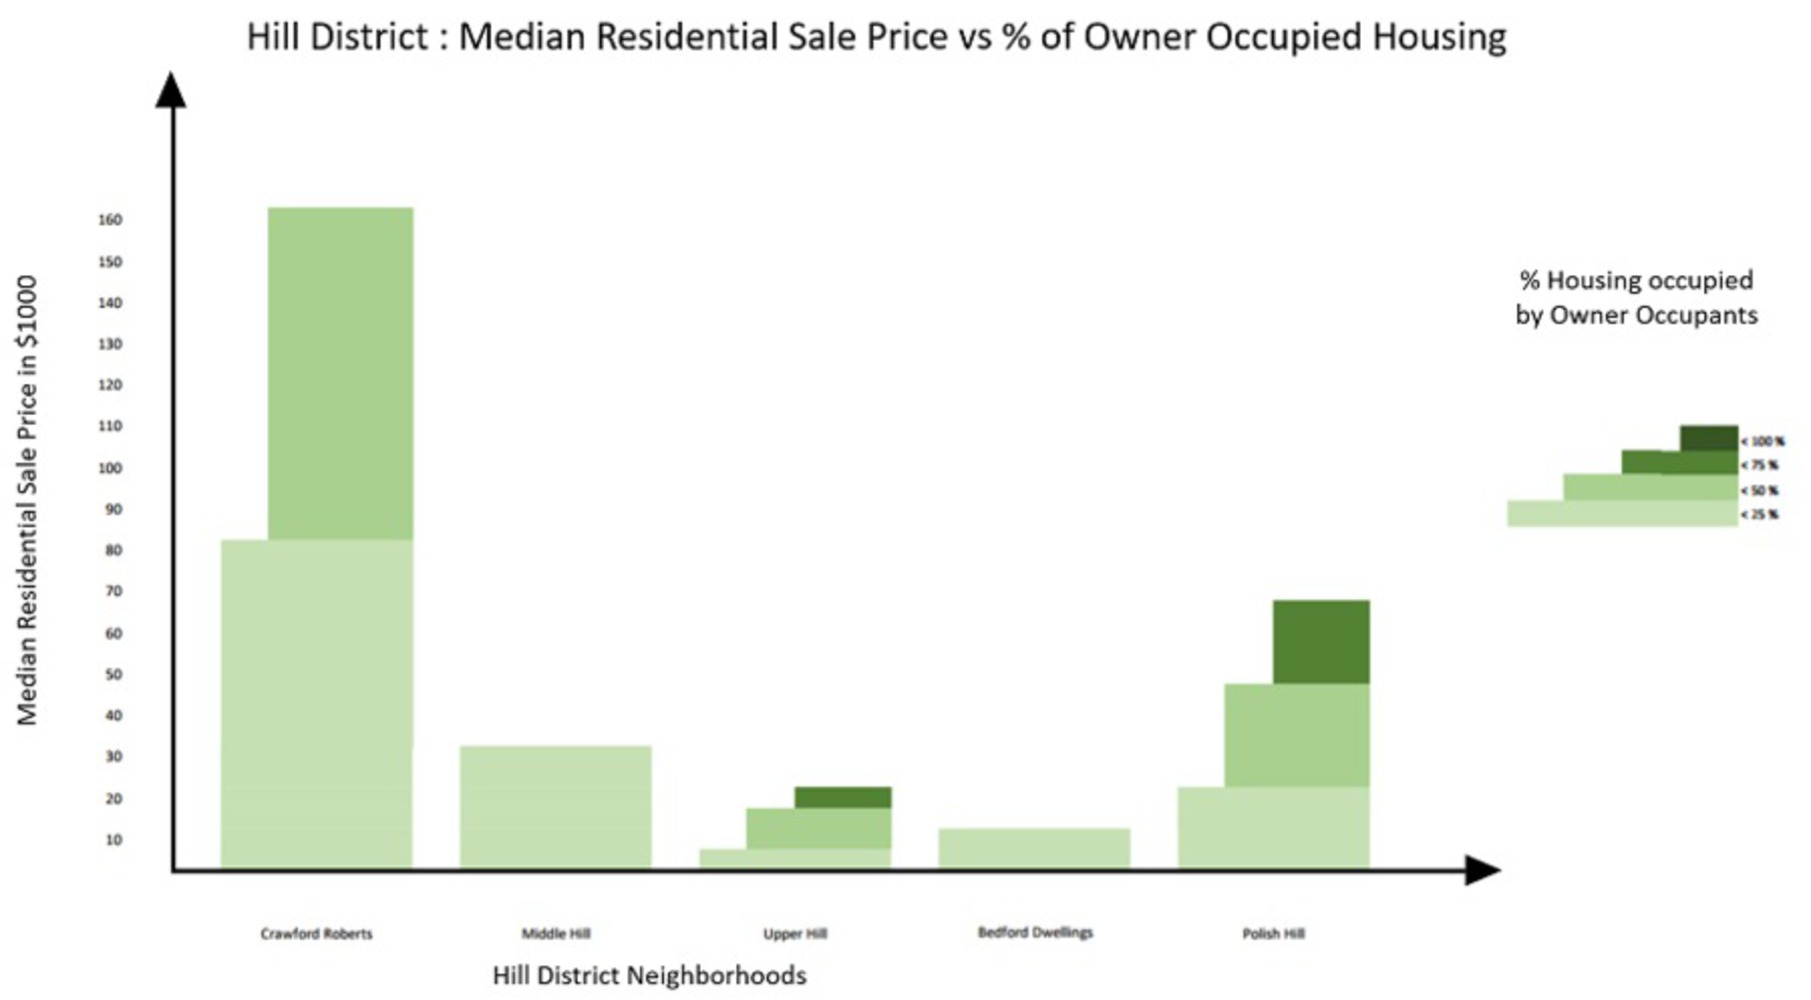
These problems in turn have an effect on the prices of houses in the area. As a result, the median residential sale price of a house in the area is $56,500 even as cost of new construction exceeds $100,000. The area also has an unusually high percentage of foreclosures for each sale recorded. 

0

Expected Outcomes/Preconceptions :

1.A linear relationship between the amount of vacant houses in an area and the condition of those houses
2.The effect of these vacant houses on the median sale price of houses in the area
3.To justify or dismiss the pre-conception that Owner Occupied housing is generally in a better condition than rentals and hence higher valued.

Assumptions :

1.There exists an effect-cause relationship with the data compared and the results seen from the visualizations.
2.Data given at the source is accurate and not just an estimate
3.The data is at the scale of the problem
4.All houses are of the same size
0

Data Collection Process:


1.Log in to Western Pennsylvania Regional Data Centre’s Website (http://www.wprdc.org/)
2.Search for Market Value Assessment Data and download the zipped shape file
3.Import the zip file into Carto and extract a csv file
4.Open the file in excel and filter out the five neighborhoods of the Hill District
5.Cut out additional data columns and save as a simplified CSV file
6.Use the data to form desired visualizations comparing one set of data to the other
7.Compare assumptions/ preconceptions to visible results.
8.Document additional insights gained from the ‘neighborhood portrait’


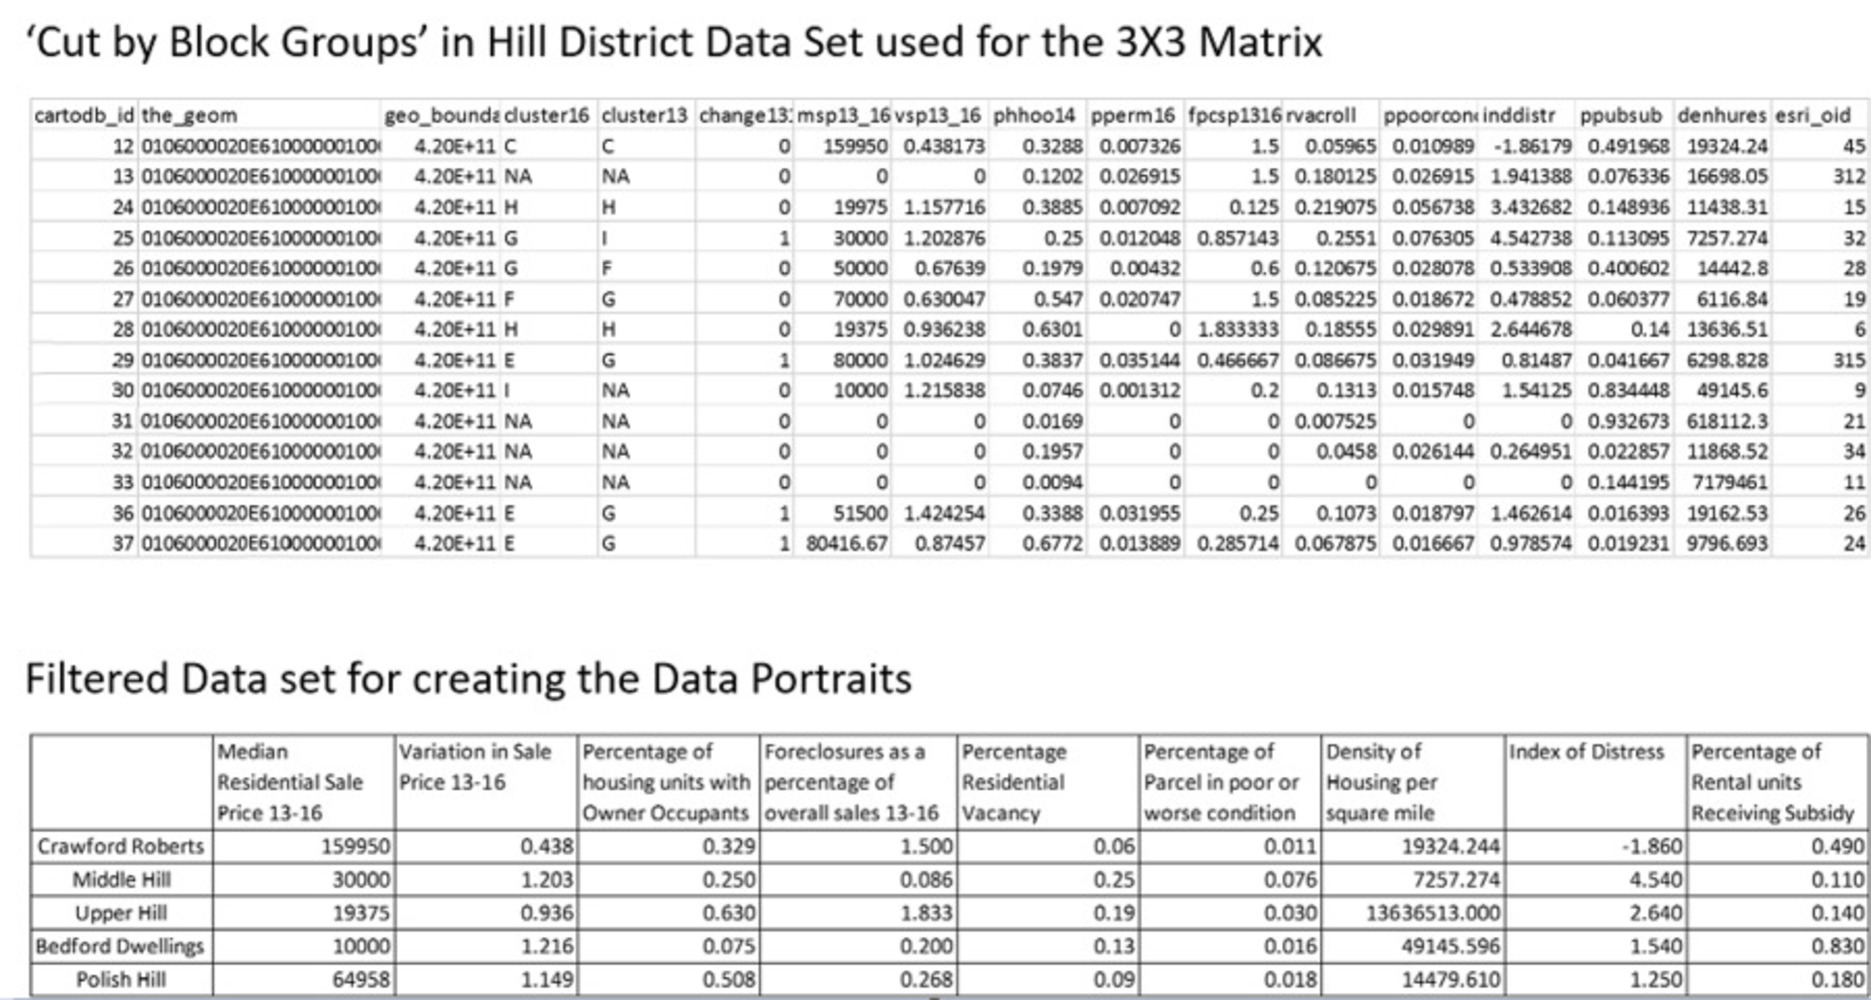
The next five pages show data sets and the final visualizations (3X3 along with additional data portraits):

0

Insights from the Visualizations to complement the Story by ‘Raw data’

1.Areas with High levels of Distress had a high percentage of vacant and poor condition housing pointing towards the inference that housing is costed out by a person in distress and other priorities take over.
2.Areas of higher densities also have higher vacancy rates which points at the condition of housing. This is confirmed by the illustration with the condition of housing.
3.It can also be seen that areas with poor housing conditions also have a high percentage of subsidized housing. This gives us a sense of how even with subsidies, people are not able to afford a house in good condition.
4.A seemingly linear relationship does exist between the amount of vacant houses in the Hill District and the condition of those houses.
5.The effect of these vacant houses on the median sale price of houses in the area is also visible given that neighborhoods with higher vacancy rates selling houses at lower prices and those with lower vacancy rates selling high.
6.The pre-conception that Owner Occupied housing is generally in a better condition than rentals and higher valued was not supported by the visualizations. Houses with low owner occupancy were sold both at higher and lower ends of the spectrum. This led this data visualization to be inconclusive. 
0

Recommendations:

1.A detailed study needs to be performed on the housing conditions in the dense Hill District Neighborhood and strategies of redevelopment to be looked into.
2.Authorities subsidizing housing should look in ensuring the condition of houses people move into is on par with the standards.
3.In addition to foreclosures for owner occupied properties, data should also be collected on the rate of people moving out of rental units to get a complete sense of conditions in the area.
4.Data divided further into Blocks can paint a much clearer picture for planner s and ways to visualize it should be looked into.
0

Other possible visualizations from the data set:

1. Comparison of sale price/ houses in poor conditions to foreclosures?

2. Comparison of condition of houses to % of houses receiving subsidies?

x