How to Sell on Etsy
Made by Katherine Martinez
Made by Katherine Martinez
Create a graphic that misleads about how to make money on Etsy
Created: November 2nd, 2015
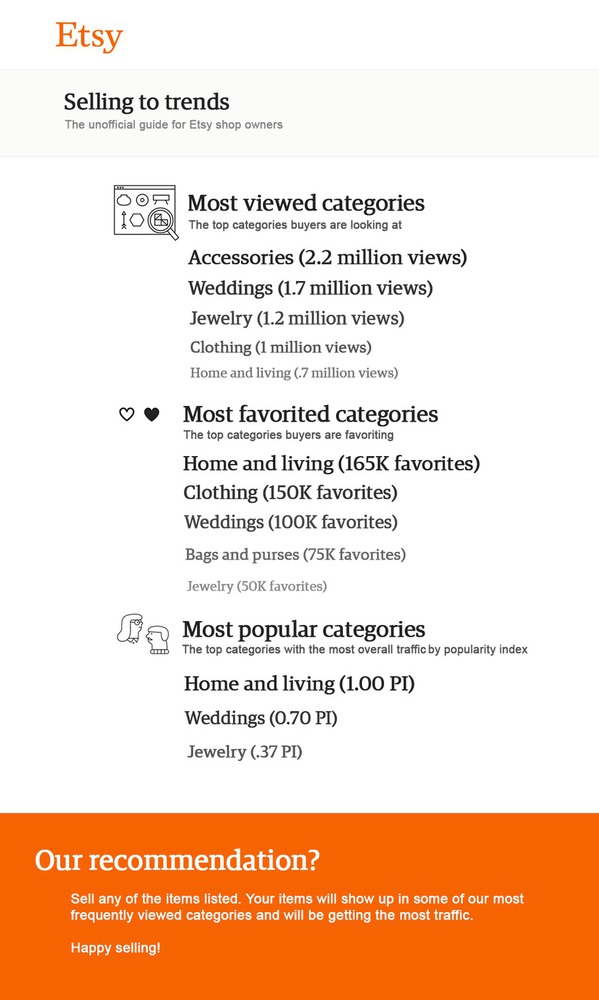
I created a visual graphic, in the style of Etsy's seller handbook that instructs potential sellers on flawed ways to get items to sell. The data was generated through Etsy's API and a python script that makes the needed requests and organizes the data. The visual graphic itself was hand-drawn, using the script's reported data. Source code for the python script and related modules are available here.
Since I work for Etsy, I'm reasonably familar with the community and in particular, with the struggle on the sellers' part to get noticed. There's lots of guides, both official and unofficial, that try to explain the "best" way to get noticed as a seller, but on Etsy, as in life, there is no clear path to success. I hope to both highlight the unnecessary nature of these guides, which often mostly only bring profit to the writer, as well as encourage sellers to seek out more meaningful ways to drive their traffic.
There's plenty of guides available to help sellers break into the Etsy market, though none (very few) of them are data-driven the way that mine is. They primarily focus on shop aesthetics and presentation, rather than "playing to trends" in the way that my graphic suggests.
Most dataviz works I've seen focus on more concrete relations such as location, time, or demographic, and tend to focus more on people and socially relevant trends. Trying to play to the fun and playful aspect of the prompt, I opted for something a little less hard-hitting.
I spent a lot of time deciding which dataset I wanted to use, searching mostly for preexisting datasets I could manipulate. Most of these focused on topics that I had trouble reconciling with "fun and playful", though I found them interesting. I came to Etsy nearly out of desperation, knowing that I would be pretty comfortable working with it.
I slowly built up a modules and libraries that could process and organize the data effectively. While testing, I also came up with a flawed logic that I could use to present this data. I also pulled assets and style standards from Etsy's css, and fortunately had the font available on my computer, though I could have gotten the text from hacky Chrome developer tools methods as well.
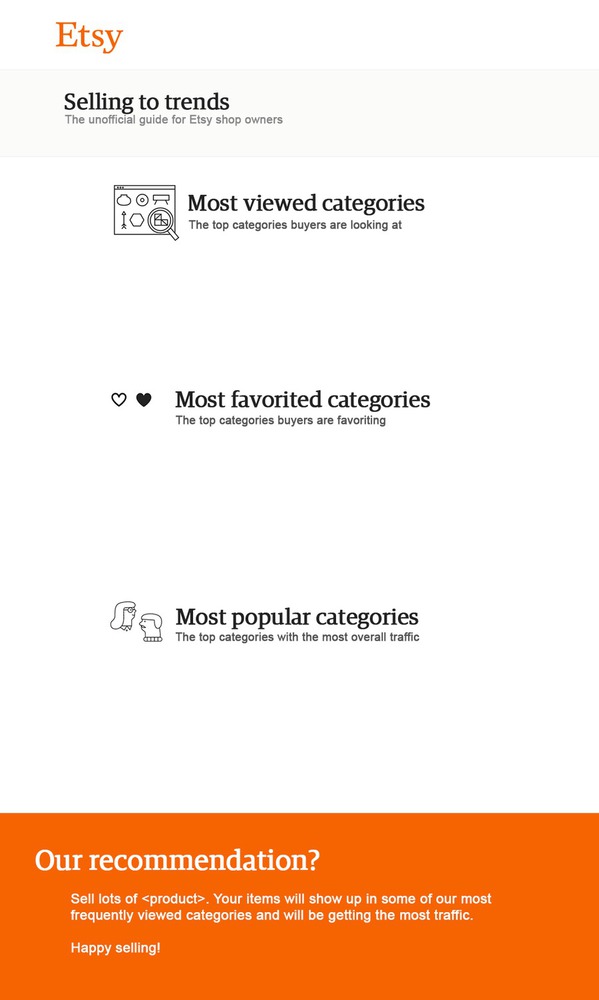
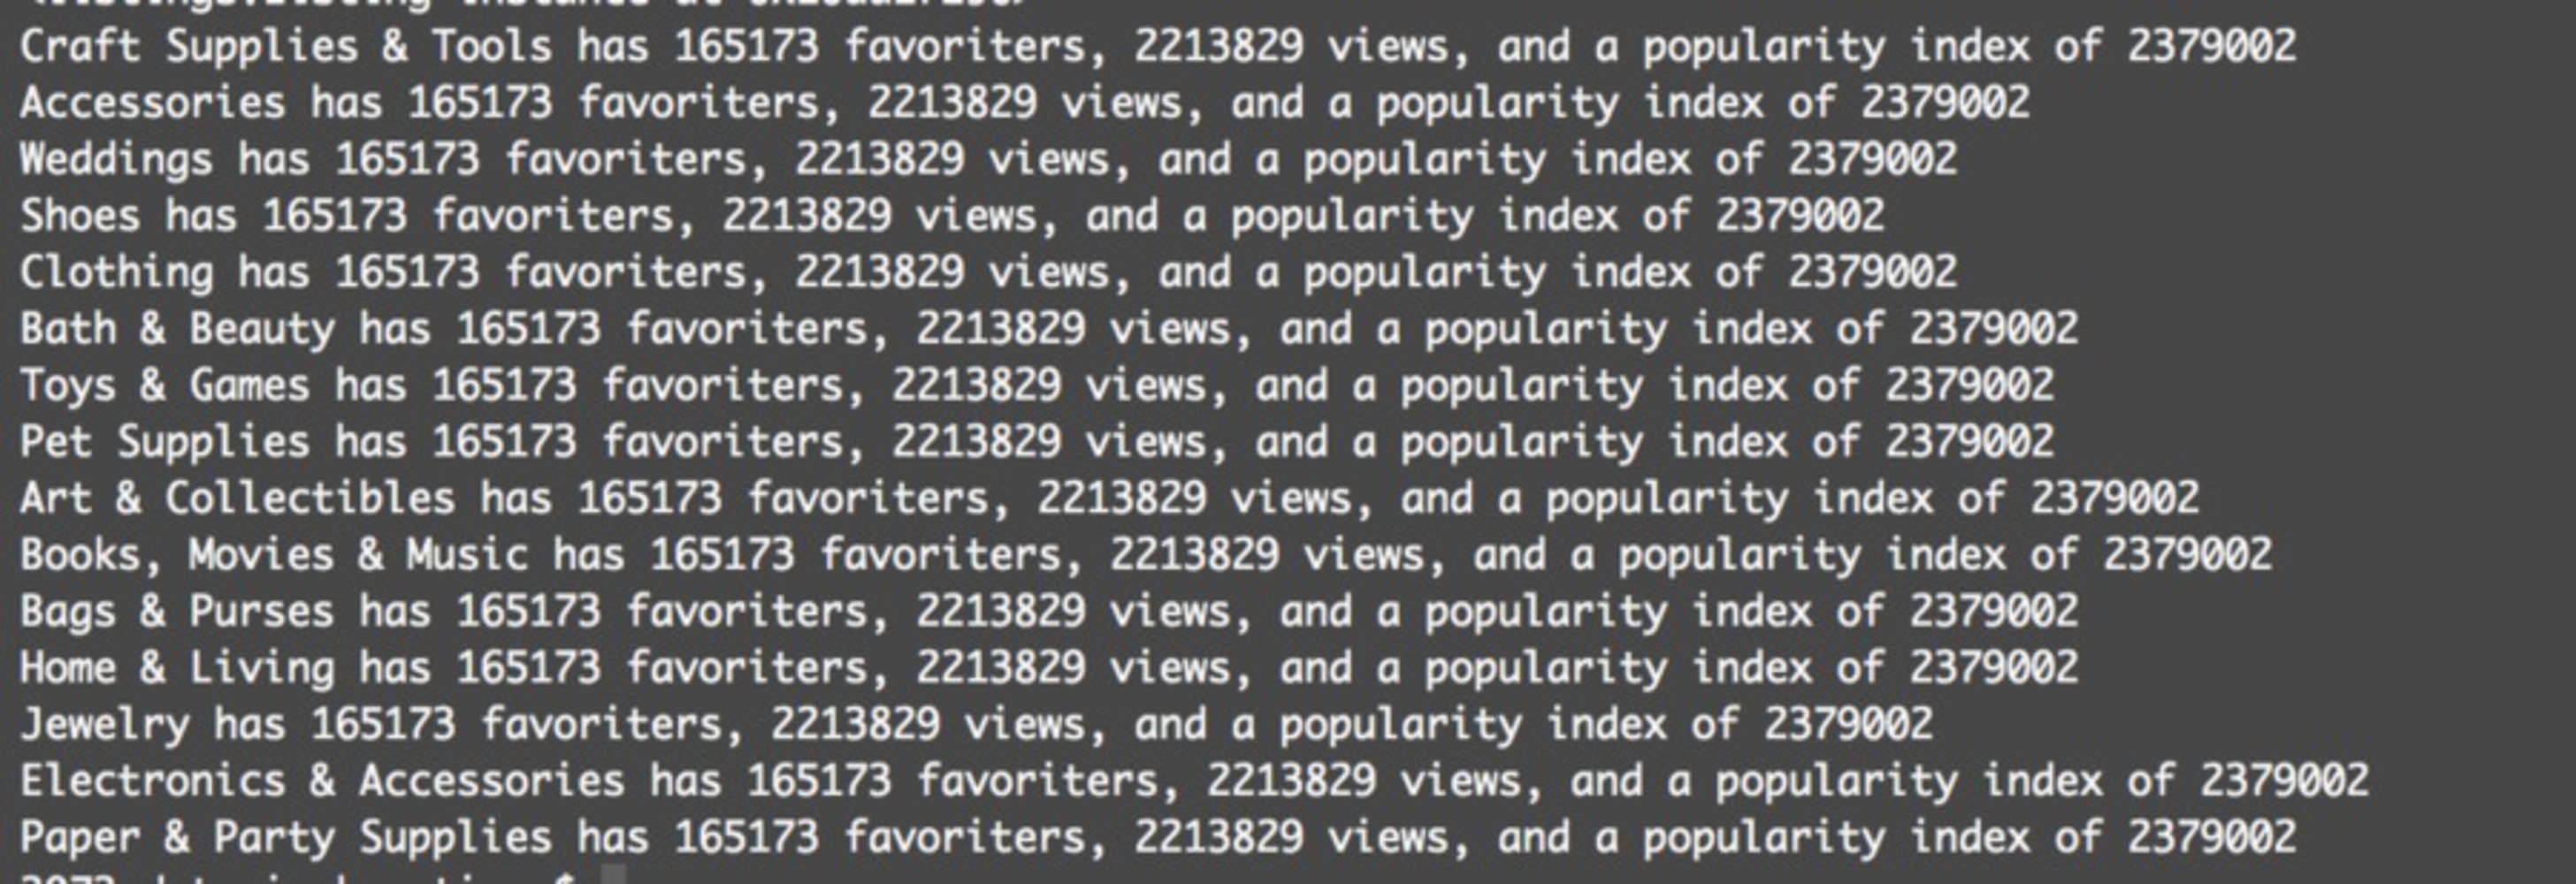
Unfortunately I was unable to get the code working by the deadline, mostly due to the length of time needed to run the program each time. The data displayed is a mockup of what it would look like populated with real data.
My biggest regret in this project is definitely trying to build a dataset myself. While the process was not difficult, it was time-consuming. I also didn't use any sort of caching of my requests, so debugging required me to make 20+ requests each time I wanted to run the script, which was by far the most annoying part. The remainder of the work was definitely decreased in quality due to the timesuck of writing the requests. I would have liked to do more interesting things with the data, but only used a very small portion of it for this project. As you can see, my data was not correct, so I had to fake data in order to indicate the idea behind my project. This is definitely not good dataviz practice, but if my data had been correct this would not have been necessary.
Create a graphic that misleads about how to make money on Etsy