OPENSTREETS and HEALTHY CYCLING
Made by Lu Zhu
Made by Lu Zhu
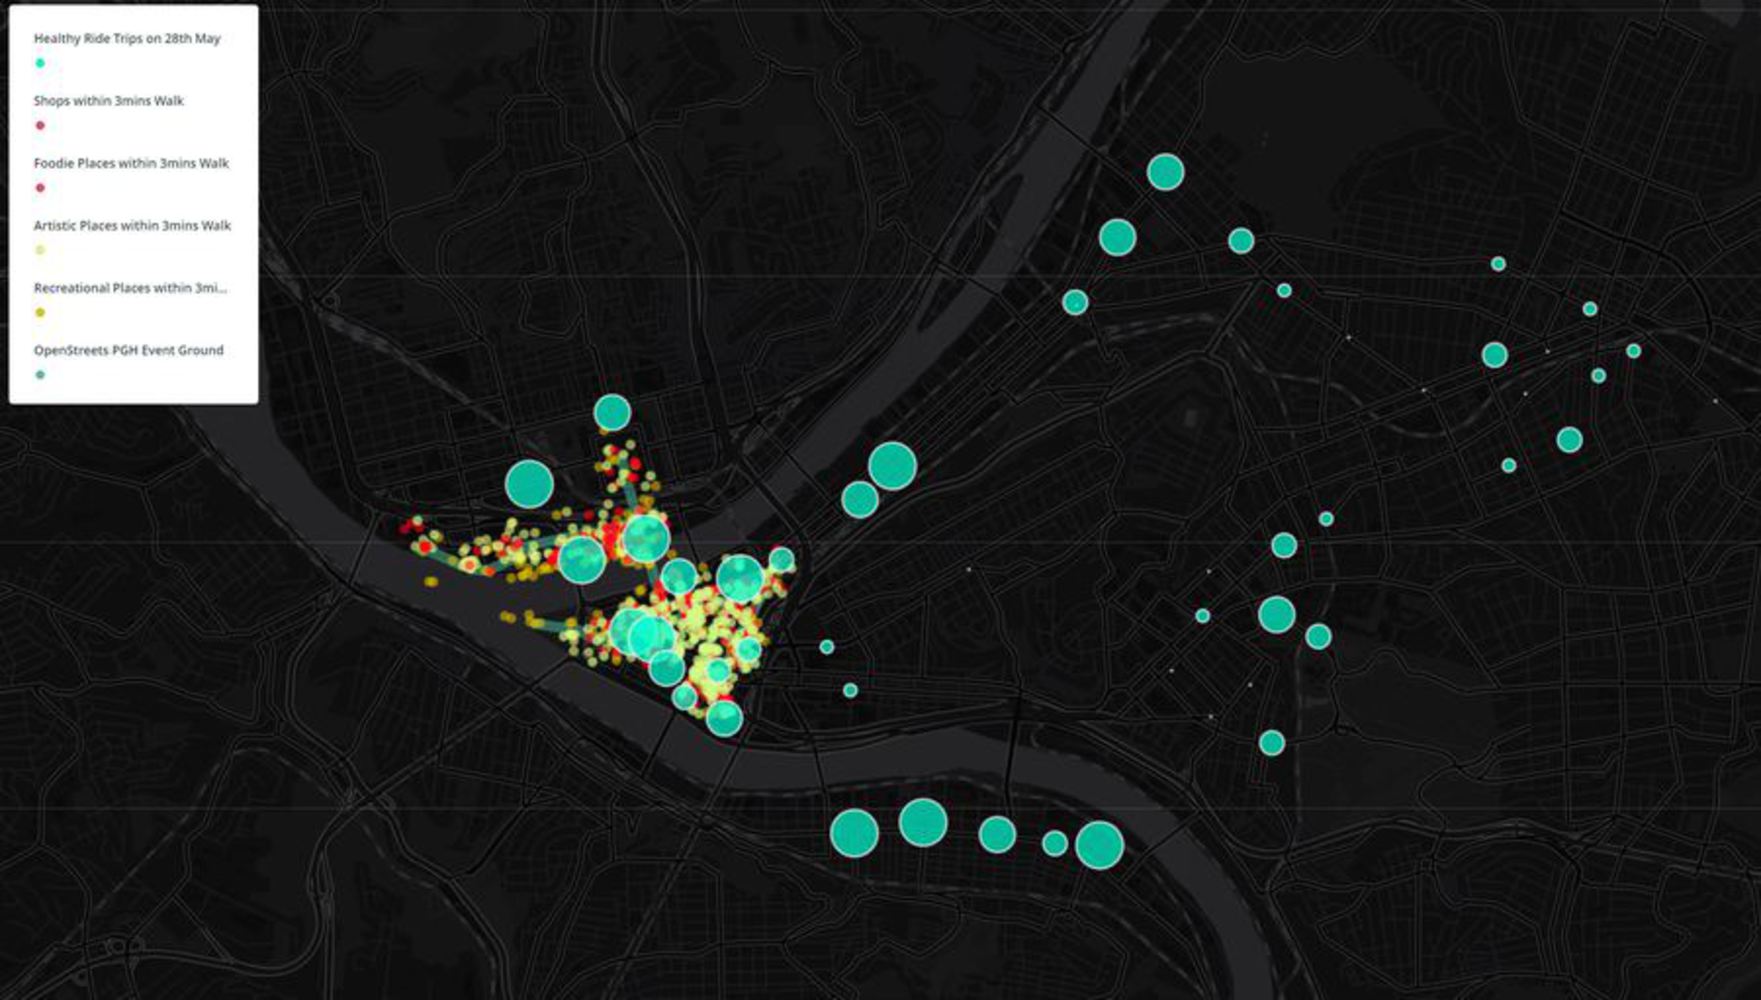
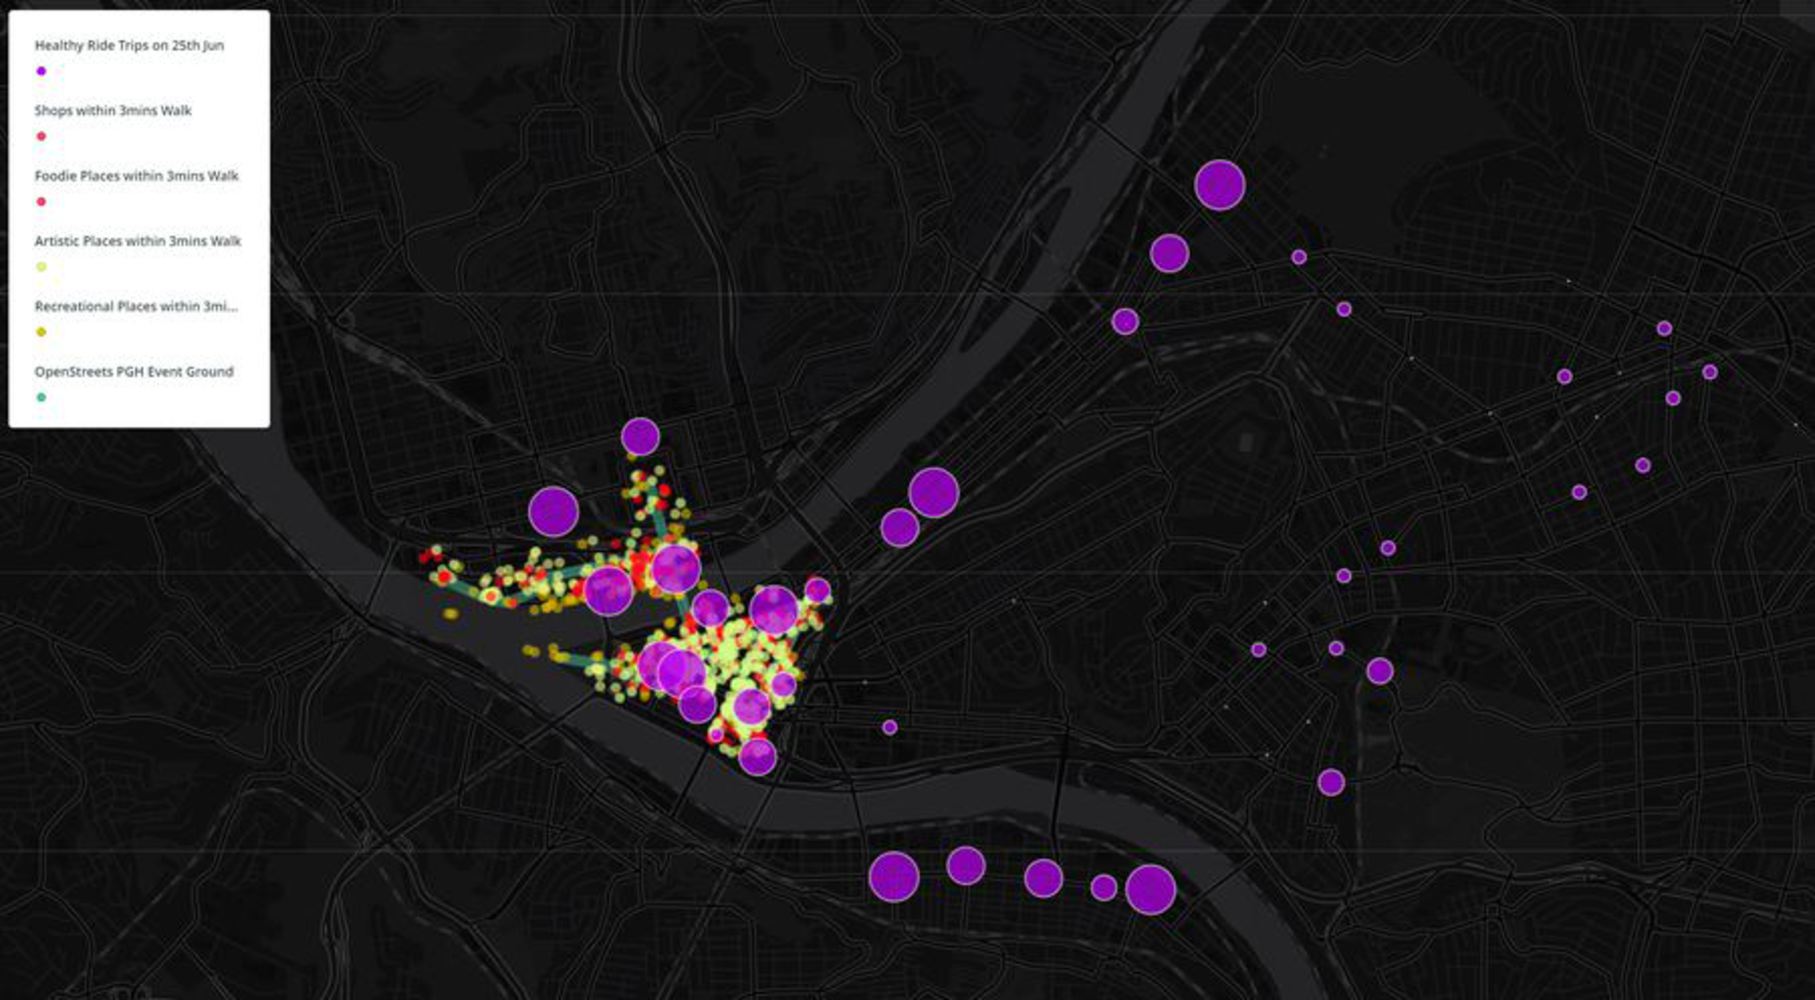
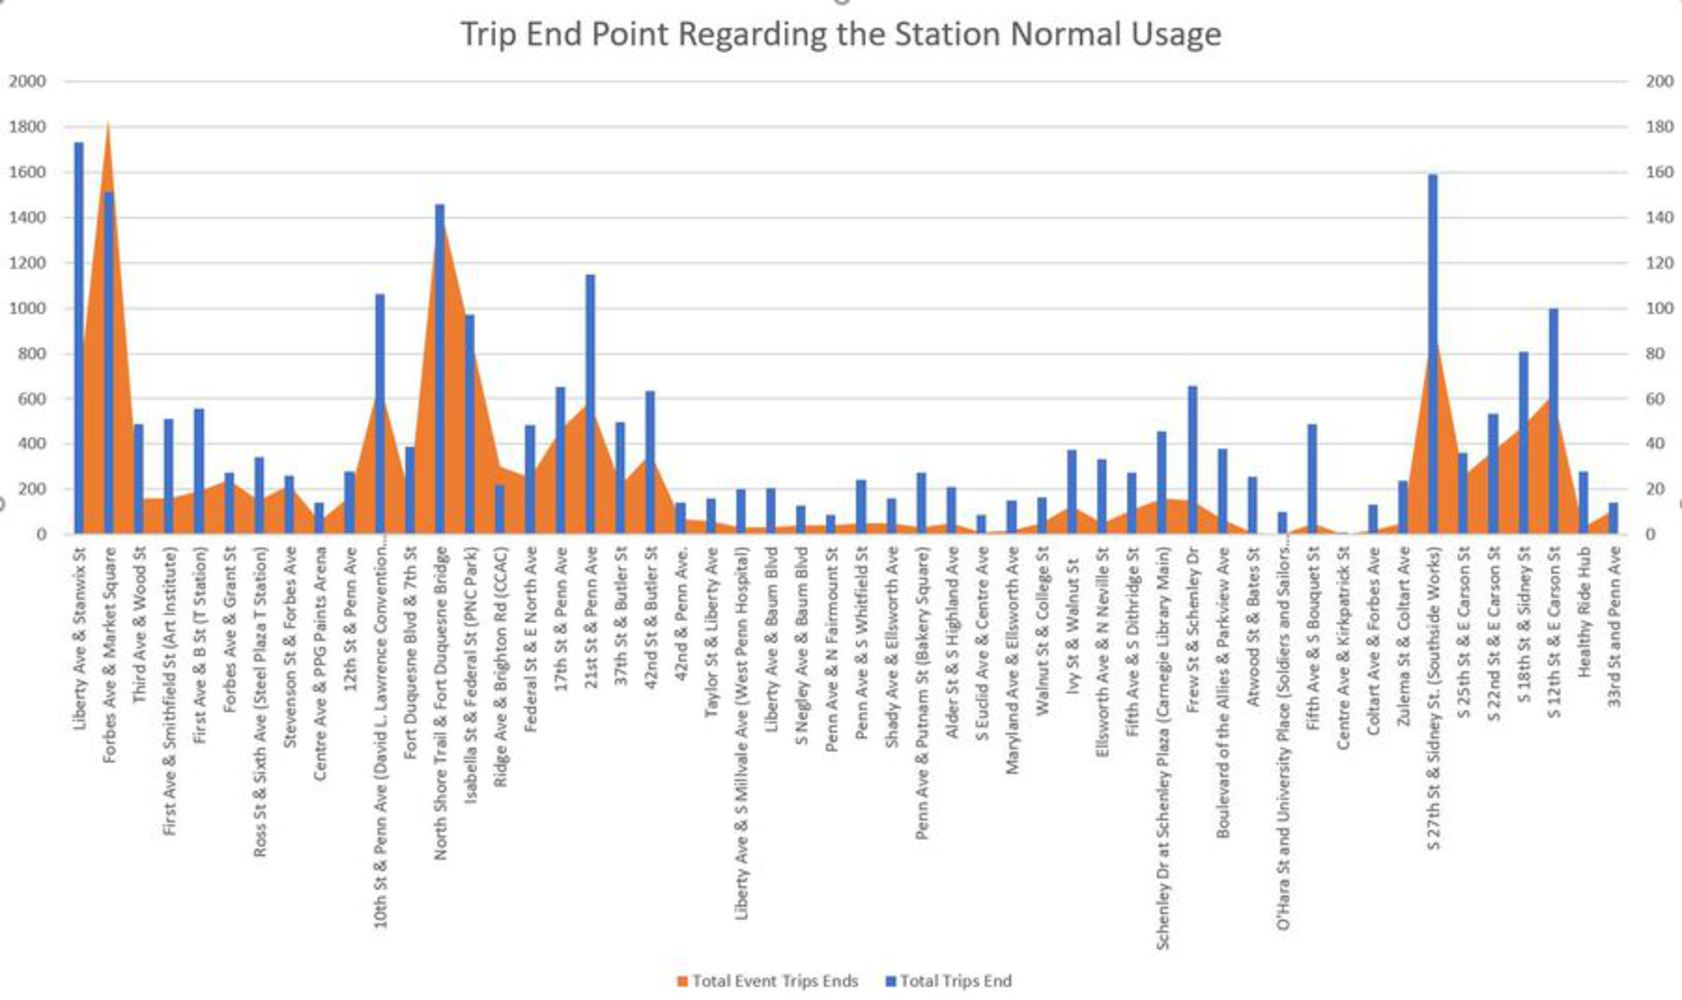
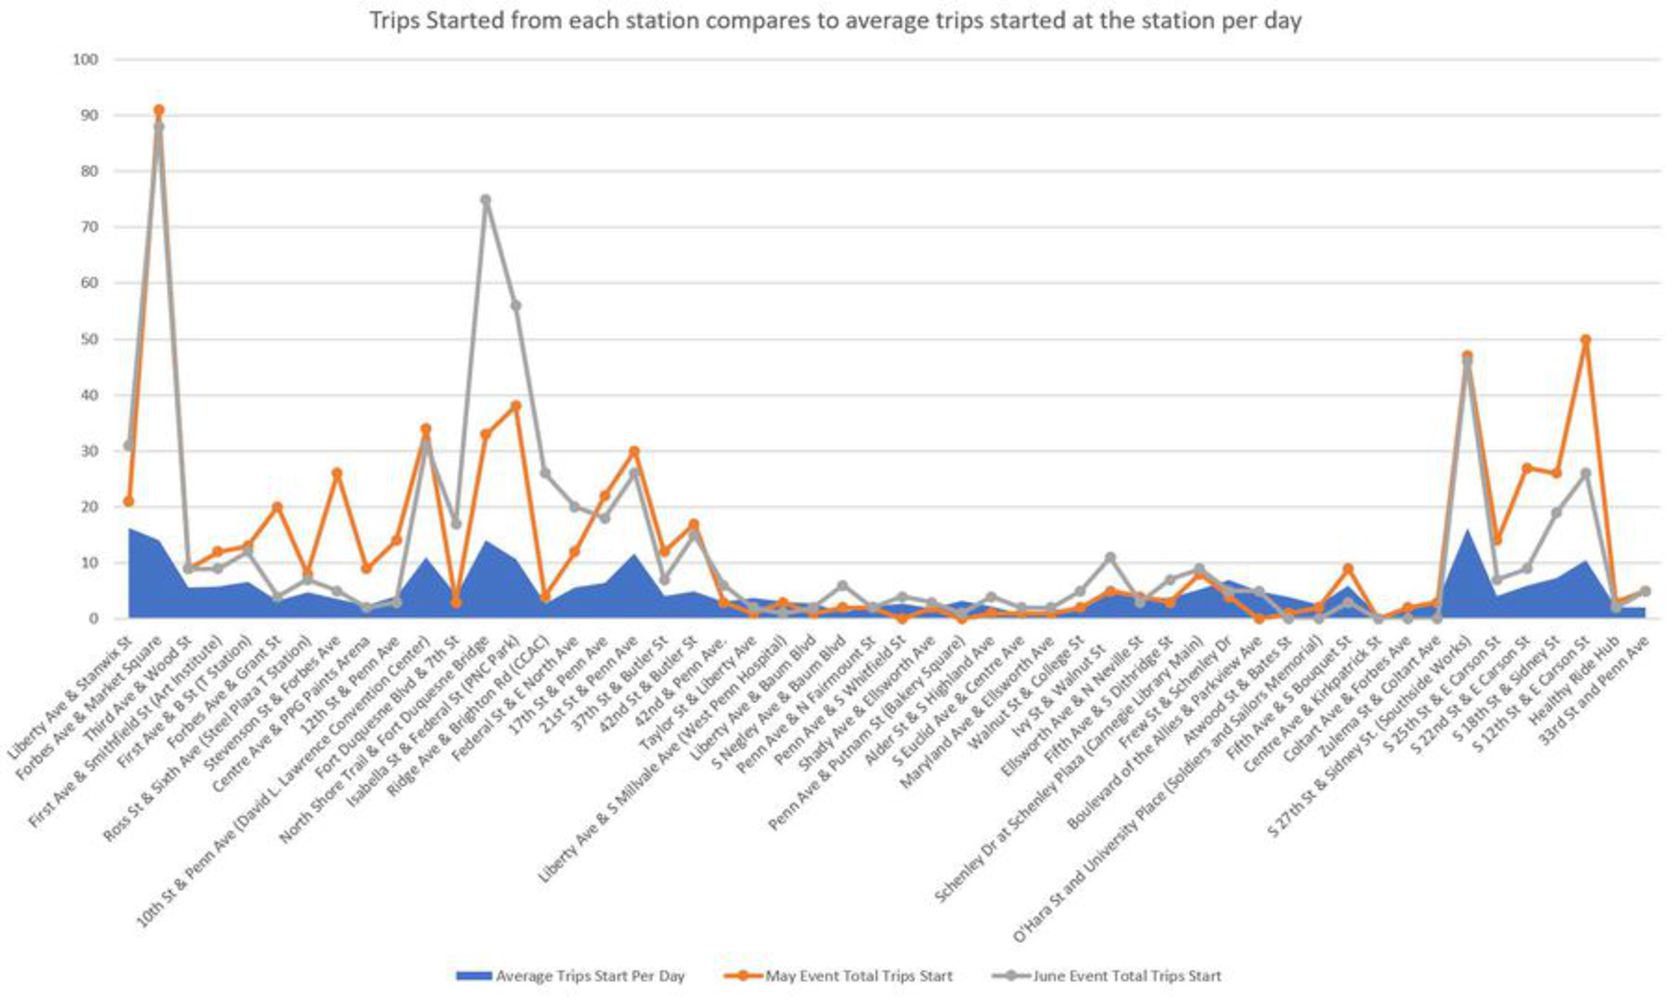
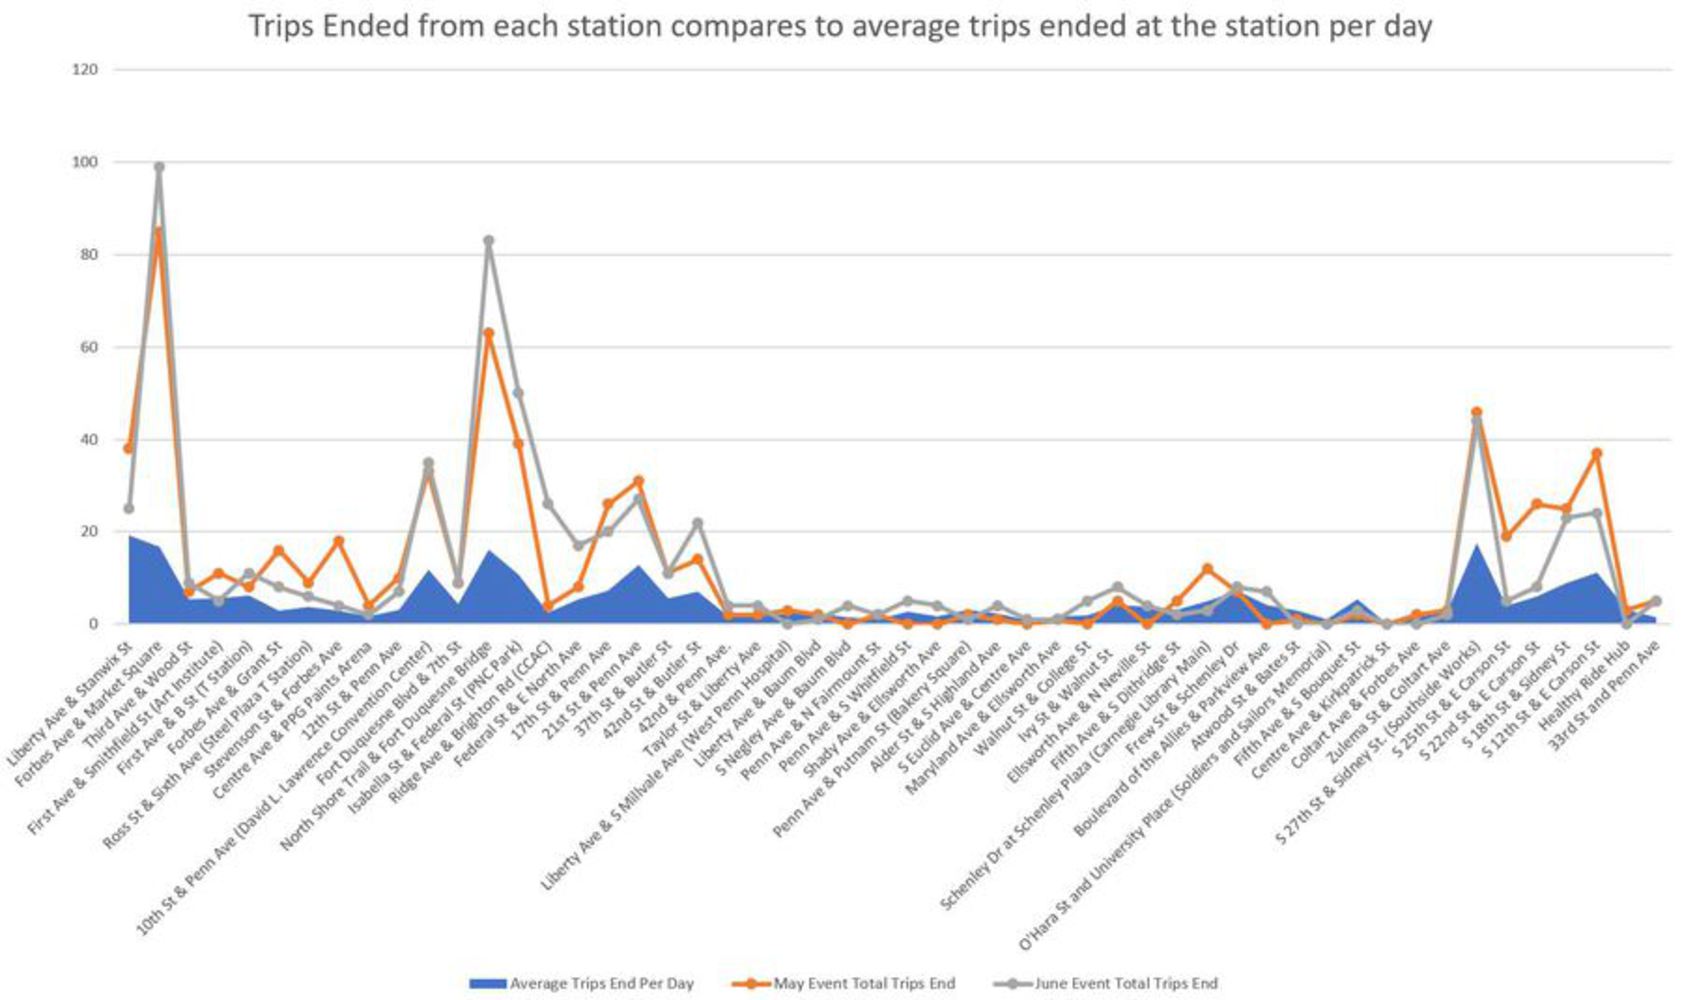
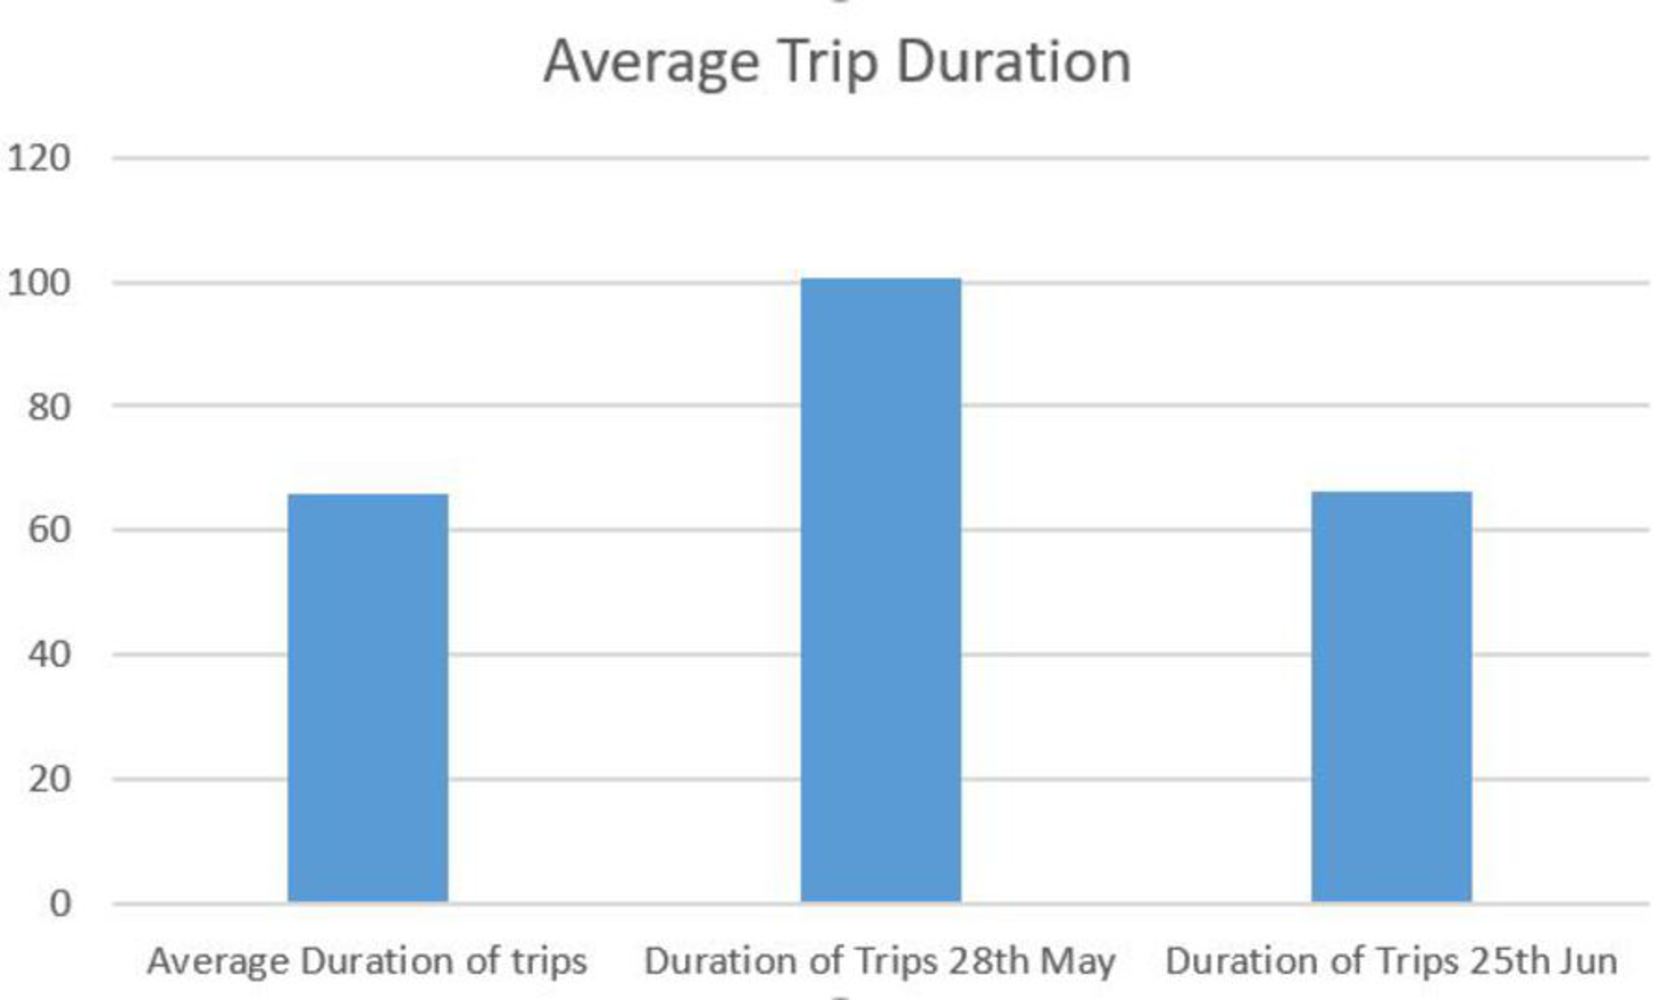
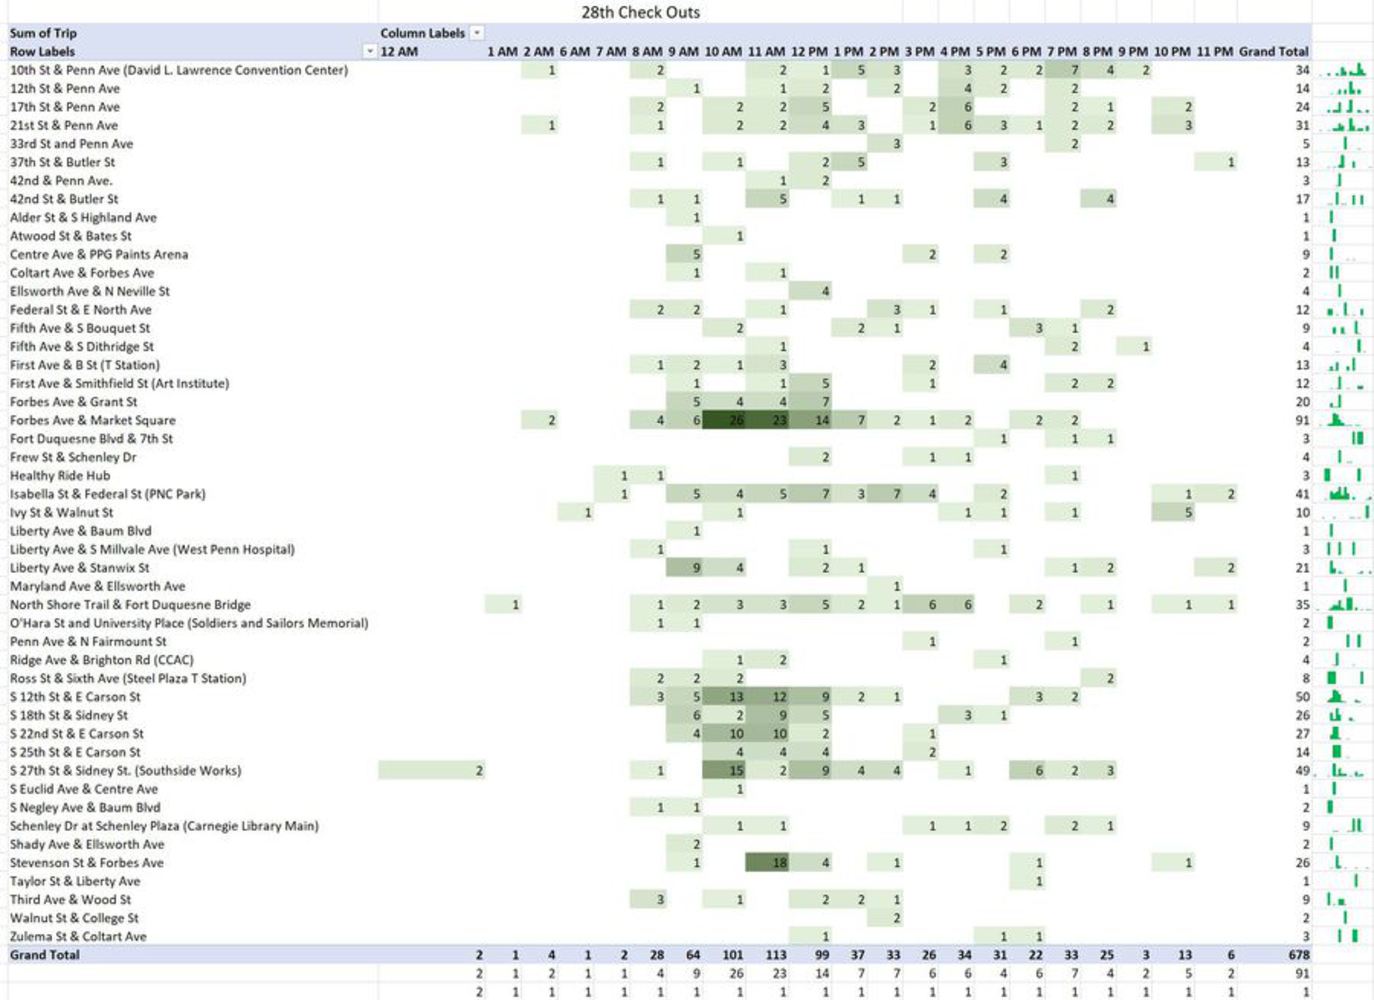
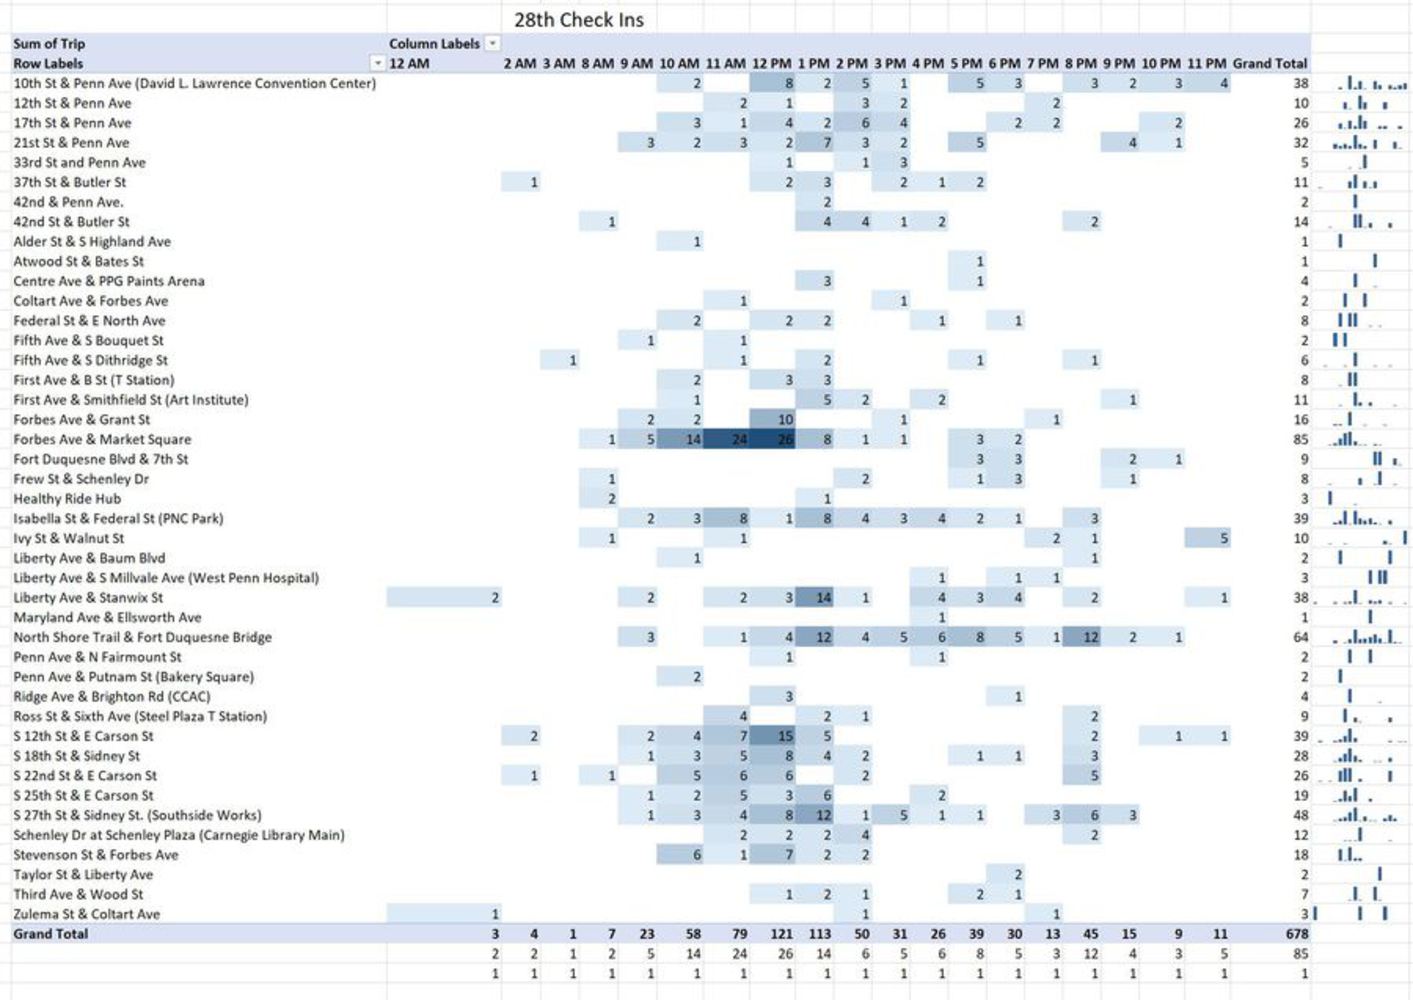
Exploring the Healthy Ride bicycle trips generated in OpenStreet PGH events (May 28th, and June 25th) to see the location correlationship between event spaces(open streets), and other venues around the city. Whether there is a concentration of trip destinations patterns throughout the time of the event.
Created: November 19th, 2017
Exploring the Healthy Ride bicycle trips generated in OpenStreet PGH events (May 28th, and June 25th) to see the location correlationship between event spaces(open streets), and other venues around the city. Whether there is a concentration of trip destinations patterns throughout the time of the event.