Pittsburgh Police Arrest Data
Made by Ankita Patel
Made by Ankita Patel
Are our Neighborhoods really safe?
Created: October 18th, 2017
Whether to reside permantely or to take a stroll around, people are getting more and more conscious about their security. Thus it is important to map the criminal activities in the Pittsburgh. It is said that a lot of these criminal activities happen in secluded areas and in neighborhood which are under developed and mostly black or Asian people are involved in such criminal activities. How true is this? And how does this affect the neighborhood’s reputation?
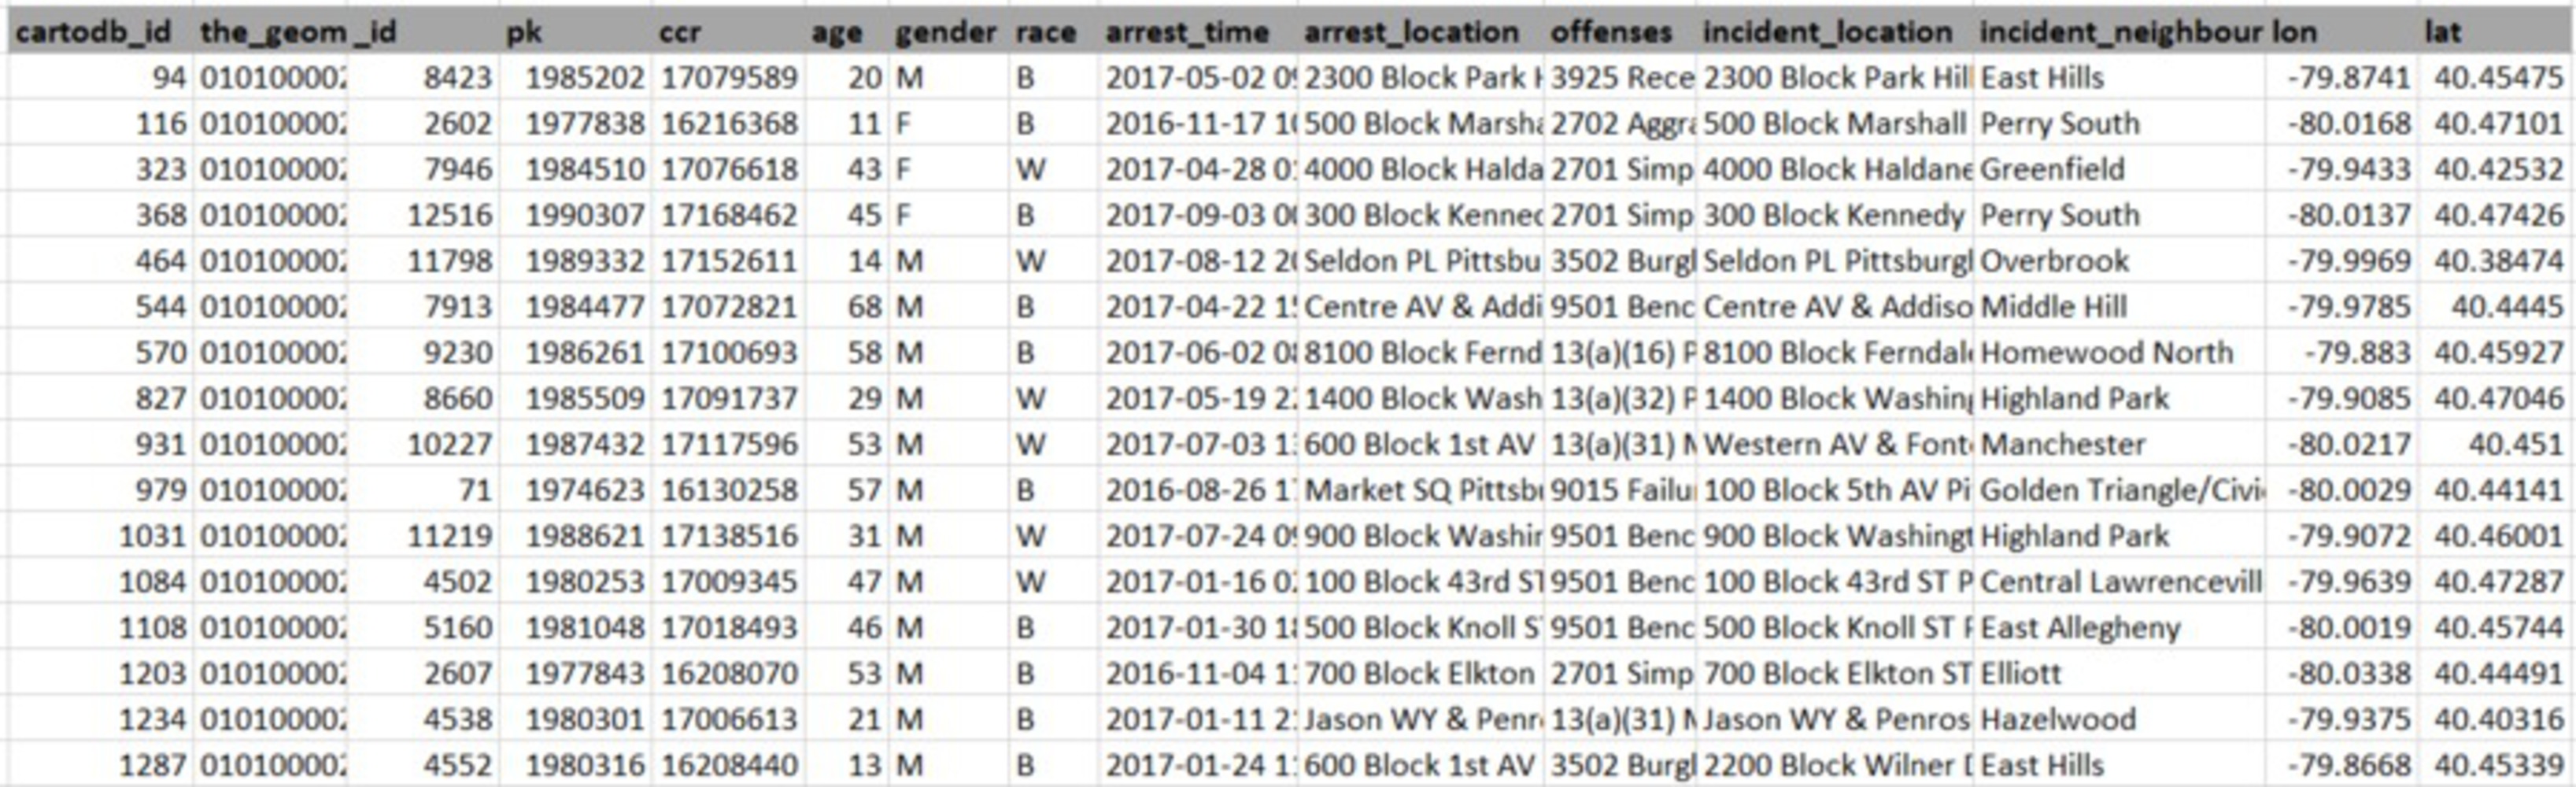
To answer this question, the dataset I used for this exercise is the Police Arrest Data, which is taken from the dataset collection of WPRDC. This Arrest data contains information on people taken into custody by City of Pittsburgh police officers.
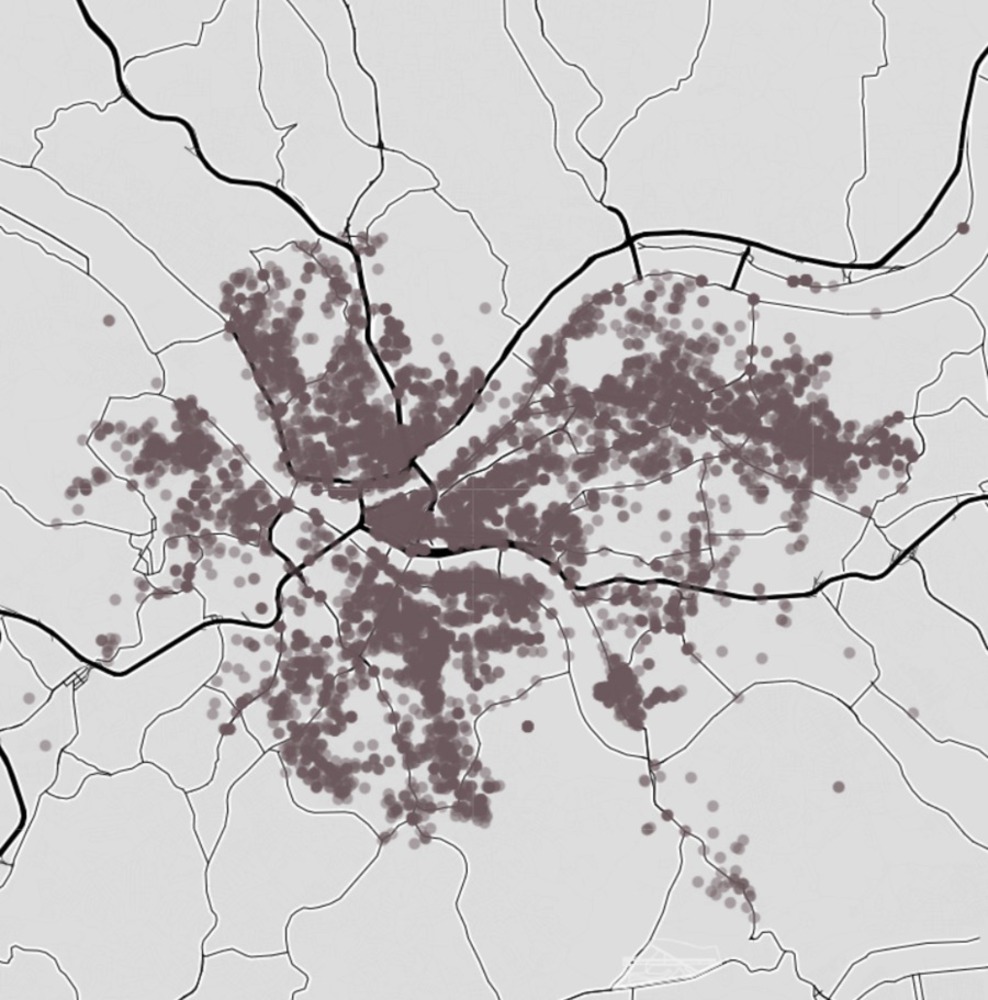
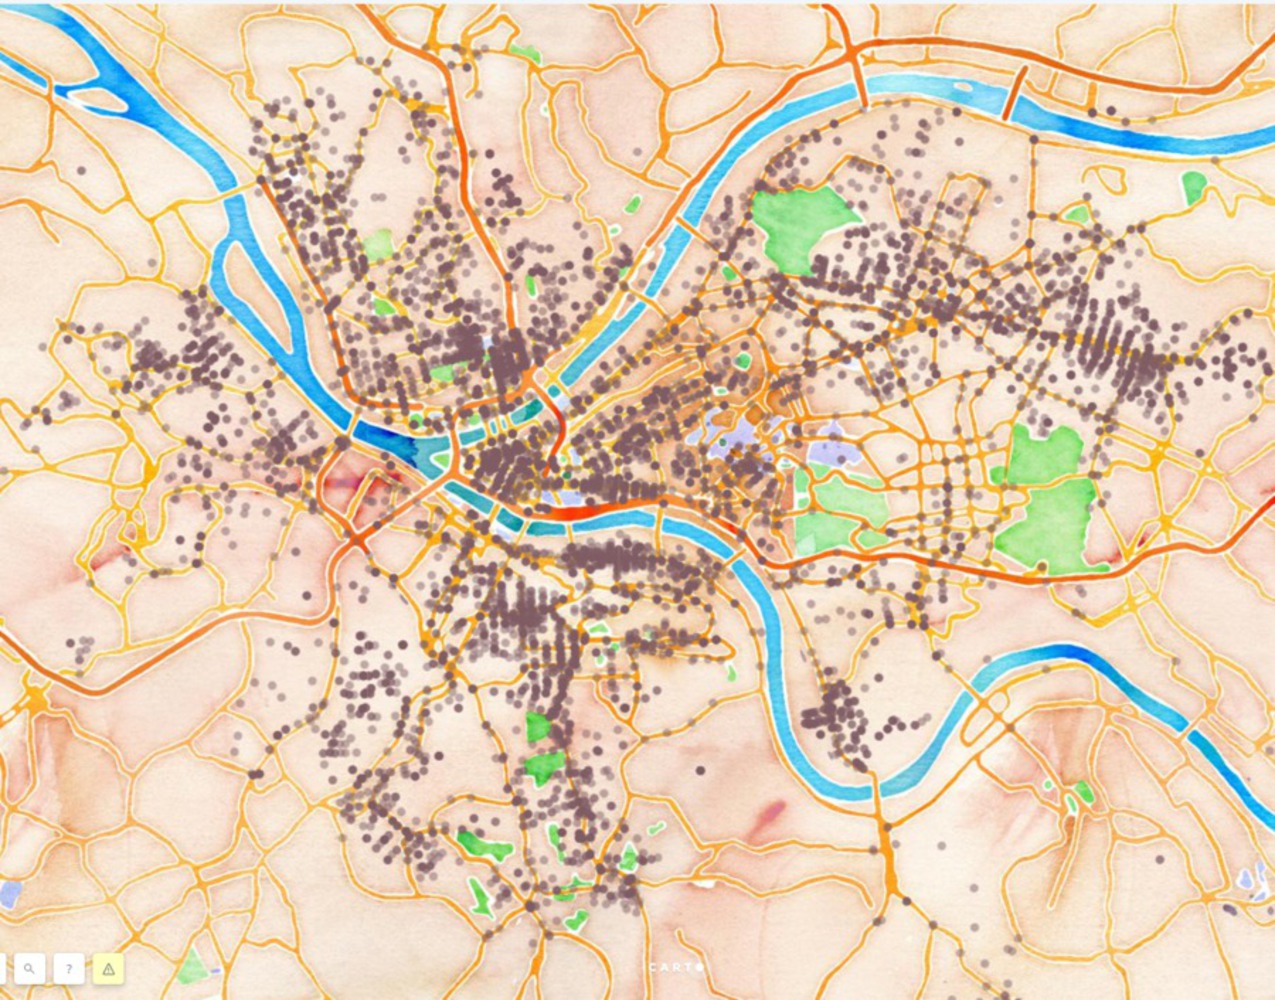
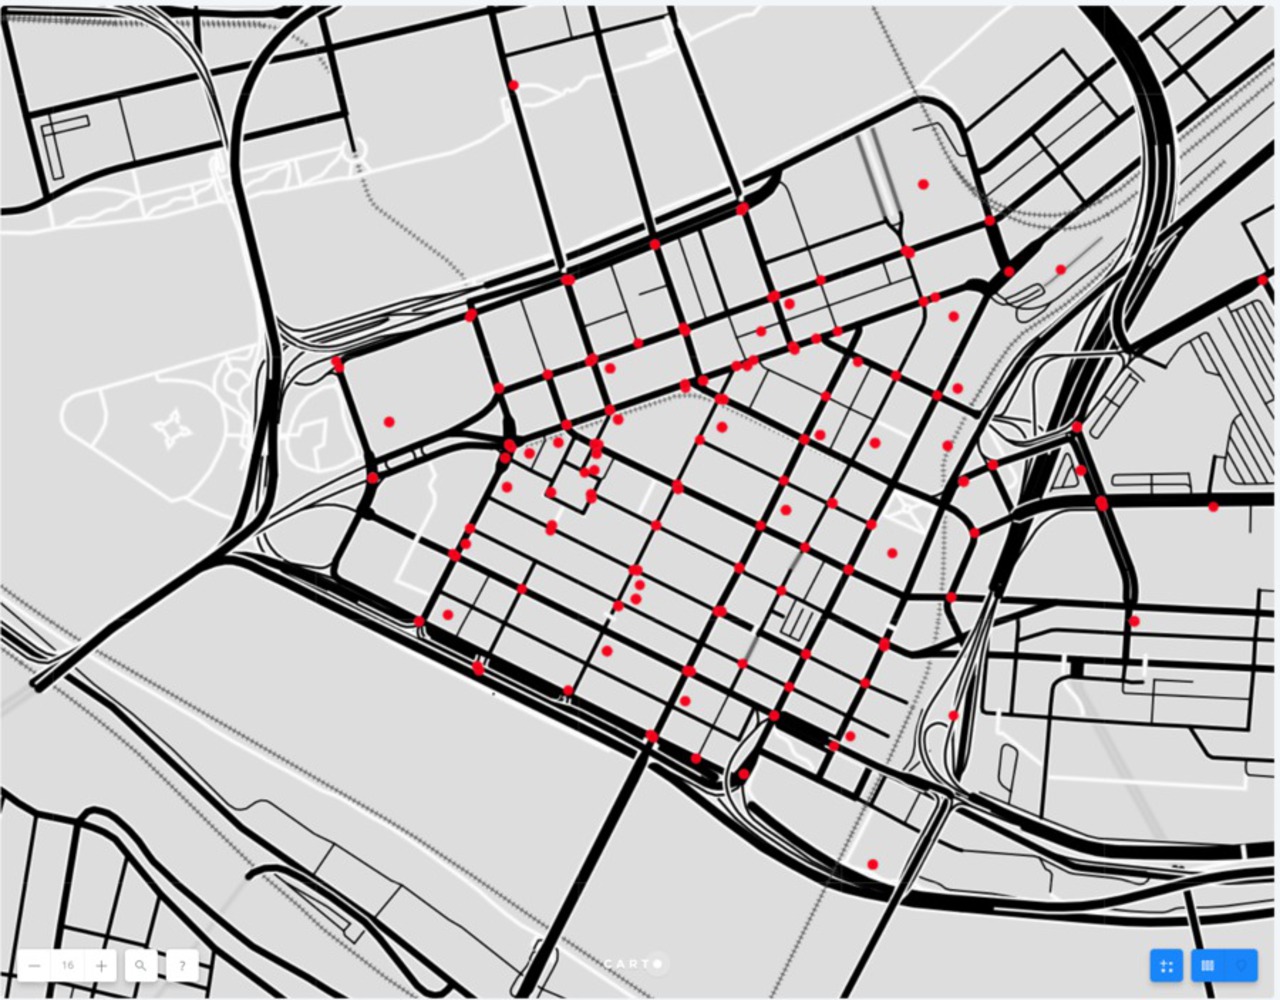
In order to again understanding of the concentration of criminal activities, I created the above caricature map. It was interesting to see that people have been taken into custody almost from every neighborhood. When the Pittsburgh map is removed from the background, it’s the dataset that gives the Pittsburgh map shape. Also it can be seen that the arrest happens more at the center of the city i.e. the most developed neighborhood – central business district.
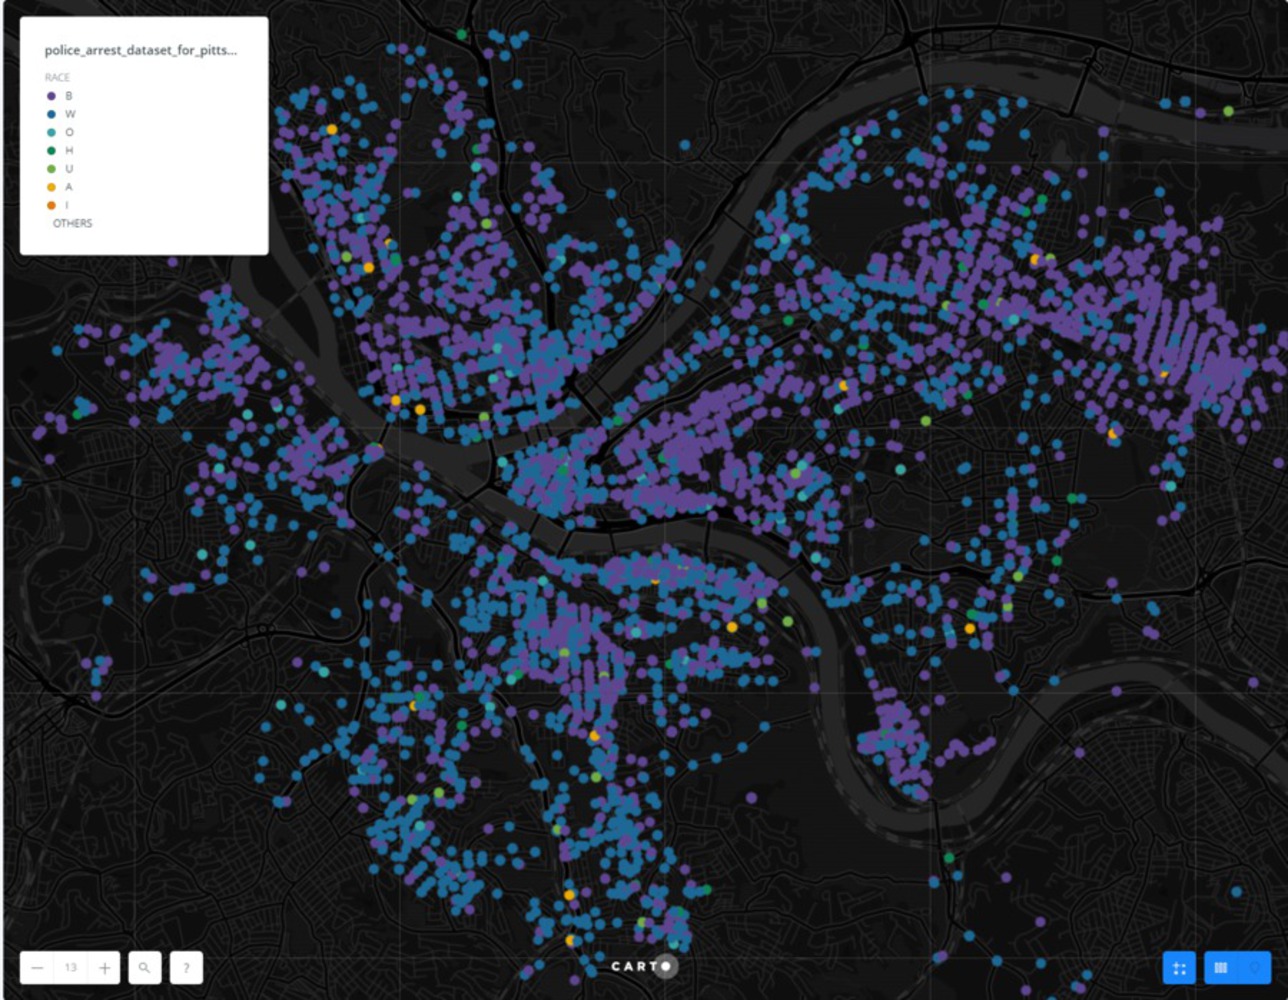
I then zoomed into the Central Business district, where are more no. of arrest to study it closely. It can be observed that most of these arrest happened at the street intersections or on street. Thus this should make
Reflection:
By carrying out this study I understand how effectively carto could be used to make representation in less time. I feel data clearing is what takes a lot of time then making the map.
Also open data plays a huge role in urban design. As many times what we think and see, might not be true. Open data makes things clear and many hidden truths could be revealed through open data7.318 MB · Download / View
Are our Neighborhoods really safe?