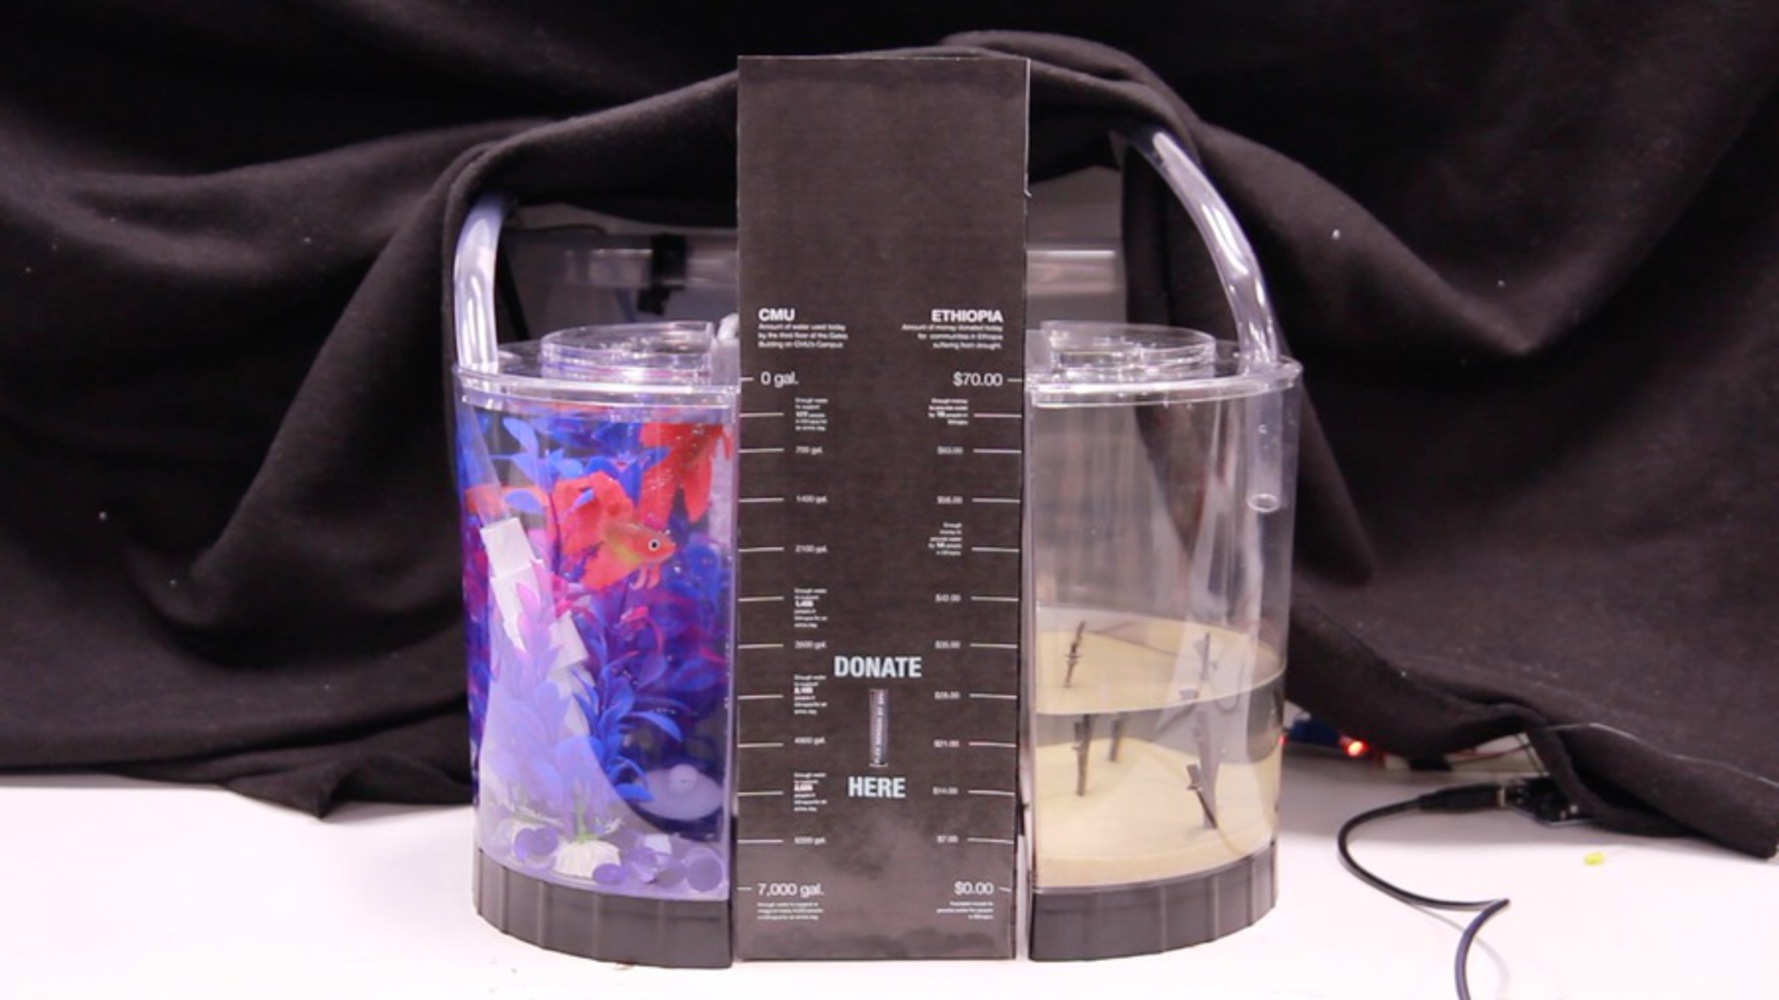
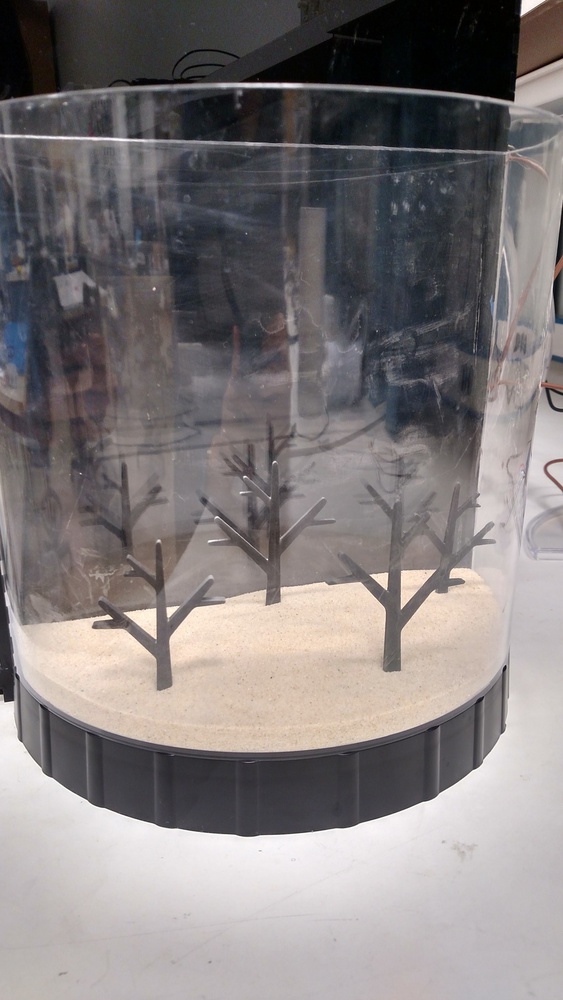
Reservoir
Made by joyceker
Made by joyceker
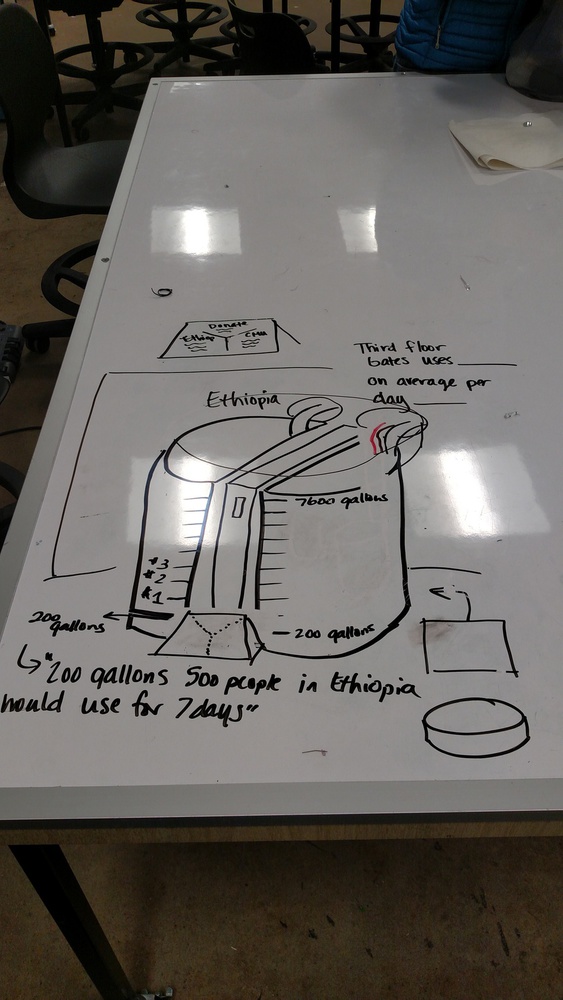
Encourage global awareness of water availability through the comparison of water consumption on 3rd floor Gates to a country undergoing drought.
Created: March 23rd, 2016

How can embedded computation change the way we experience our surroundings? What is the value of creating dynamic spaces? This class will focus on the design and prototyping of reactive spaces. Ove...more
Encourage global awareness of water availability through the comparison of water consumption on 3rd floor Gates to a country undergoing drought.