Summer Food Sites in Woodland Hills School District
Made by Yidan Gong
Made by Yidan Gong
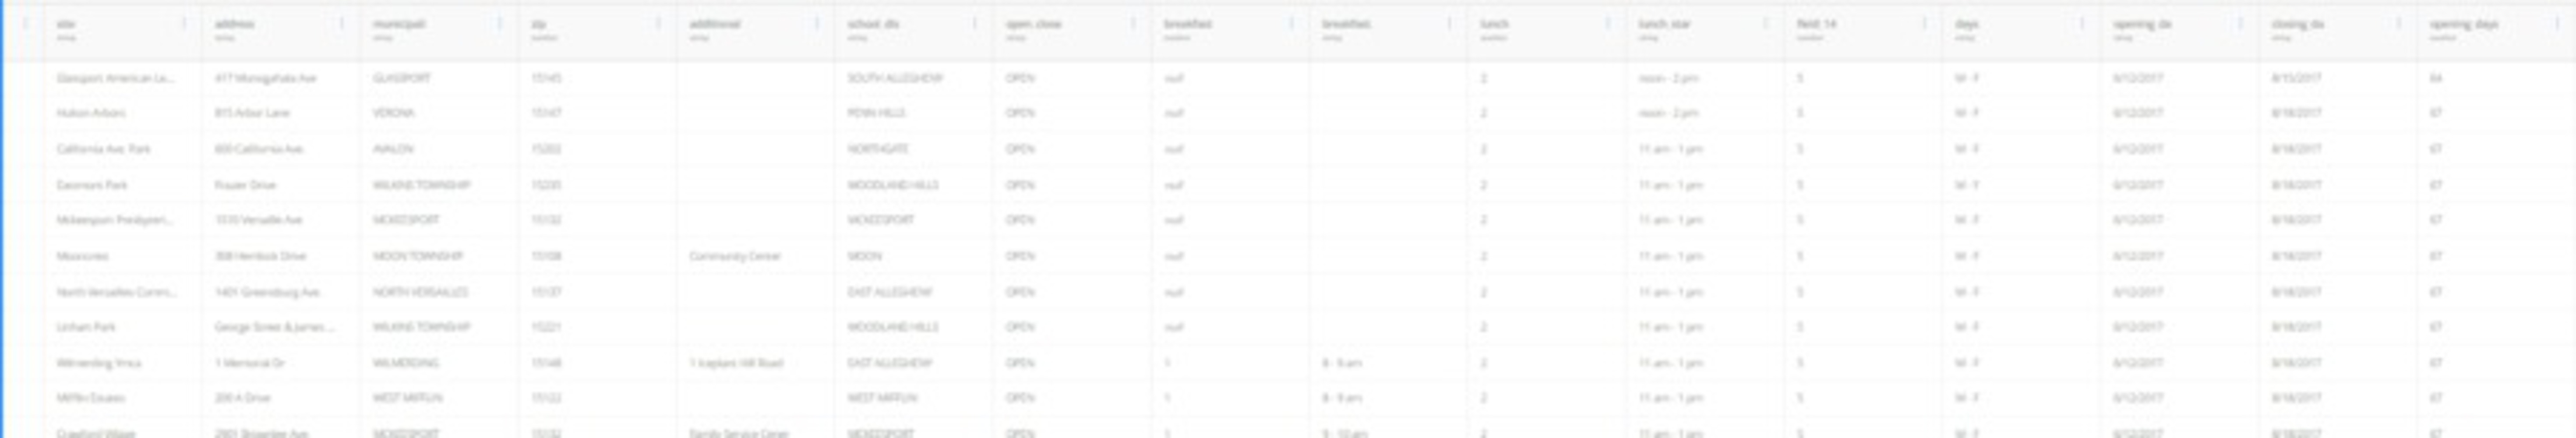
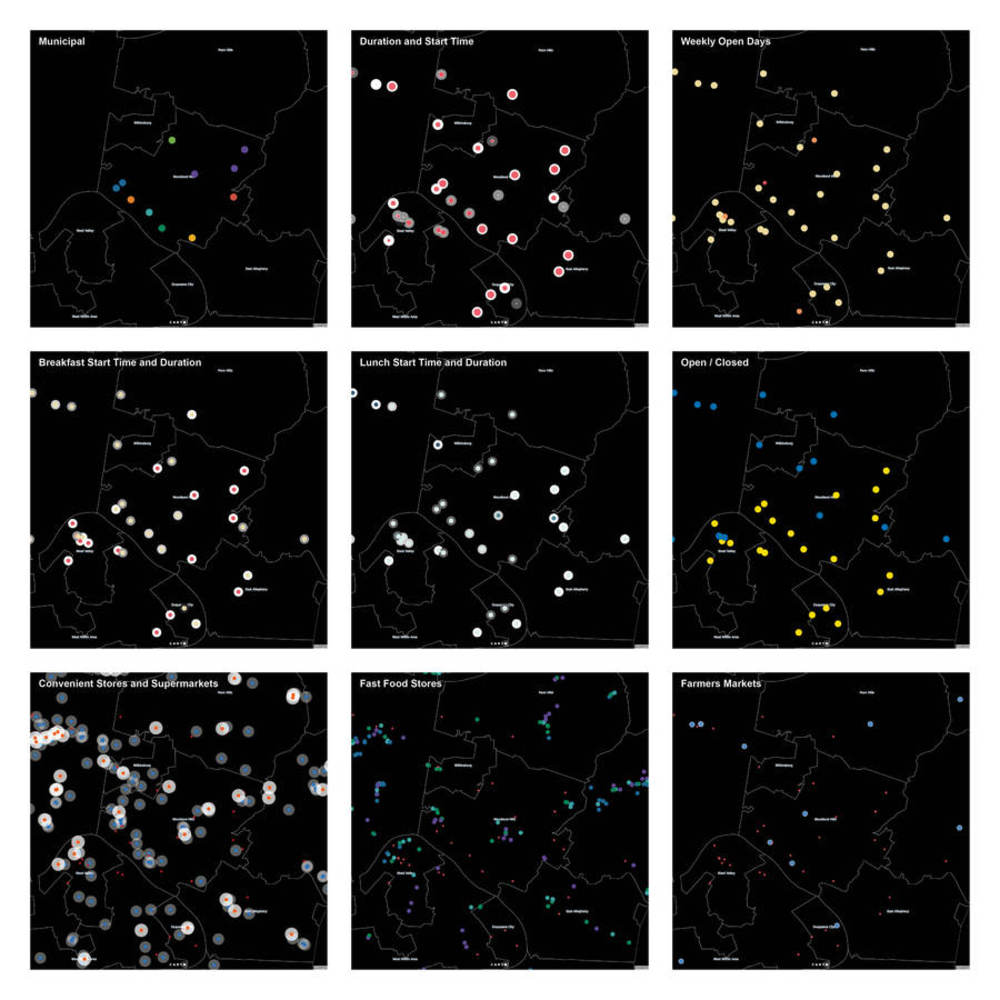
Based on the study of the Summer Food Sites in Allegheny County, I found there is a congregation in Woodland Hills School District. Thus, I zoomed into Woodland Hills to explore how the distribution and characters of food sites are correlated with food resources, such as convenience stores, supermarkets, farmers market and fast food restaurants.
Created: October 5th, 2017
Based on the study of the Summer Food Sites in Allegheny County, I found there is a congregation in Woodland Hills School District. Thus, I zoomed into Woodland Hills to explore how the distribution and characters of food sites are correlated with food resources, such as convenience stores, supermarkets, farmers market and fast food restaurants.