Where's the Water?
Made by Ernest Bellamy
Made by Ernest Bellamy
Looking over three separate neighborhoods within the city of Pittsburgh, where are the public amenities that utilize water and what types are they?
Created: October 6th, 2017
Pittsburgh is a unique city that has interesting water features for its residents. From my own personal experiences throughout the city, I've witnessed some of these elements freely flowing (like spray features and water fountains) and have always wondered where the totality of these features are. It is from here where I began my investigation into where all the publicly accessible water features are within the city limits, and to take a sampling from three different parts of Pittsburgh.
For this study, I used three different datasets:
City of Pittsburgh water features, City of Pittsburgh Pools, and Pittsburgh Neighborhoods
I utilized SQL for all three Datasets in order to better understand the three neighborhoods I investigated.
within the Dataset for City of Pittsburgh Water features, I conducted a search of the named water features and queried 'Spray' features, and 'Decorative' water features, utilizing the following codes
ELECT * FROM ebellamy.table_513290a6_2bac_4e41_8029_354cbda6a7b7_2
WHERE feature_type ilike 'spray'
and
ELECT * FROM ebellamy.table_513290a6_2bac_4e41_8029_354cbda6a7b7_2
WHERE feature_type ilike 'decorative'
With City of Pittsburgh Pools, while isolated from the rest of the water features of the other dataset and not really needing to be queried, I still ran the following code
ELECT * FROM ebellamy .table_5cc254fe_2cbd_4912_9f44_2f95f0beea9a_1
WHERE feature_type ilike ‘pool’
Lastly, with the Pittsburgh Neighborhoods dataset, I queried the neighborhoods of East Liberty, on the Eastside; Observatory Hill, on the Northside; and Elliott, on the Southside, with the following code.
SELECT * FROM ebellamy.pittsburgh_neighborhoods
WHERE HOOD ILIKE 'OBSERVATORY HILL'
OR HOOD ILIKE 'EAST LIBERTY'
OR HOOD ILIKE 'ELLIOTT'
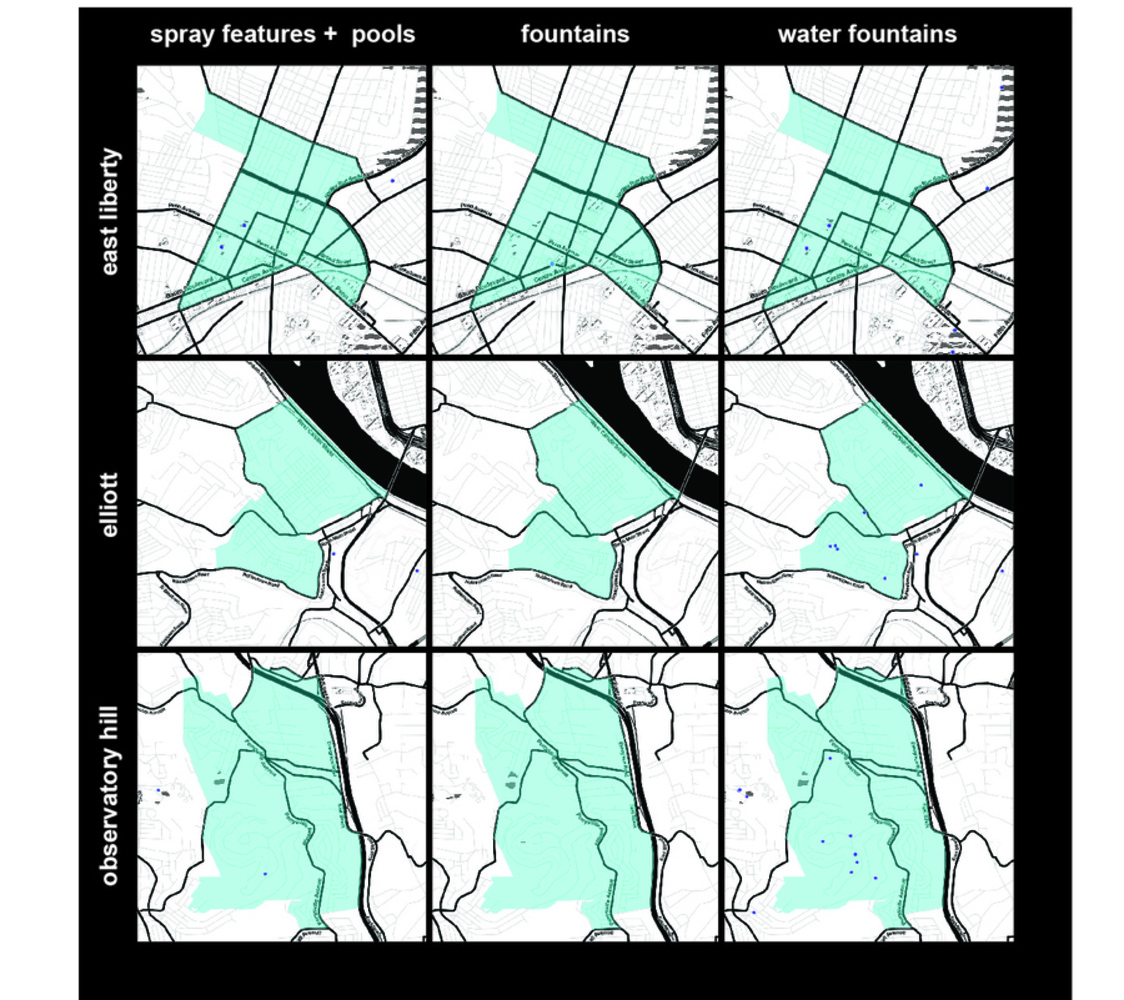
The following is the 3x3 grid format of the about described datasets.
The selection of the colors was tricky, and something I played around with for a bit. Additionally, the size of the points for the each pin could've been bigger for this produced visualization. Within Carto everything looked fine, but after formatting this image, things seemed a bit too small.
Overall, I'm satisfied with the representation.
Is there a middle ground between representation of data and accuracy?
Yes, of course. especially if there are multiple objects near or on top of each other, as was the case here.
How do you define the line between caricature and exaggeration?
The size of these points of identification for features could easily overwhelm a map making it confusing it they were too big or too small. Additionally, color selection of overlays like neighborhoods could alter the appearance of the points. Lastly, order of the datasets, plays a pivotal role in clarity, placing the wrong dataset above another can mask it's intent.
To what extent should we caricature the data of city?
To the point of clarity, as mentioned above. It's a fine line to walk between clarity and confusion, we must stay cognizant of that as we gather data and develop maps.
Looking over three separate neighborhoods within the city of Pittsburgh, where are the public amenities that utilize water and what types are they?