Back to Parent

Outcome


MOTIVATIONS : 

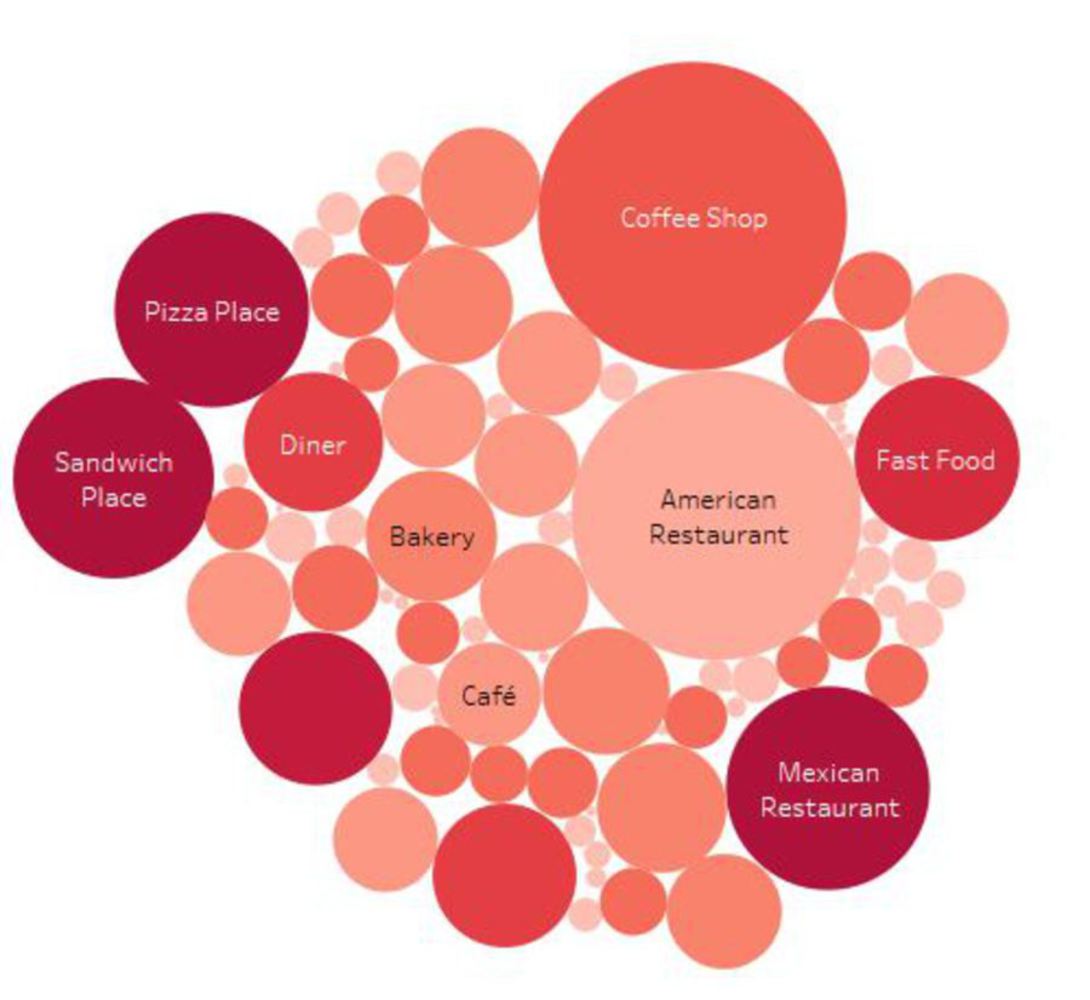
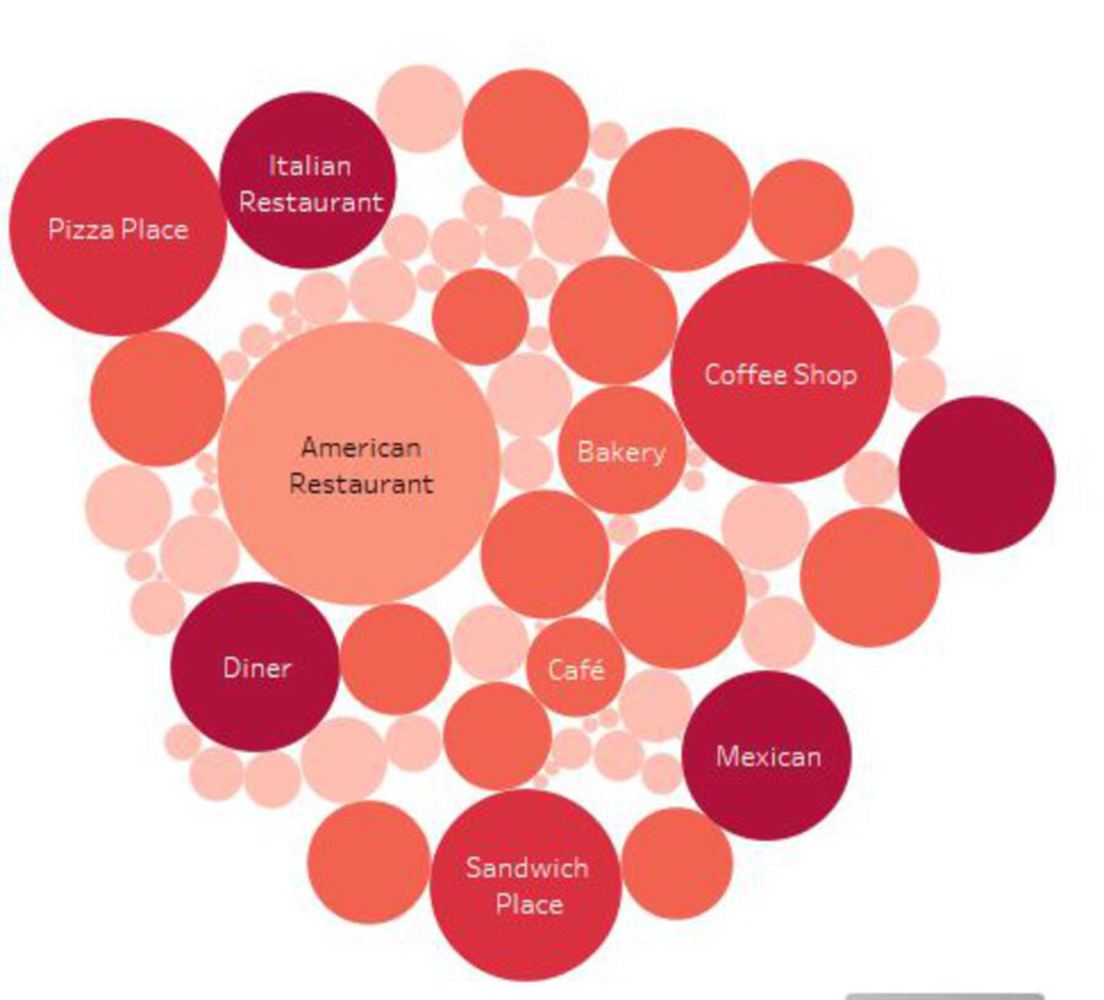
Through my stay in Pittsburgh for past 1 year, observing that places like Squirrel Hill which are dominated by Jewish residents since ages have more of Chinese restaurants, seeing many Indians prefer eating Mexican food on a routine basis and similarly studying at American University, I see many of American colleagues, eating more Indian food on daily basis then I do being an Indian. This sort of variations in peoples choice and preference brings this question to my mind. Living in a such a diverse city, I wanted to know Pittsburgh is dominated by what type of cuisine, and which most of the people prefer. 

DATASET USED : 

For this project, I used the dataset which was scraped from Foursquare. I choose to work with the data what which was categorized specially for all sorts food in Pittsburghs. 

PROCESS :

To explore the idea of finding the taste of Pittsburgh, I choose to use the K-mean clustering method, as cartographic represntation of huge no. would best answer my question. 

I filtered the .csv file to the required data. 

Screen shot 2017 10 30 at 3.22.21 am.thumb
Show Advanced Options
34.jpg.thumb
Show Advanced Options

Each circle represents a wide category of food such as restaurants, coffee shops, fast food etc , while the size of the of circles indicate the number of checkin counts. 

34.1.jpg.thumb
Show Advanced Options
Hgcjhm b.jpg.thumb
Show Advanced Options

The second clustering was done, using the Tip count. It was interesting learn that the tip count did not align with the checkin or number of users count. The clusters  sizes change according to the tipping counts and many restaurants which are small points, become bigger here. 

Szfdv sfvbswr.jpg.thumb
Show Advanced Options

After, studying the broad category. I choose to study in detail just the types of restaurants categorized by the type of cuisine they serve by the checkin counts.

It can be inferred from the data, that what see is not always true. The most preferred food is American followed by Mexican and then Chinese. I was surprised to learn that inspite of the huge number of Indians, there is no single checkin in Indian restaurant. 

3.thumb
Show Advanced Options
Sheet 1.thumb
Show Advanced Options

To further check the hypothesis whether to see the correlation of the count and tip count I tried clustering with a smaller number and using them as sum and average. Thus one can see from both the clusters that the American restaurants have less tip count but the higher number of user count. 

2.thumb
Show Advanced Options

I further plotted it on a scatter plot to check for a various cluster. It can be seen that most of the clusters have tip countless with the growing user base while some have a less more tip count but high user base. This raises altogether new questions whether is it because the restaurants are cheap and have more people going and less tip count or whether because high end restaurant have generally less people going but the tip count is always high. 

This mapping definitely helps to find the trend

LESSONS LEARNED : 

Clustering is a great method to represent quantitative data and easy to draw inferences. 

It would be better if there could be away to show one or more dimensions to the one particular diagram. 

Drop files here or click to select

You can upload files of up to 20MB using this form.