Intention
I would like to peel out the information of HealthyBikes Rides in terms of weather and geographic location. To explore whether precipitation, temperature, and wind influence on the usage of HealthyBikes and where to use them.
I used datasets made available by the Western Pennsylvania Regional Data Center (WPRDC) for the Healthy Ride Trip Data. Available at https://data.wprdc.org/dataset/healthyride-trip-data. My dataset ranges from 07/01/2015 to 09/30/2015 and includes 38,109 trips taken from 492 bikes from 51 stations in the Pittsburgh region. On average a trip lasted 59 minutes with a maximum length of 1.99 days and the shortest ride lasting just 50 seconds.
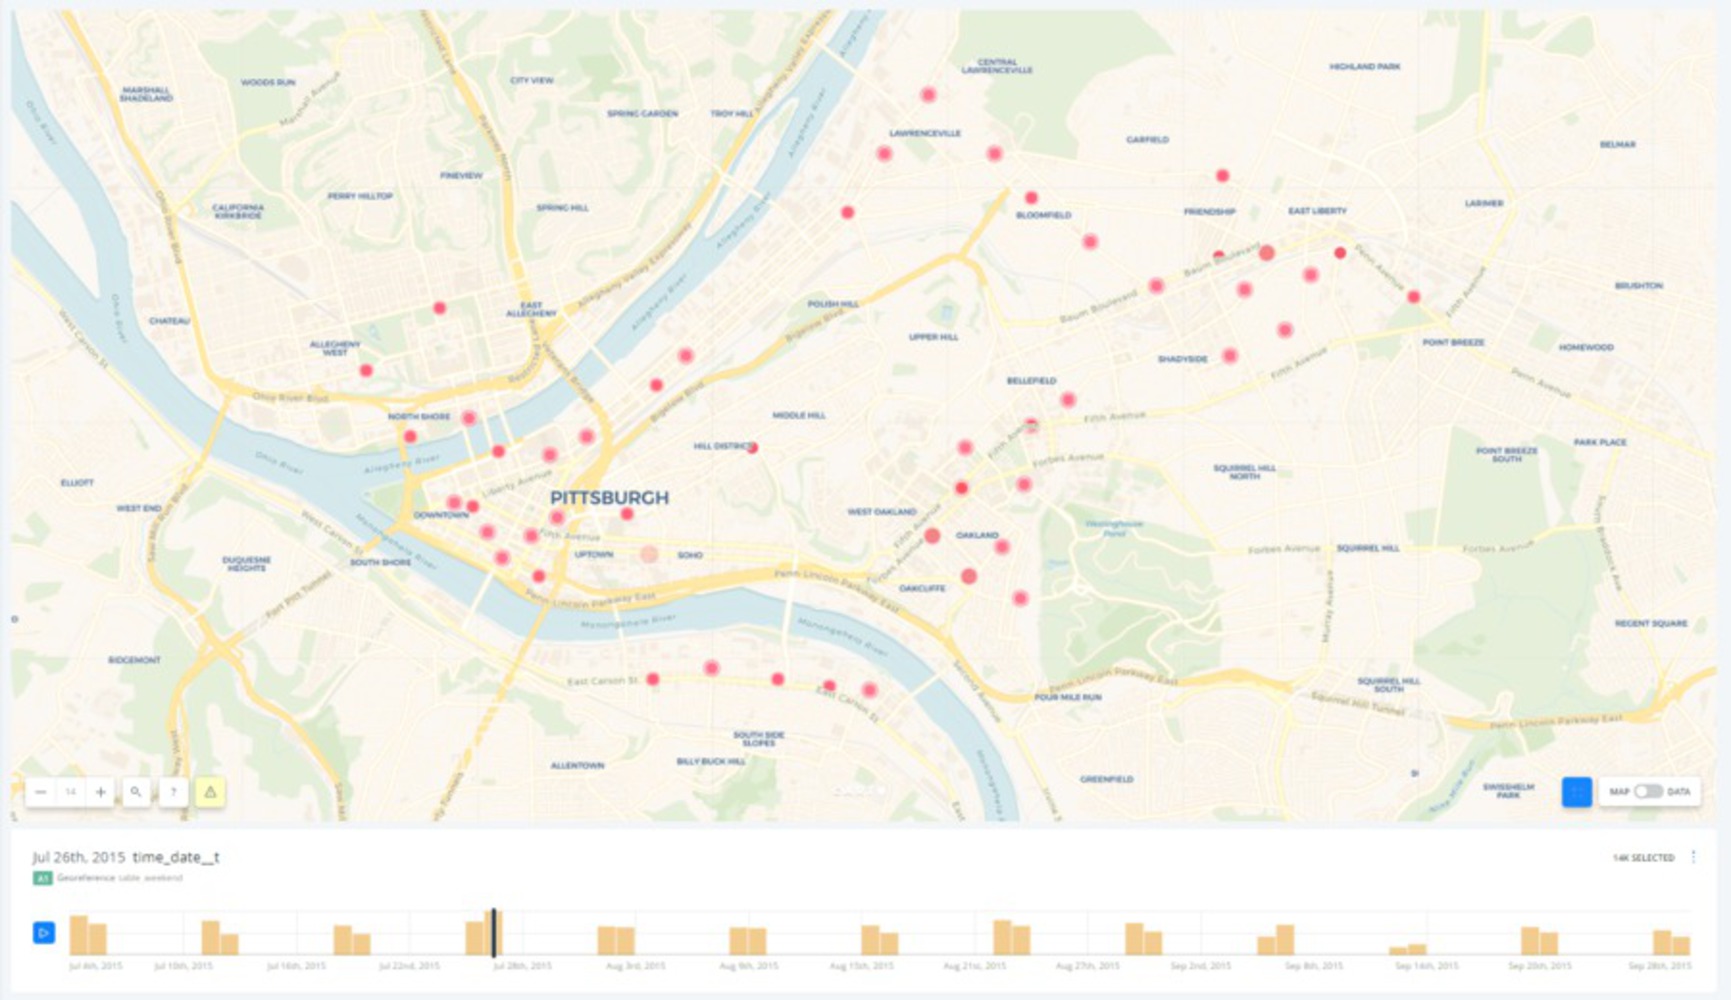
Based on the analysis that I conducted last week, it seems that every weekend the number of trips will increase, thus I selected weekend as the study objects. First, I filtered the weekend data sets and animated them in time series showing that 09/12-09/13 are the least active dates and 07/25-07/26 are the most active dates.
https://carnegiemellon.carto.com/u/yidan-g/builder/f89c533b-8d82-40d7-a4a6-33c83edcfad7/embed
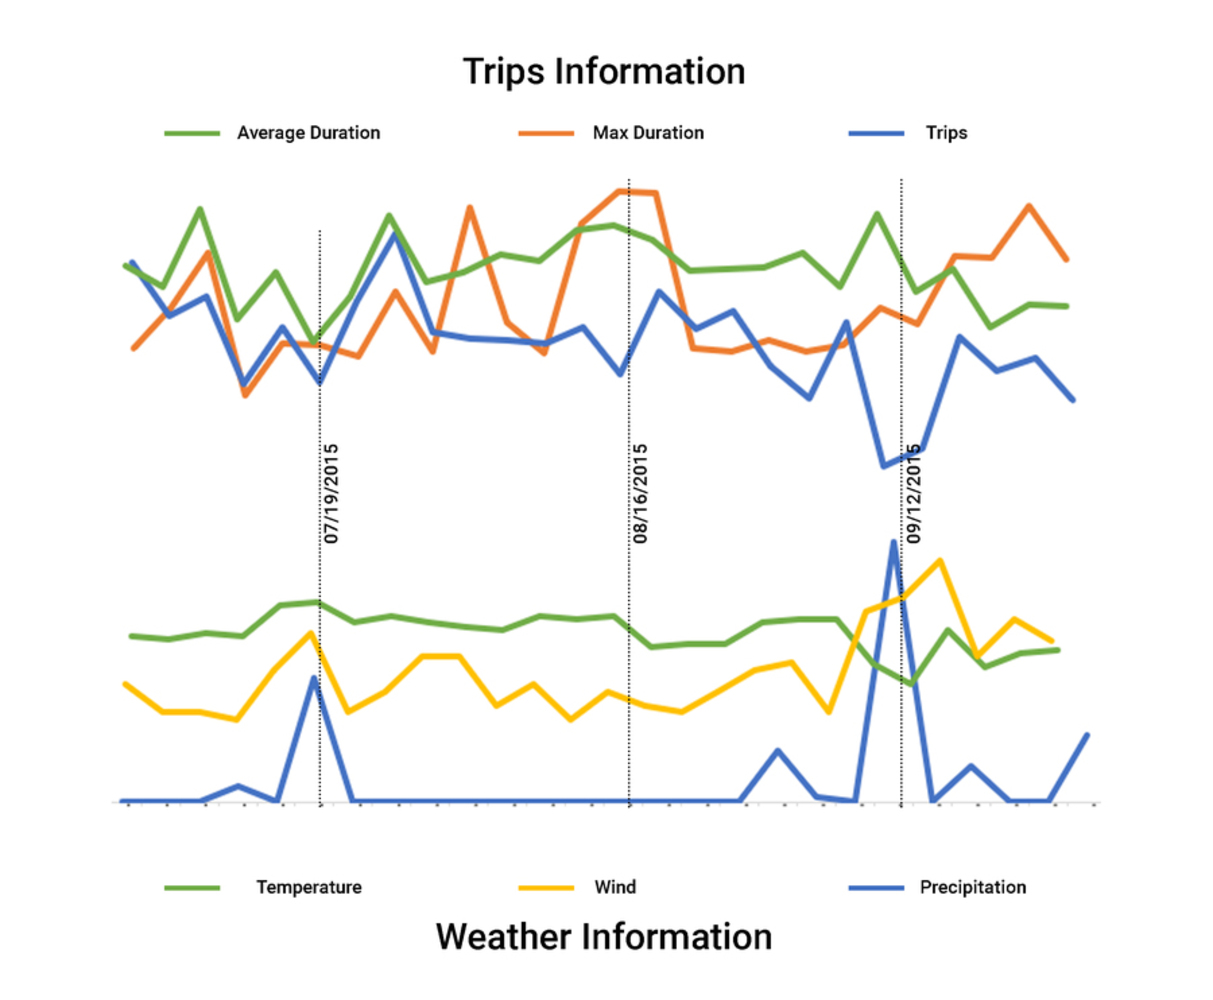
I tried to explore the correlations between trips and weather. First, I plot out the trips information and weather information to find out the outliers as the potential study objects. Compared the two sets of lines, it is obvious to see find out the three outliers: 07/19/2015, few trips with rainy, windy and hot weather; 08/16/2015, few but long trips with decreasing temperature; 09/12/2015, few trips with rainy, windy and cooler weather.
Then I started to zoom into these three days to find out the distribution of trips of each day. I used the grouped data and explored the movement of each bike in these three days.
https://carnegiemellon.carto.com/u/yidan-g/builder/9f4bb5bf-320c-4b63-8674-9ac5b4e73b8b/embed
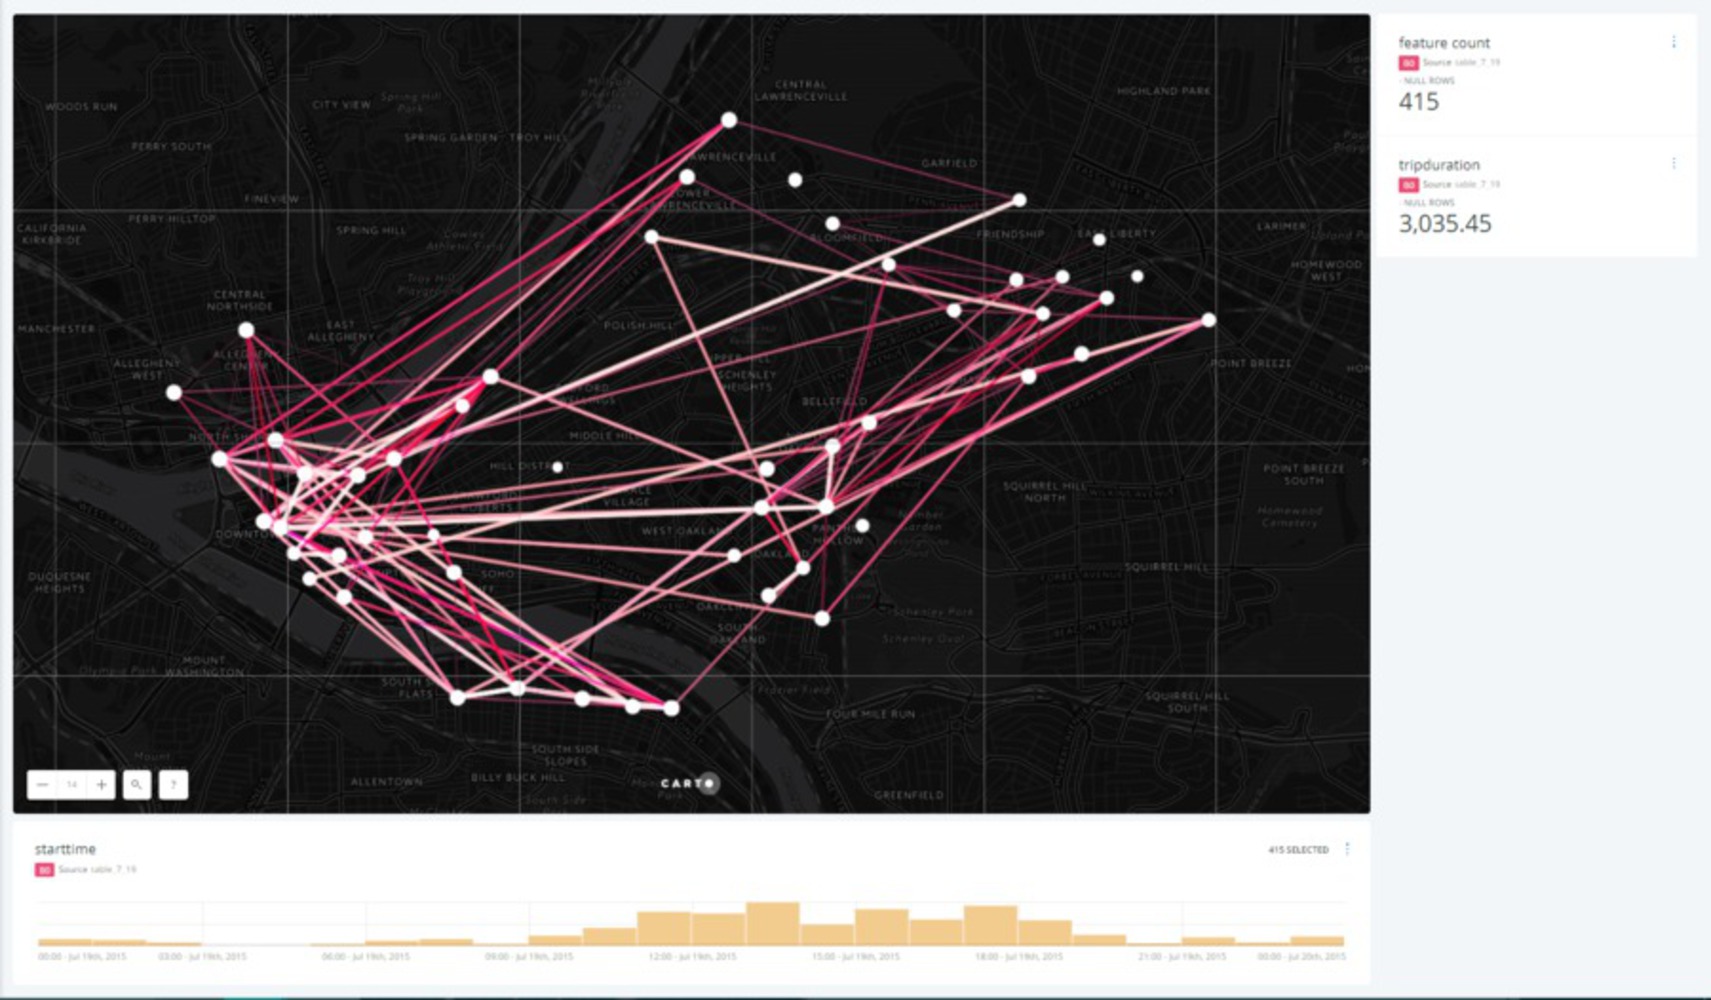
07/19/2015 Few trips with rainy, windy and hot weather
There was a strong connection between Oakland and Shadyside, and still active trips in Downtown.
https://carnegiemellon.carto.com/u/yidan-g/builder/53f2b215-8a26-4d20-bb30-ff39d409bce3/embed
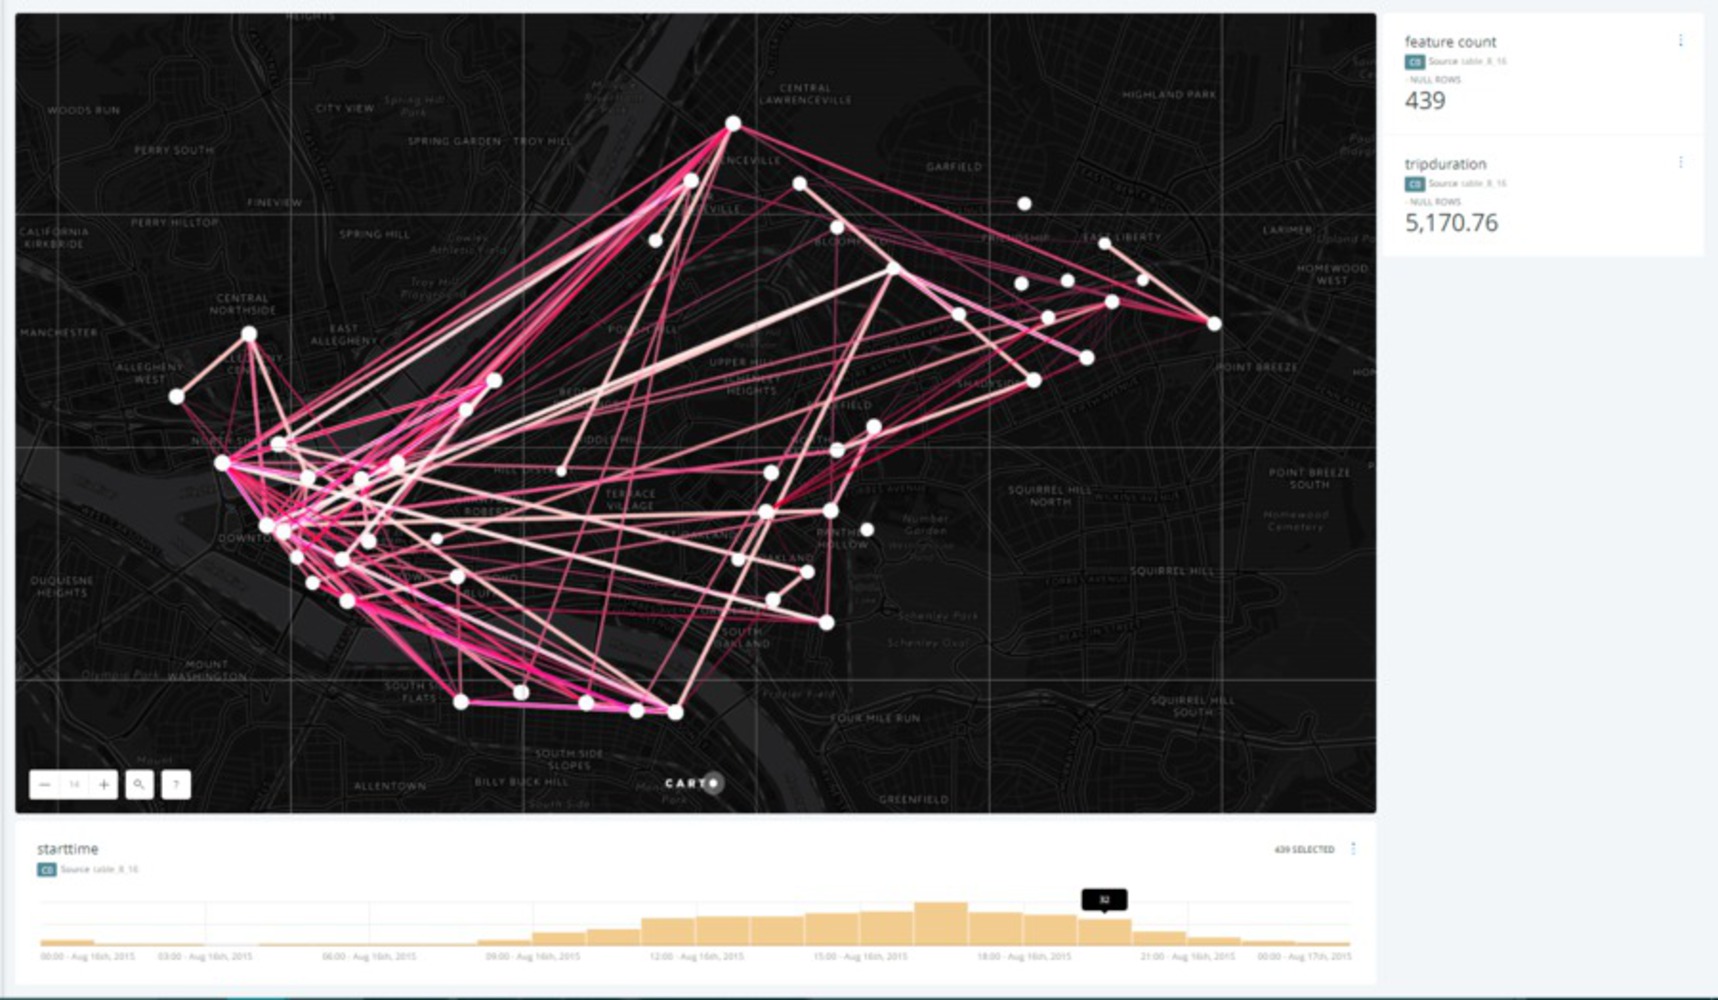
08/16/2015 Few but long trips with decreasing temperature
More trips connected between Southside to Lawrenceville and Oakland. And duration of trips between Oakland and Shadyside was shorter.
https://carnegiemellon.carto.com/u/yidan-g/builder/53f2b215-8a26-4d20-bb30-ff39d409bce3/embed
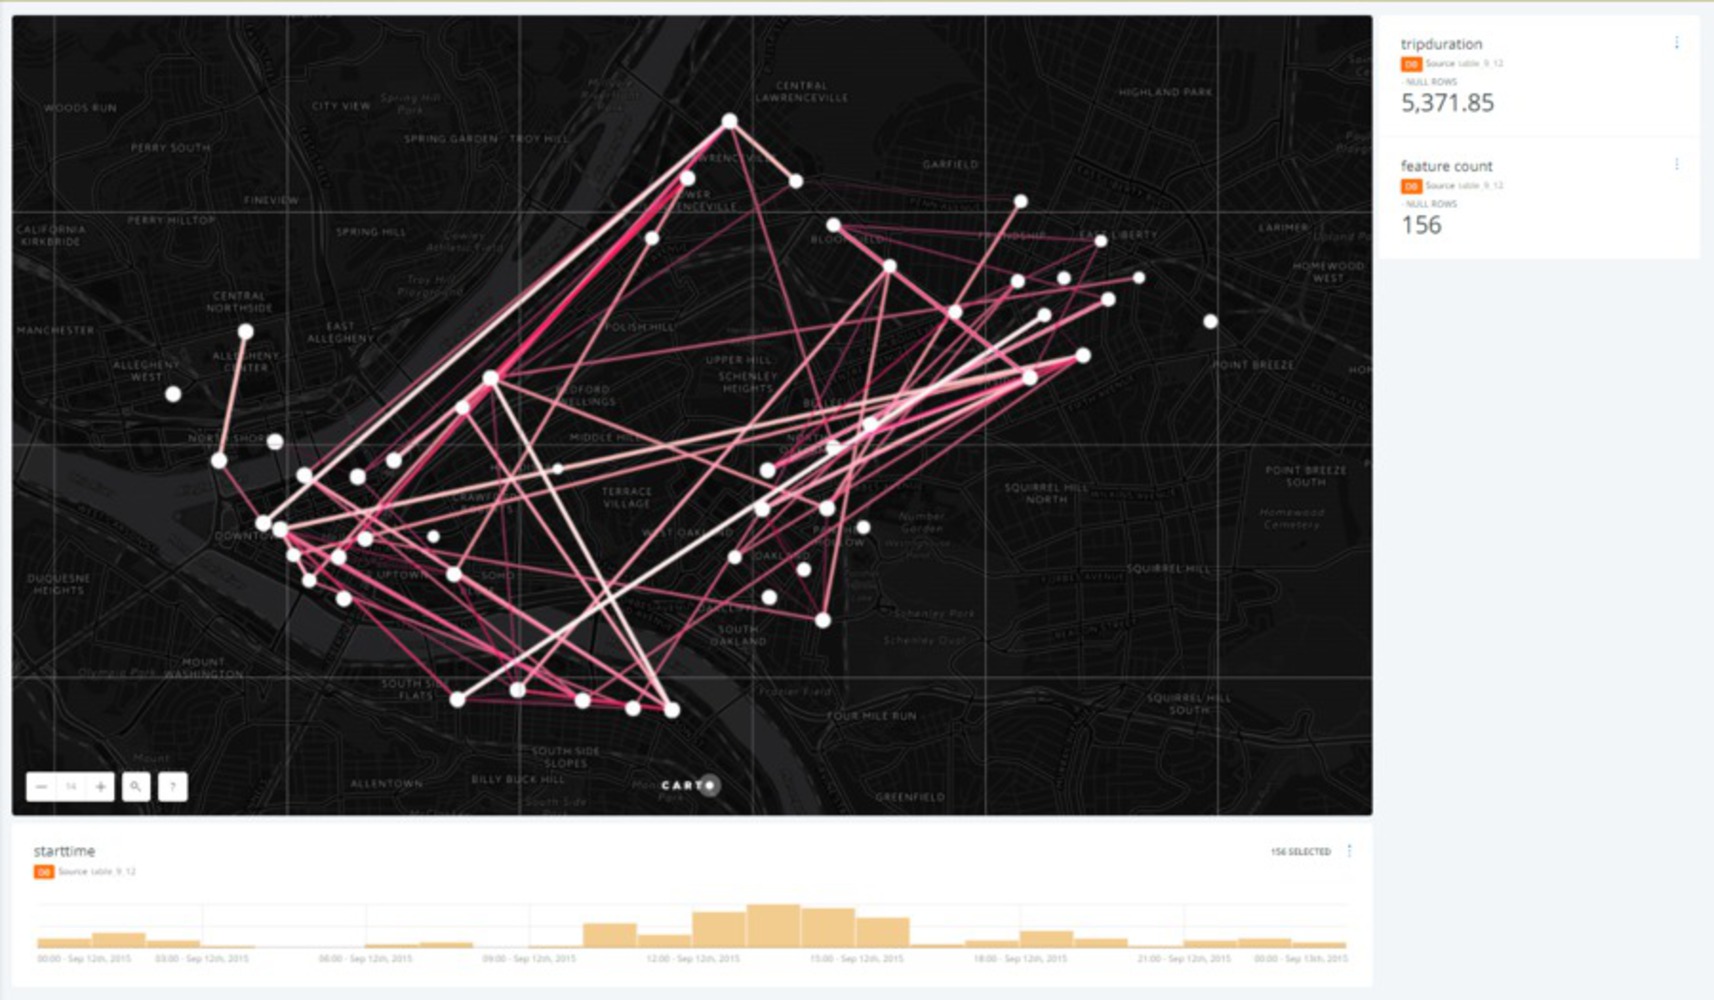
09/12/2015 Few trips with rainy, windy and cooler weather
There were much fewer trips in Downtown, however, there are still many trips between Oakland and Shadyside.
If I have more time, I would like to overlay the events venue with the trips. Because there are usually a lot of events happening on weekends which people may ride bikes to attend. By studying this problem in more depth, it may offer us the possible venue or places that activities could happen along the streets to interact with riders.
Moreover, it will be worthy to study the road situtaions in the correlation to the difference ride activity on different weathers. Because in rainy weather, it requires safty concerns for riders. At the areas where there are a lot of riding bikes in rainy weather, the roads are needed to be well paved or more slow down signs.
You can upload files of up to 20MB using this form.