Back to Parent

Outcome


What is this?

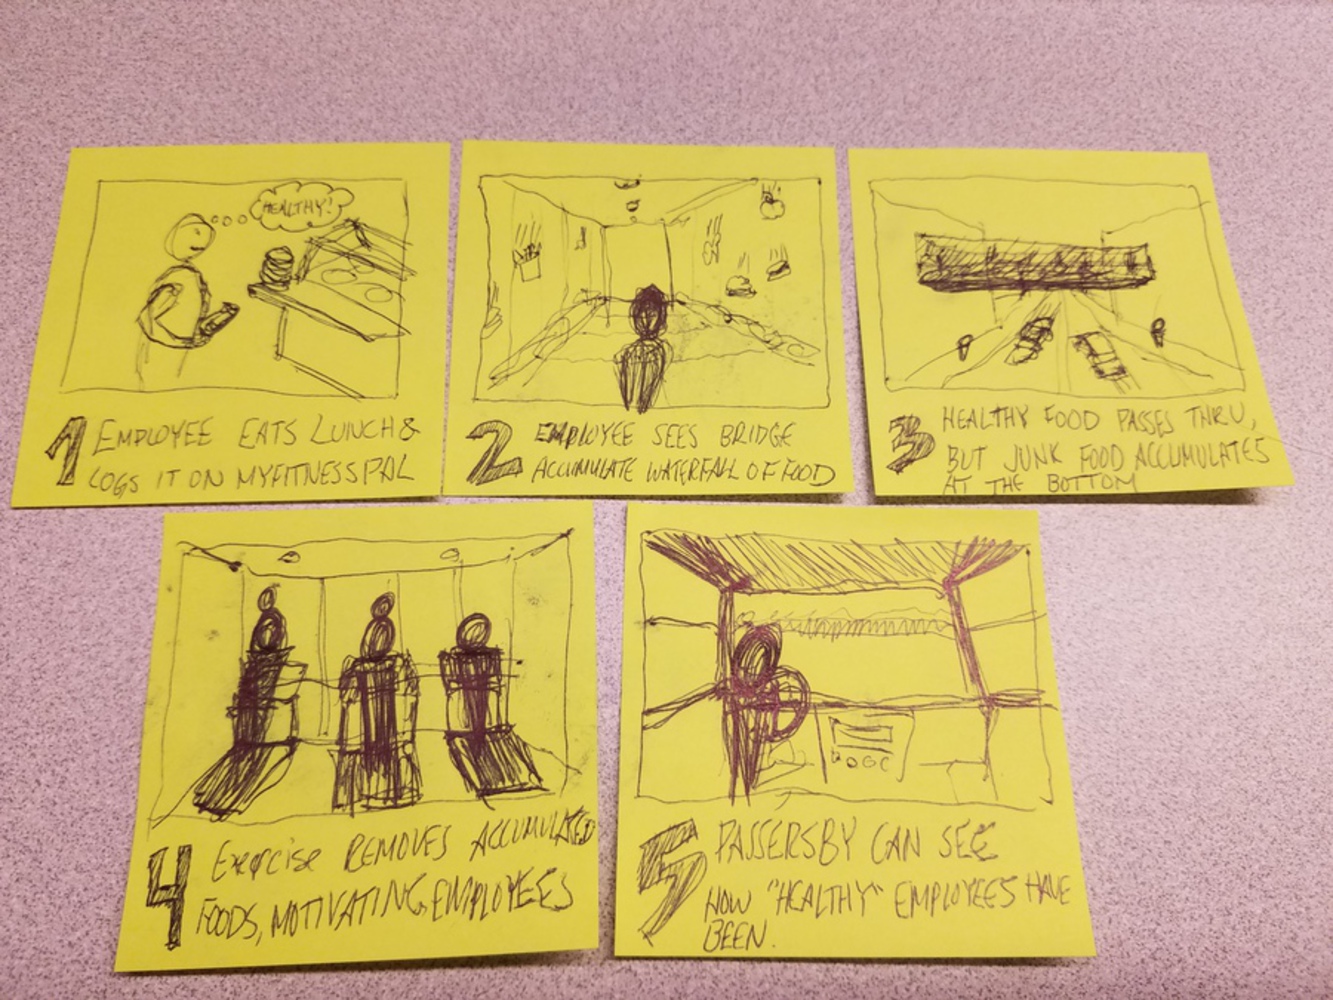
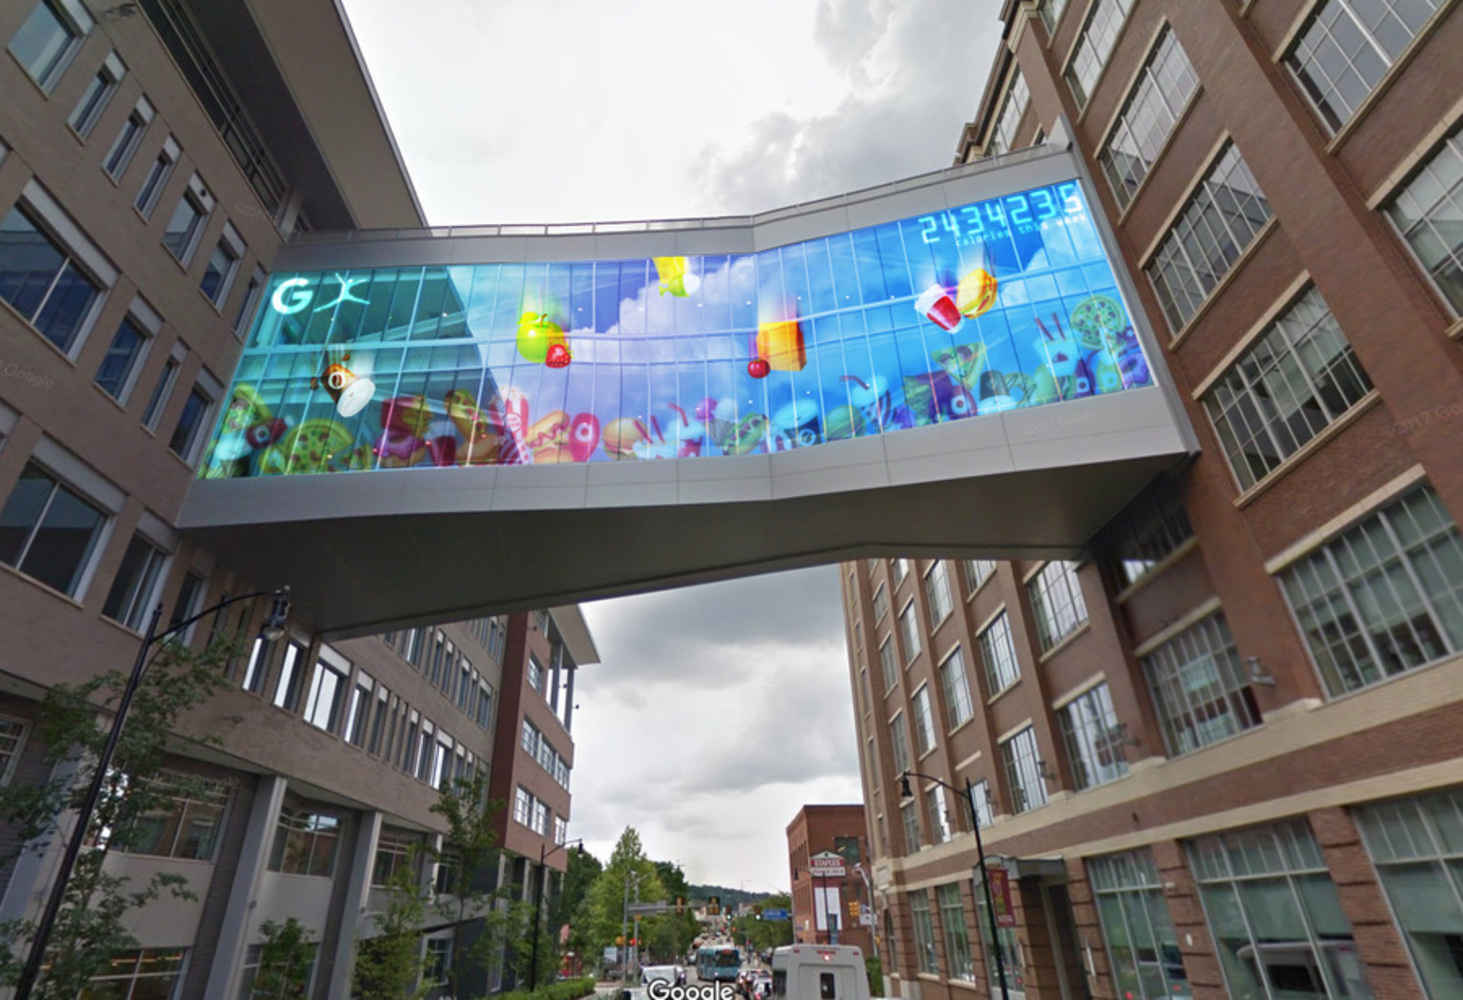
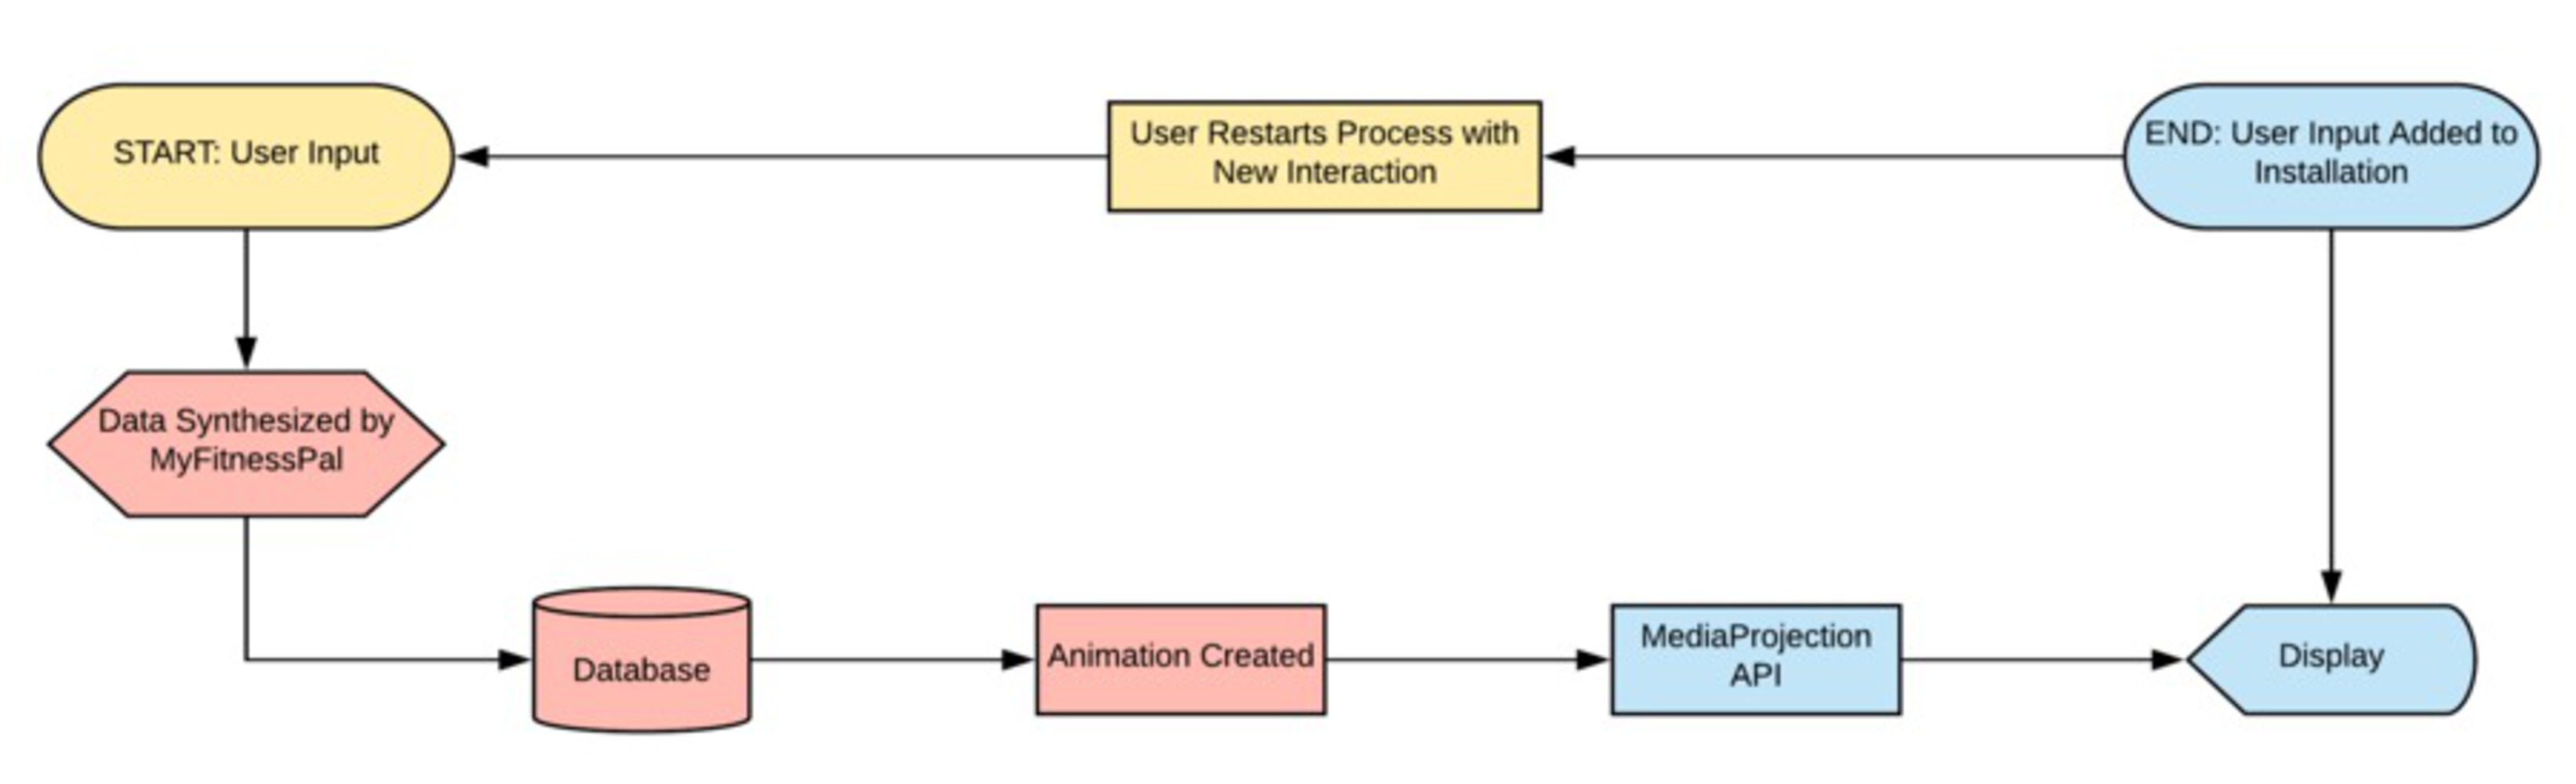
What's For Lunch? Google x MyFitnessPal is an opportunity for employees of Google Pittsburgh to use their canvas in Bakery Square to encourage health and wellness throughout the Pittsburgh area by tracking and displaying their own health progress. The installation works in collaboration with one of the most popular health tracking apps, MyFitnessPal, to accumulate and aggregate the eating habits of employees. Using an algorithm to develop animated versions of the foods Google Pittsburgh employees eat, ephemeral images of foods cascade down the installation. MyFitnessPal determines the overall healthiness of a food based on its fat content, nutritional value, and other dietary elements. Using this standard, the database determines which foods are unhealthy, and accumulates them at the bottom of the projection canvas. As the week goes on, this continues to accumulate, putting on full display to Pittsburgh residents how healthy Google employees are being. 

But fear not! Google Pittsburgh employees have the opportunity to remove some of the accumulated junk food by logging exercises on the MyFitnessPal app. In doing so, employees are motivated to maintain their and Google's image as a wellness-oriented group by partaking in and logging healthy diet and exercise.  

20180905 005239.thumb
Show Advanced Options

Hamza, please tell me about the user experience.

Glad you asked. An employee starts by logging a snack or meal on MyFitnessPal. The data is synthesized through the app, determining whether or not the food is healthy. As this happens, details about the food are sent to a database and an API that renders a cartoon image of that food. For example, if a user logs a meal called "Hot Dog with Mustard", the API will return the phrases "hot dog" and "mustard" to determine what it looks like and draw it in real time. Both the healthiness and image of the food are then sent to the MediaProjection API. This API will display via projection technology the image of the food cascading from the top of the bridge to the bottom. Here, one of two things will happen. If the food is deemed healthy, it will pass through to the bottom and out of the canvas. However, if it is not healthy, it will accumulate at the bottom of the canvas. 

From the exterior, this installation is experienced as an interactive billboard similar to a Tetris display. Also on display are the total calories consumed that week, as well as the two parent entities' logos. From the interior, this is experienced in an aquarium-like setting, where the falling foods and accumulating junk surround pedestrians moving through the bridges. 

As the accumulation rises, an employee is motivated to maintain the positive image of Google. To help get rid of some of the accumulation, employees can log exercises on the app. A ratio is developed from the total calories the user consumed versus the calories they burned to determine how much of the accumulated junk food is removed. The interactive display resets at the end of the work week. 

Bridge render.thumb
Show Advanced Options

Does this even fit the design requirements?

Yes. The installation incorporates Google data on two levels. It uses an API that Google could develop from Google Images and Google Doodles to render cartoon images of most foods. But further than that, it uses information from actual Google employees by gaining voluntary information and encouraging an environment for discussion about things like health and wellness. People passing through experience the installation very differently from those passing by from outside. Because of the ephemeral, Candyland-like experience within the bridge, the installation is emblematic of the quick feeling of joy that junk food brings. However, when an employee steps outside, they see the actual weight and effect of this on the installation. The installation gathers data throughout the day and can run with or without direct interaction - but the main interaction occurs off of the bridge. Regardless, for both those inside and out, this creates a fun, playful installation that gives employees something to smile about while considering the importance of health and wellness. 

Data flow diagram.thumb
Show Advanced Options

Bill of Materials

  • Smart glass projections covering full glass dimensions of bridge on either side
  • Structural adjustments necessary to prop up smart glass
  • Host computer accumulating data
  • Connective wire between display and host computer
  • App downloaded on employees' smartphones
  • Seating options
  • Informational signage explaining installation and interactivity
Drop files here or click to select

You can upload files of up to 20MB using this form.