What's for Lunch? Google x MyFitnessPal
Made by hqq ·
Made by hqq ·
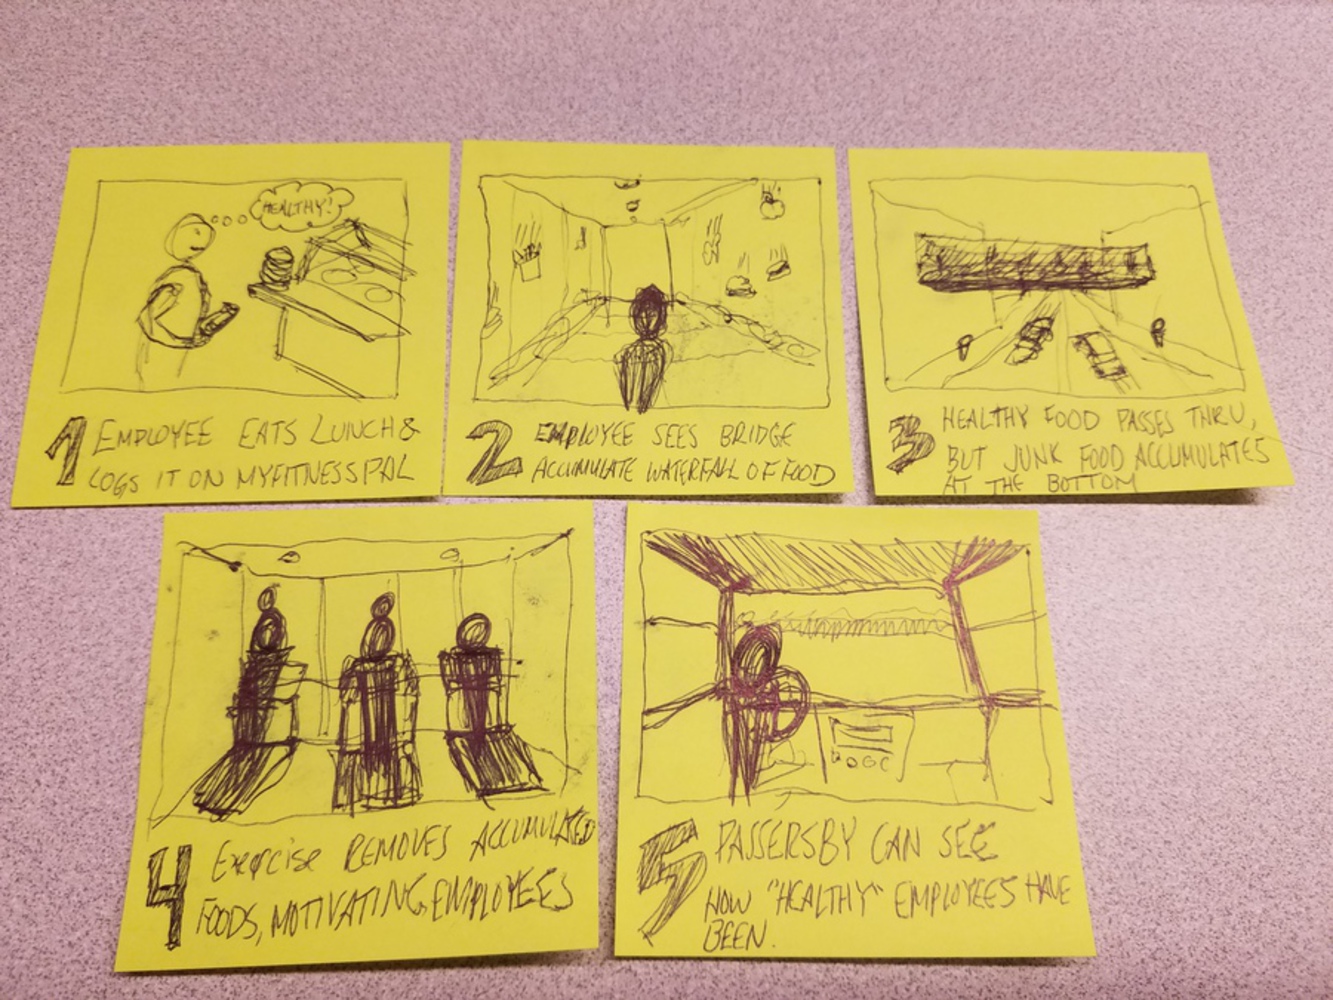
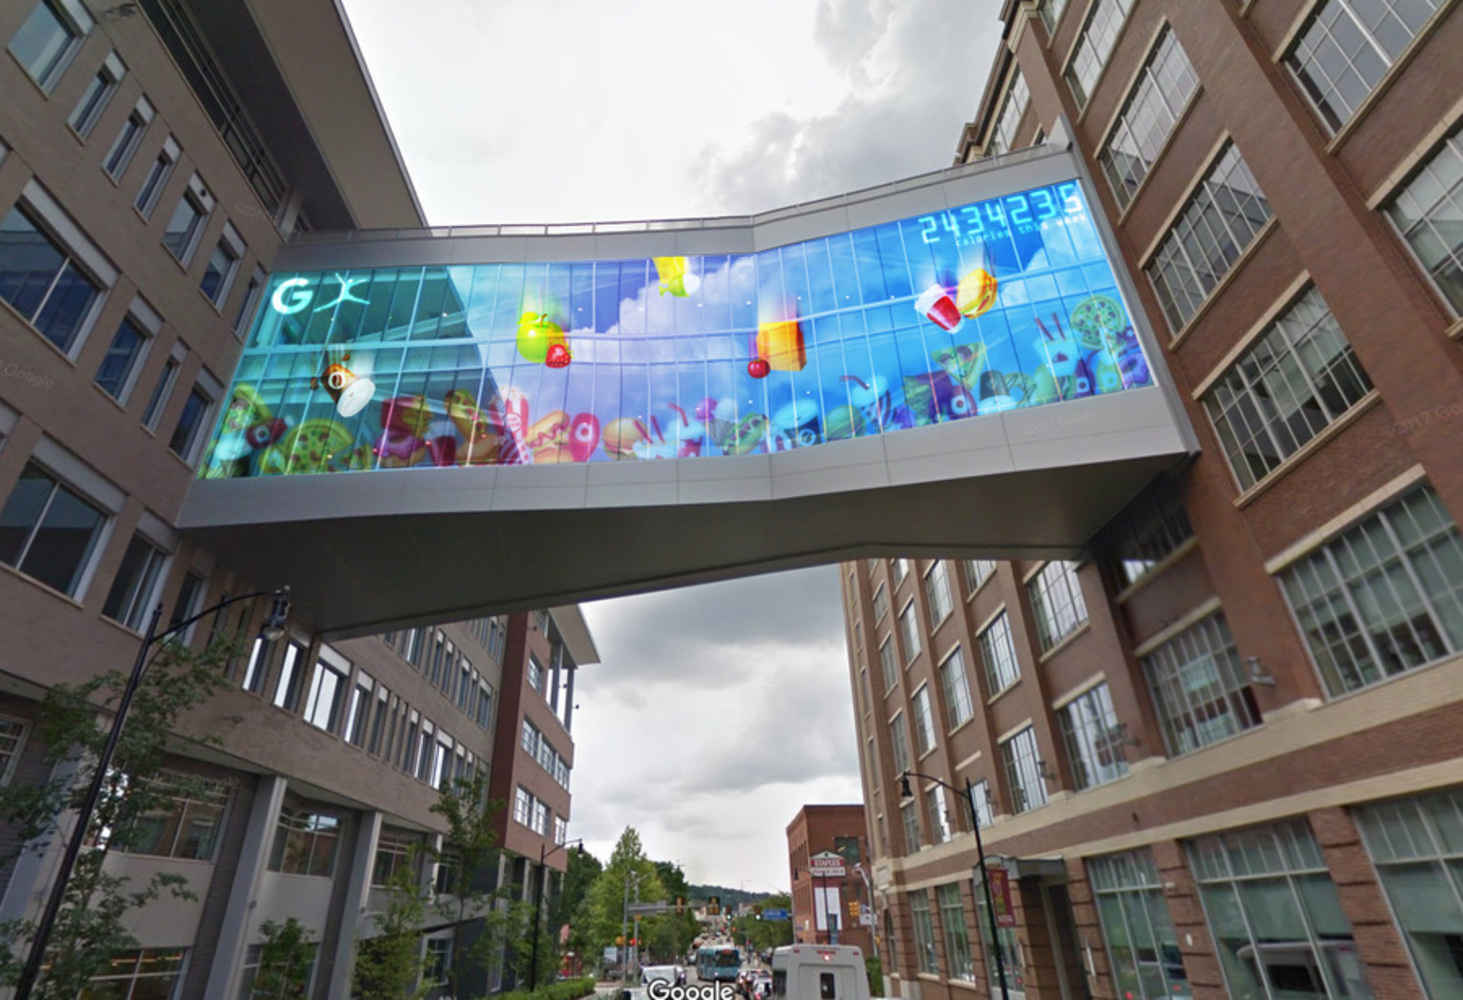
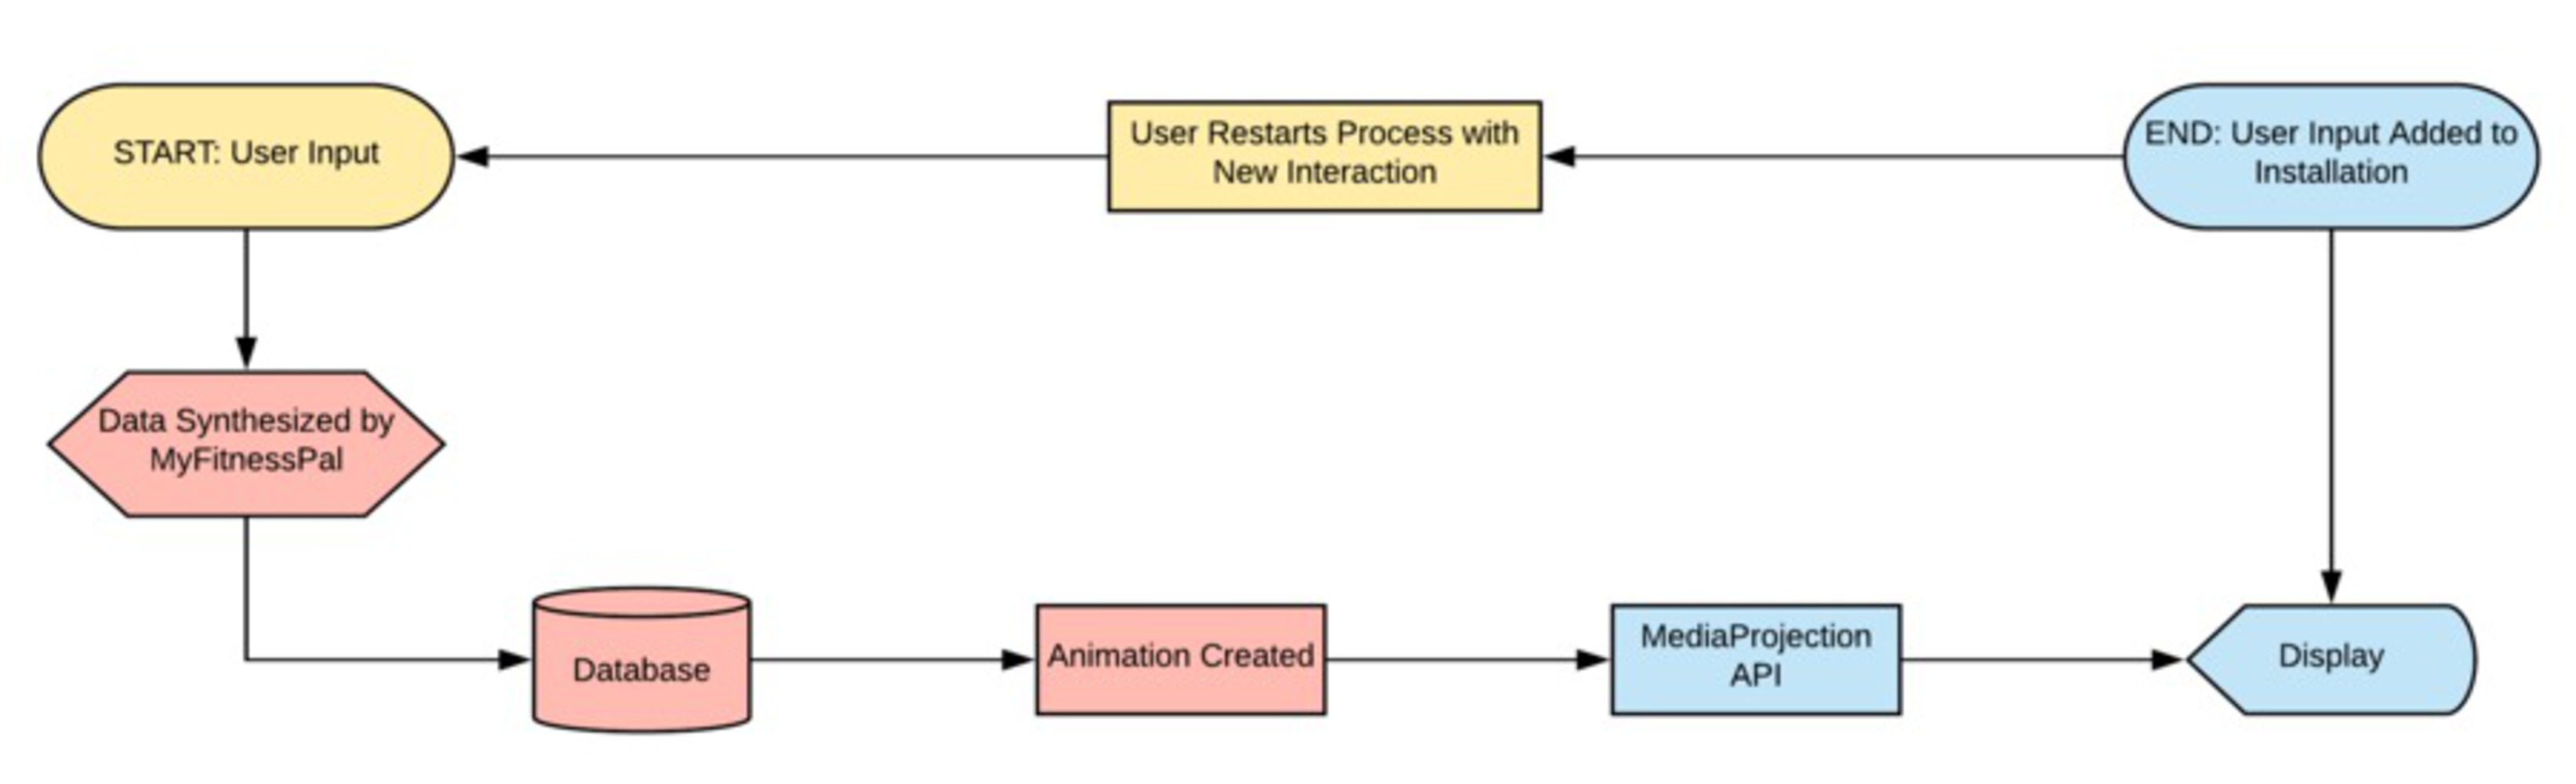
This installation is an opportunity for Google Pittsburgh to showcase its priorities in health and wellness by partnering with MyFitnessPal to encourage employees to track their diet and exercise habits and be mindful of the way of their personal health. By aggregating and visualizing health across the company, Google can learn more about how its employees stay healthy, while the ability for passersby to see their progress motivates them to be more well.
Created: September 5th, 2018
This project is only accessible by signed in users. Be considerate and think twice before sharing.
How can embedded computation change the way we experience our surroundings? This class will focus on the design and prototyping of reactive spaces. Over the course of several small projects and one...more
This installation is an opportunity for Google Pittsburgh to showcase its priorities in health and wellness by partnering with MyFitnessPal to encourage employees to track their diet and exercise habits and be mindful of the way of their personal health. By aggregating and visualizing health across the company, Google can learn more about how its employees stay healthy, while the ability for passersby to see their progress motivates them to be more well.