Floating Point
Made by yixiaofu, Cem Ergin, Austin Garcia and Elizabeth Han
Made by yixiaofu, Cem Ergin, Austin Garcia and Elizabeth Han
Created: September 22nd, 2019
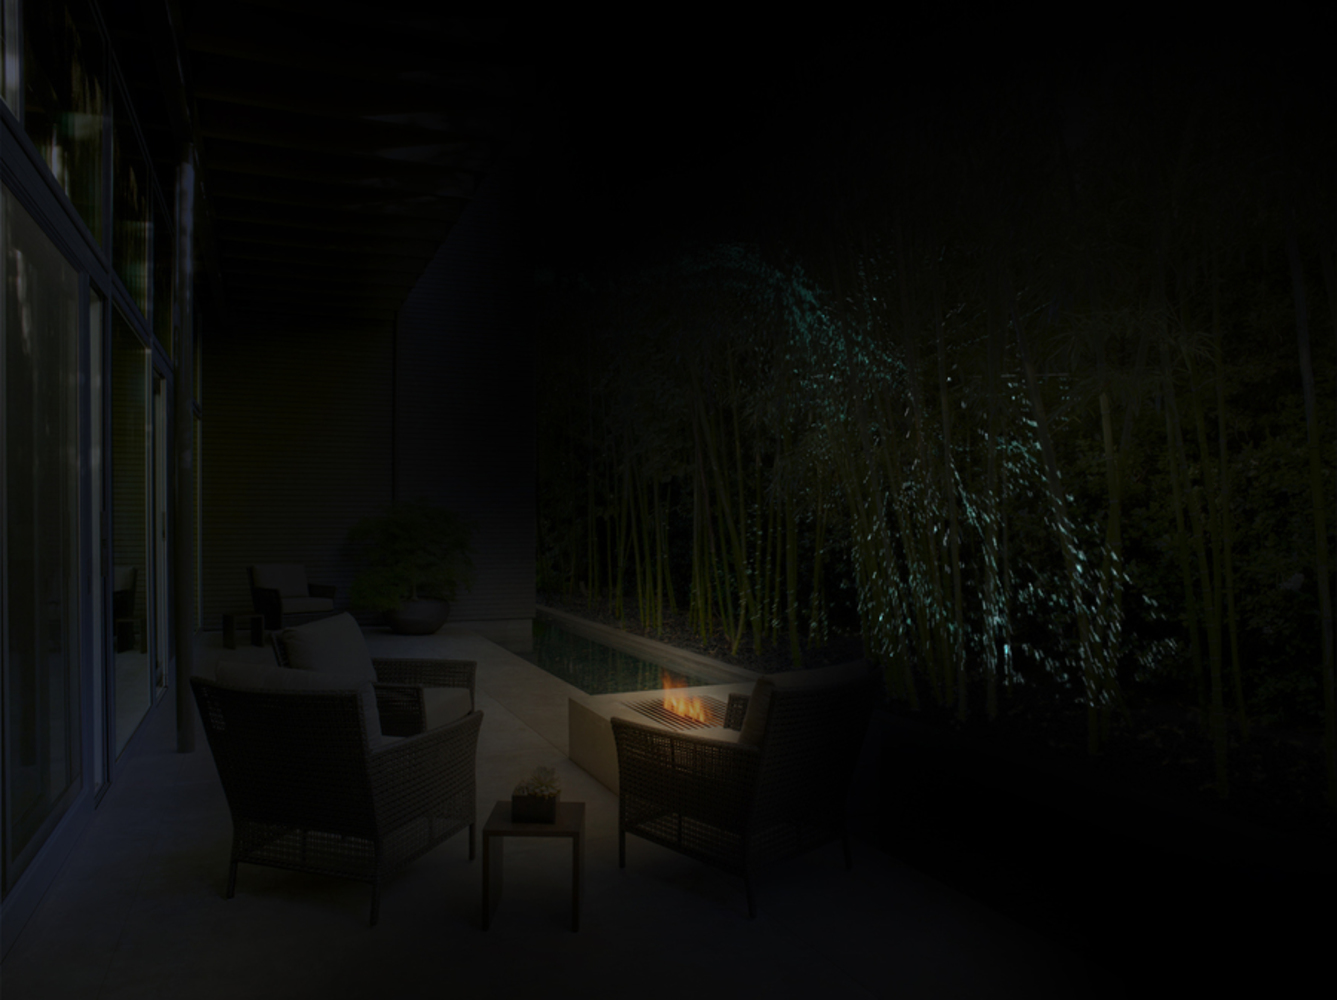
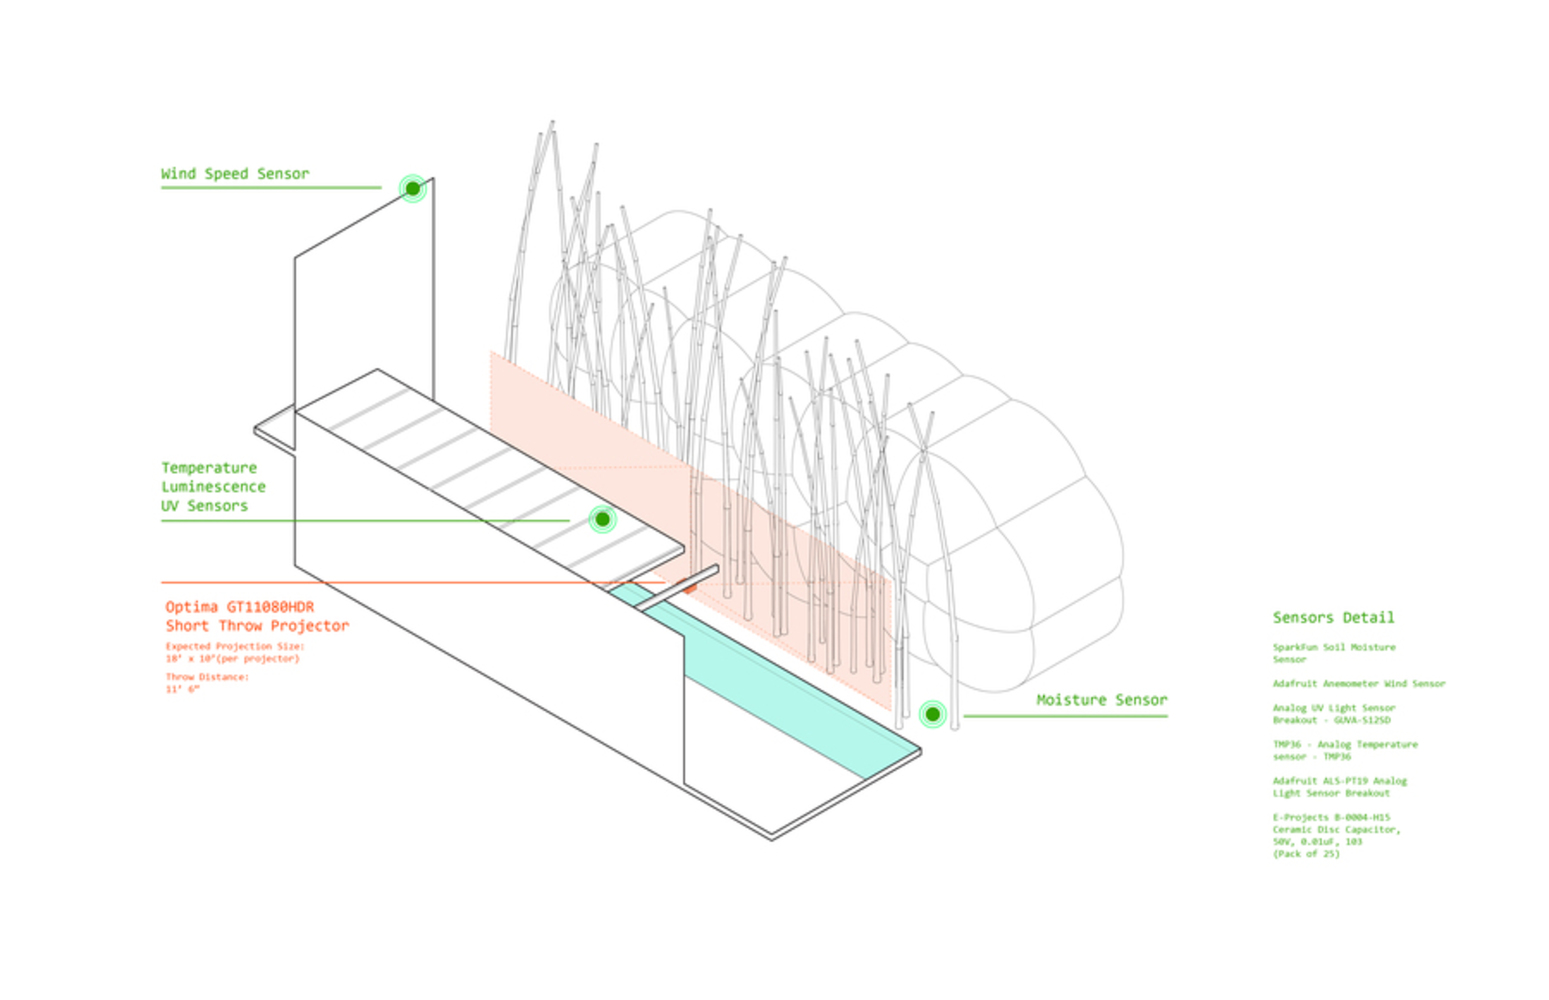
"Floating Points" augments the fleeting variables in nature using particle motion. The projected particles fluctuate based on multiple natural variables, including wind speed, soil moisture, temperature, luminescence and UV light intensity, providing a unique visual experience in the garden with each passing night.
Our initial seed of the idea came from emulating a sense of rain to counteract the dry climate of California, where the garden is located in. The idea was further abstracted to inspire a sense of wonder and serenity while watching the motion play out.
The installation is designed to be projected in the bamboo vegetation using two short-throw projectors.
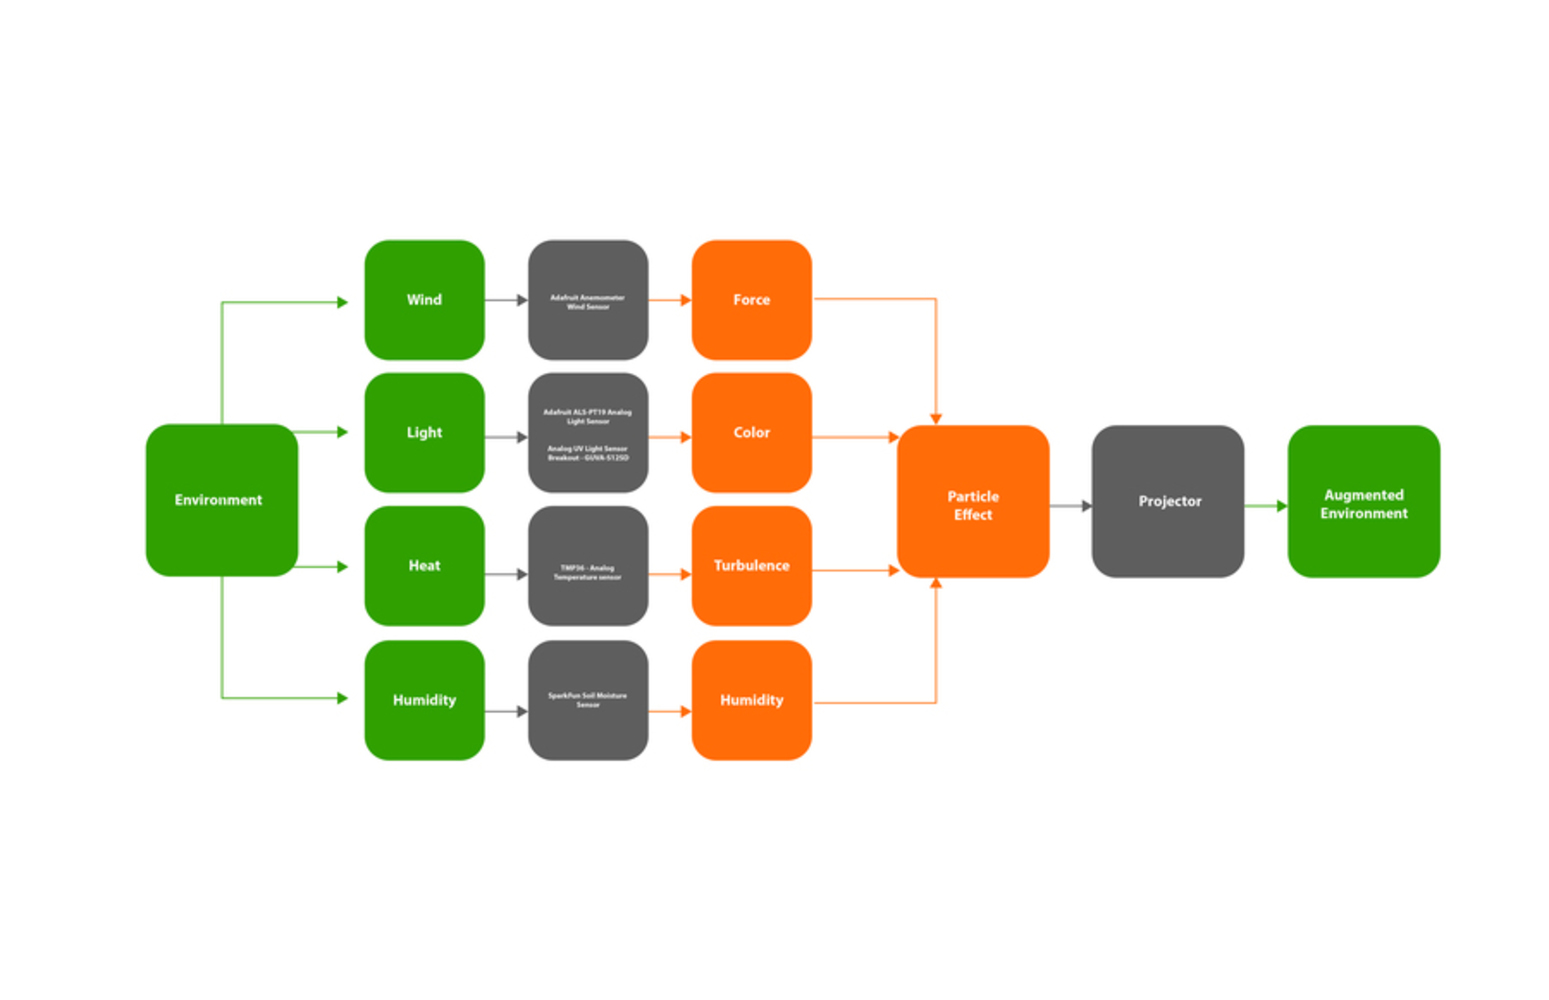
Data Flow:
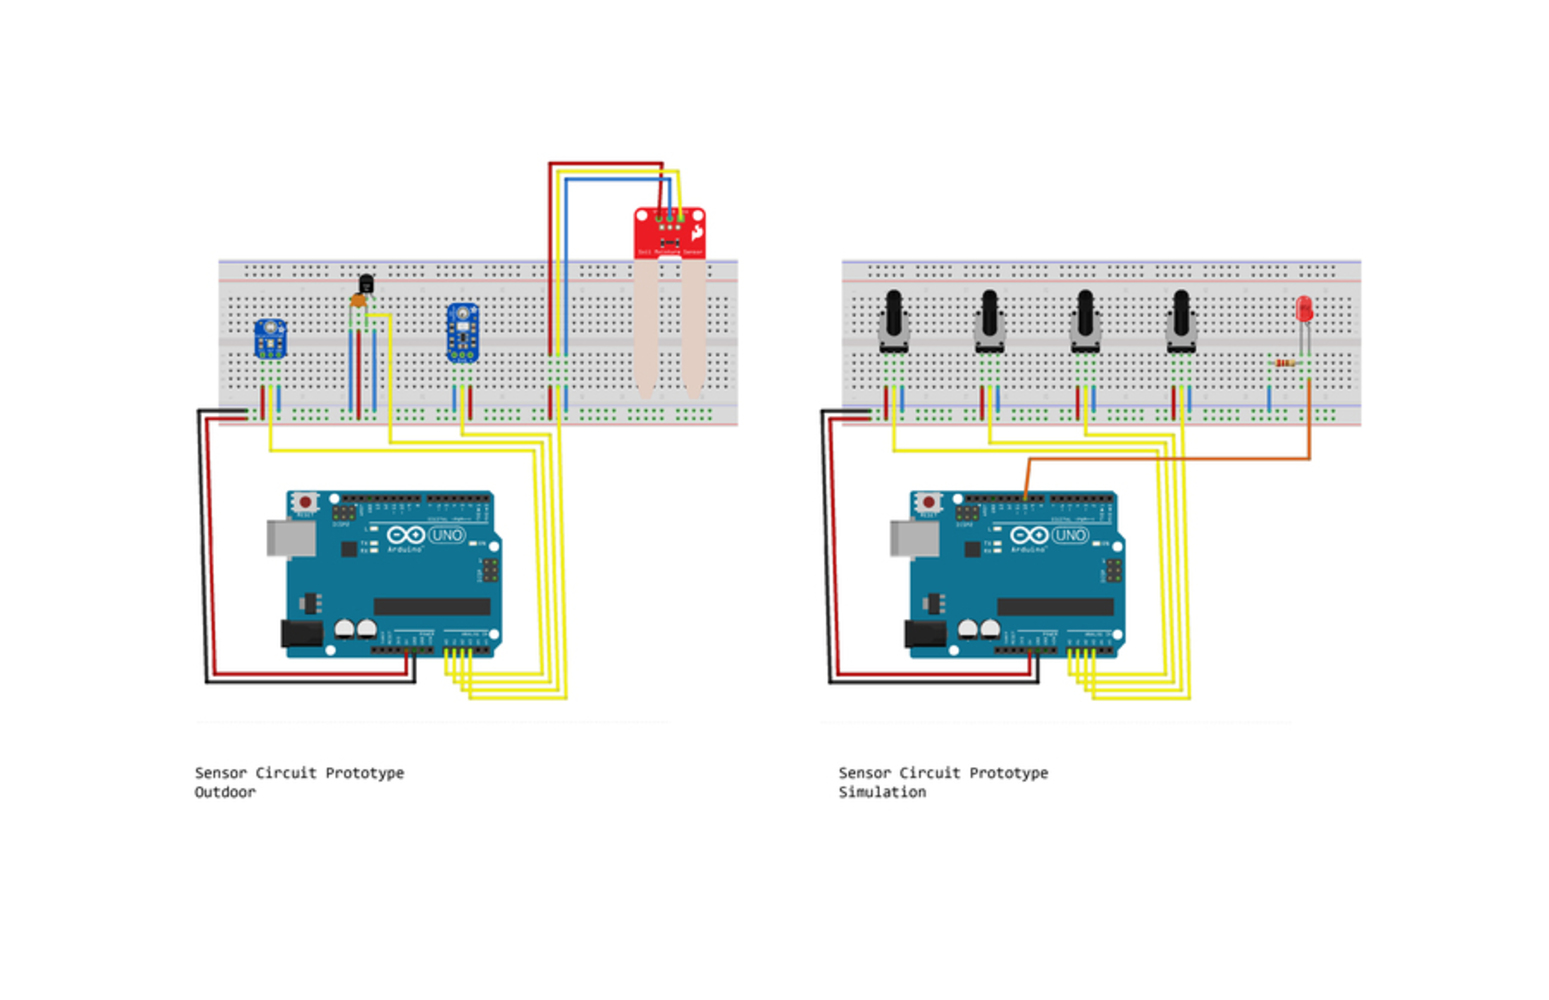
5 distinct sensors inspect the wind speed and direction, luminescence, the UV light intensity, the temperature of the environment as well as the soil moisture of the garden. The information is then fed to Touch Designer through an Arduino that is equipped with the Firmata protocol. The input is used to modify the parameters of the particle effect to reveal the real-time state of the natural environment. Wind speed and direction will control the force, luminescence and UV light will control the color, temperature will control the turbulence and soil moisture will control the birth rate of the generated particles. While the movement of the particles will constantly going, by mapping the real-time environmental data to the important parameter of the particle effect it will automatically reveal the state of the environment.
Process:
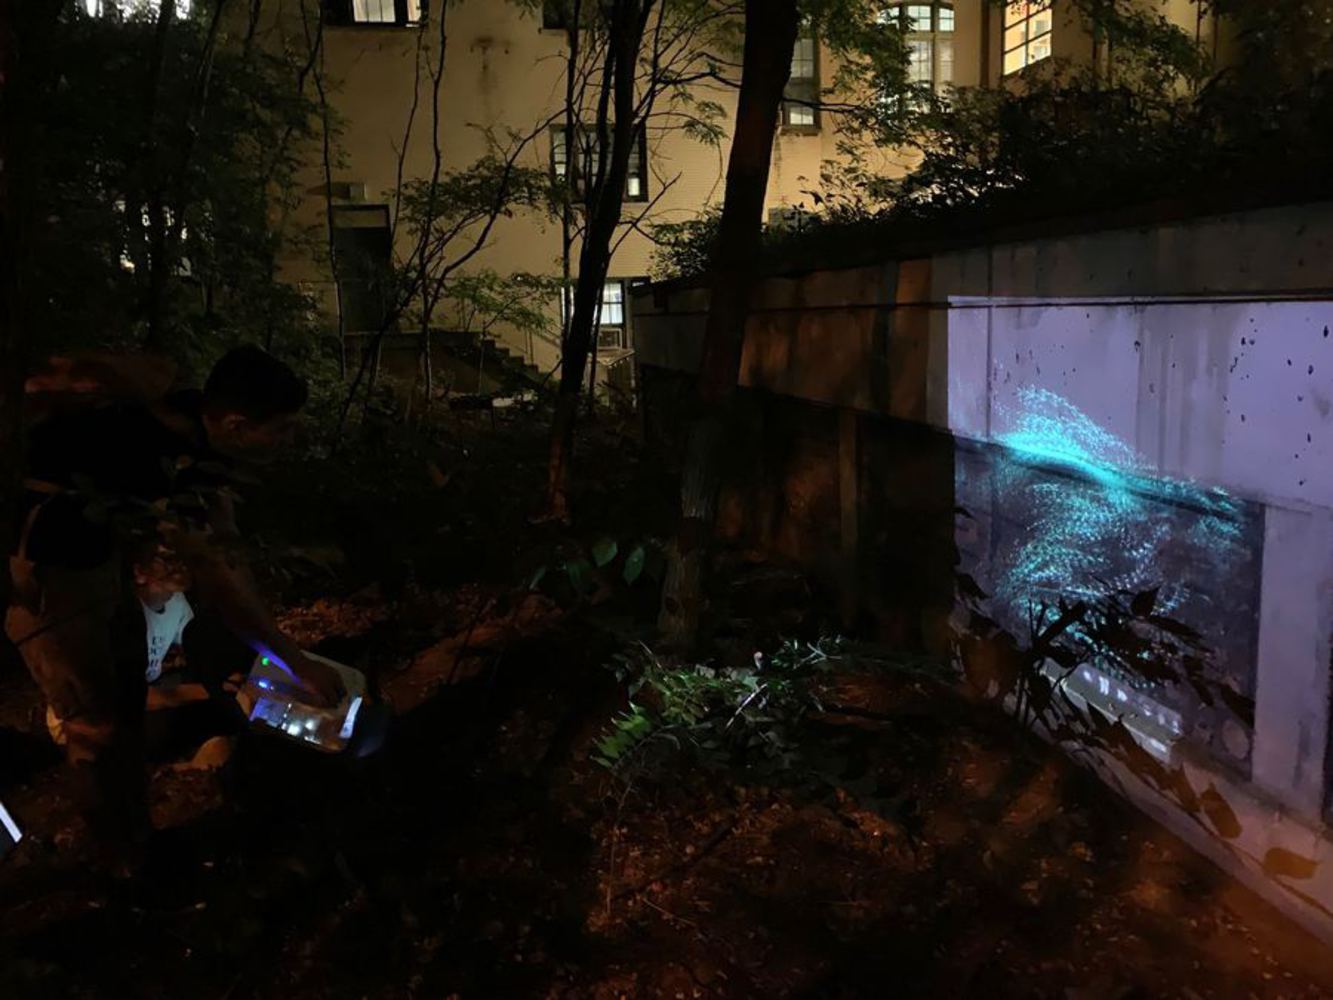
Initial test
After a successful simulation where we used projected a short clip of fireworks video on to the vegetation near Hunt Library, we were inspired to further experiment with particle motion on irregular surfaces. Through this experiment, we found that the volume of a plant had a good affordance for a captivating projection.
Iteration 1
Our first iteration was made on TouchDesigner, using the particles component and a feedback loop that allows the particles to circulate across various points.
With this, we tested out toggling various parameters by feeding in data from a set of potentiometers. After being satisfied with the changes of motion as incoming information was fed into the turbulence period of the particles, we decided to further iterate on the motion graphics, with the intent of feeding in more streams of data into different particle variables.
Iteration 2:
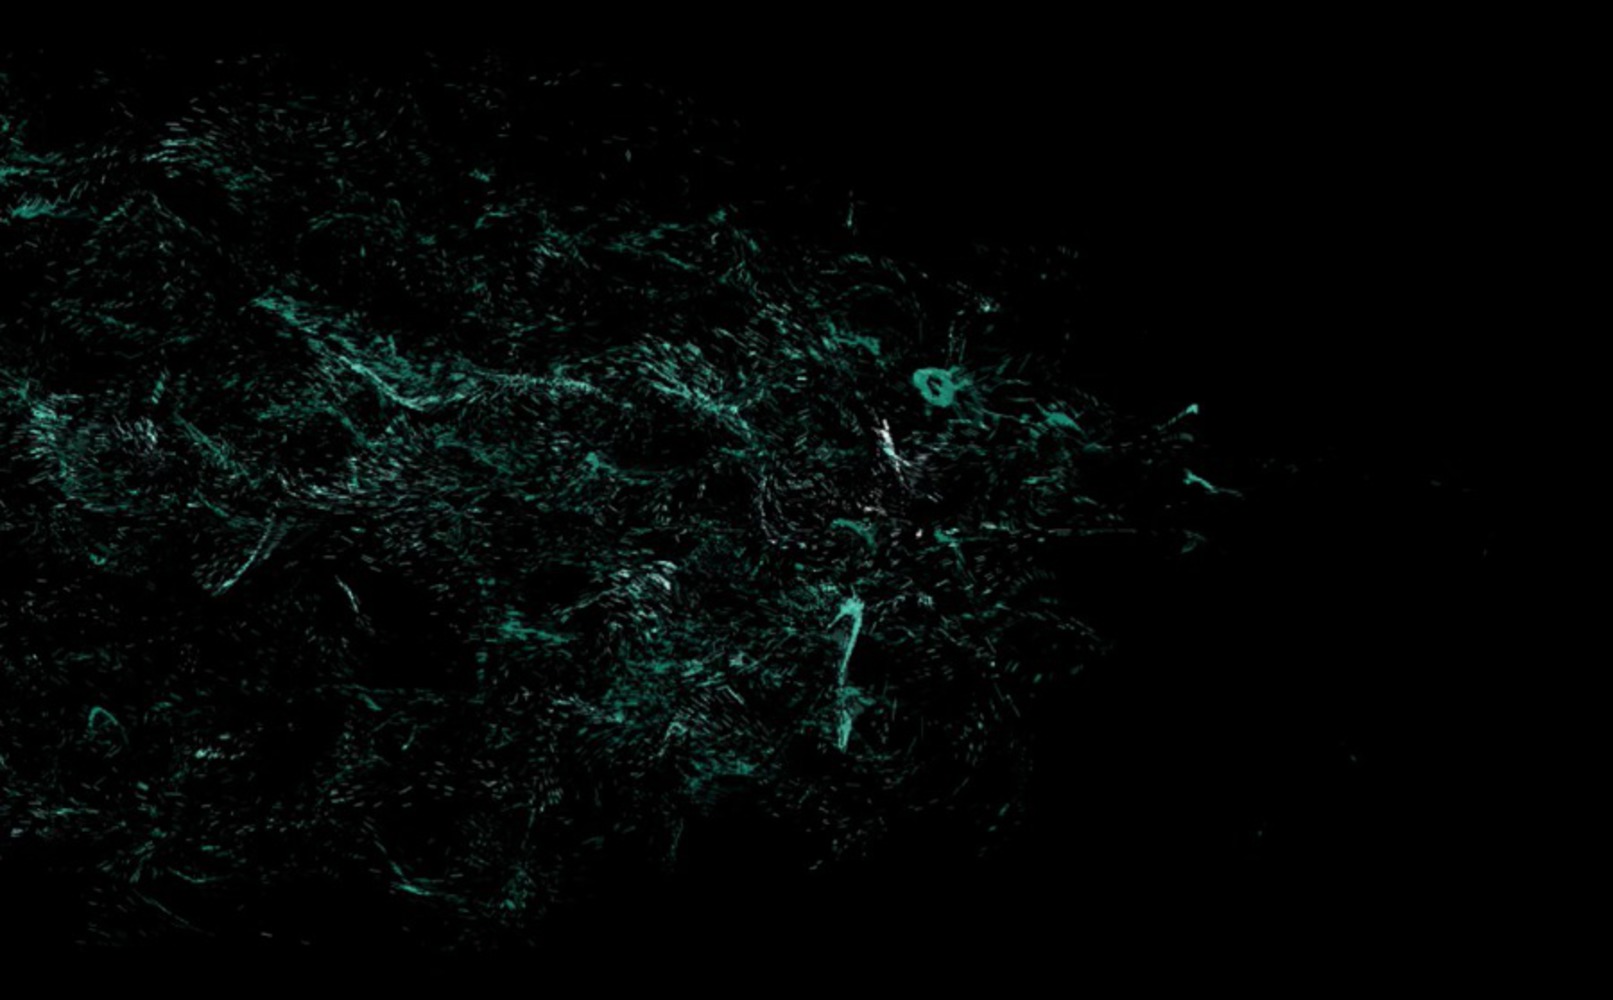
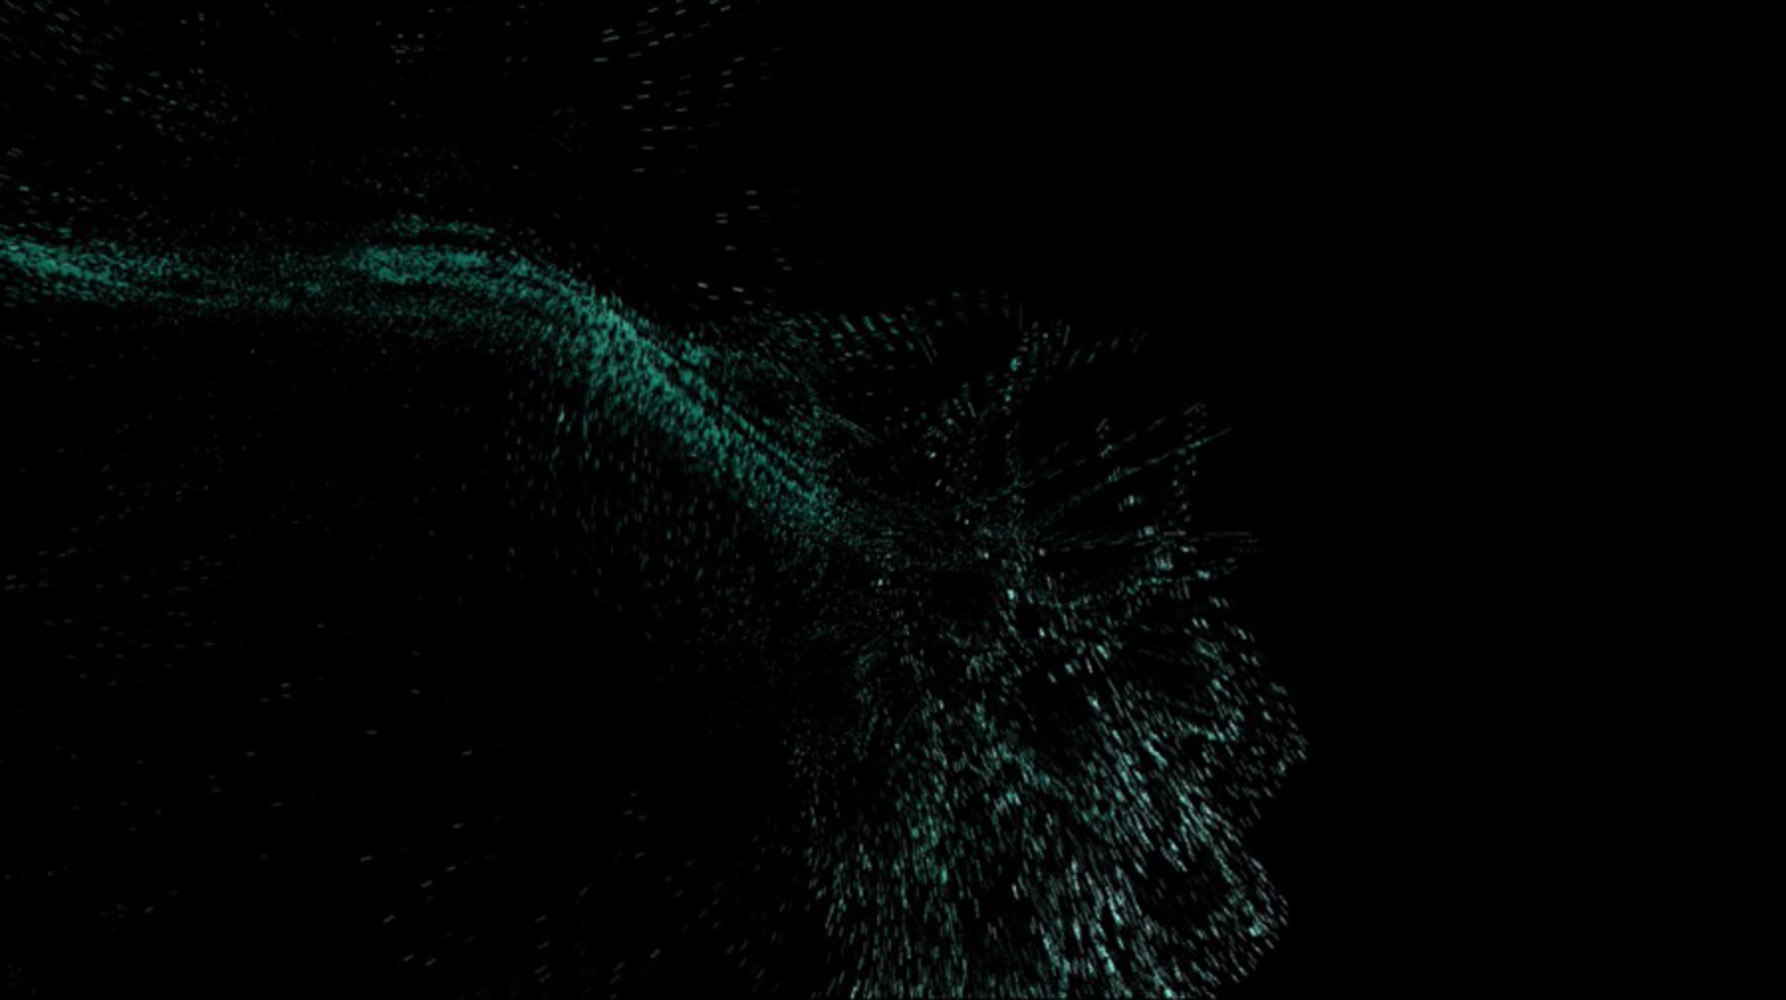
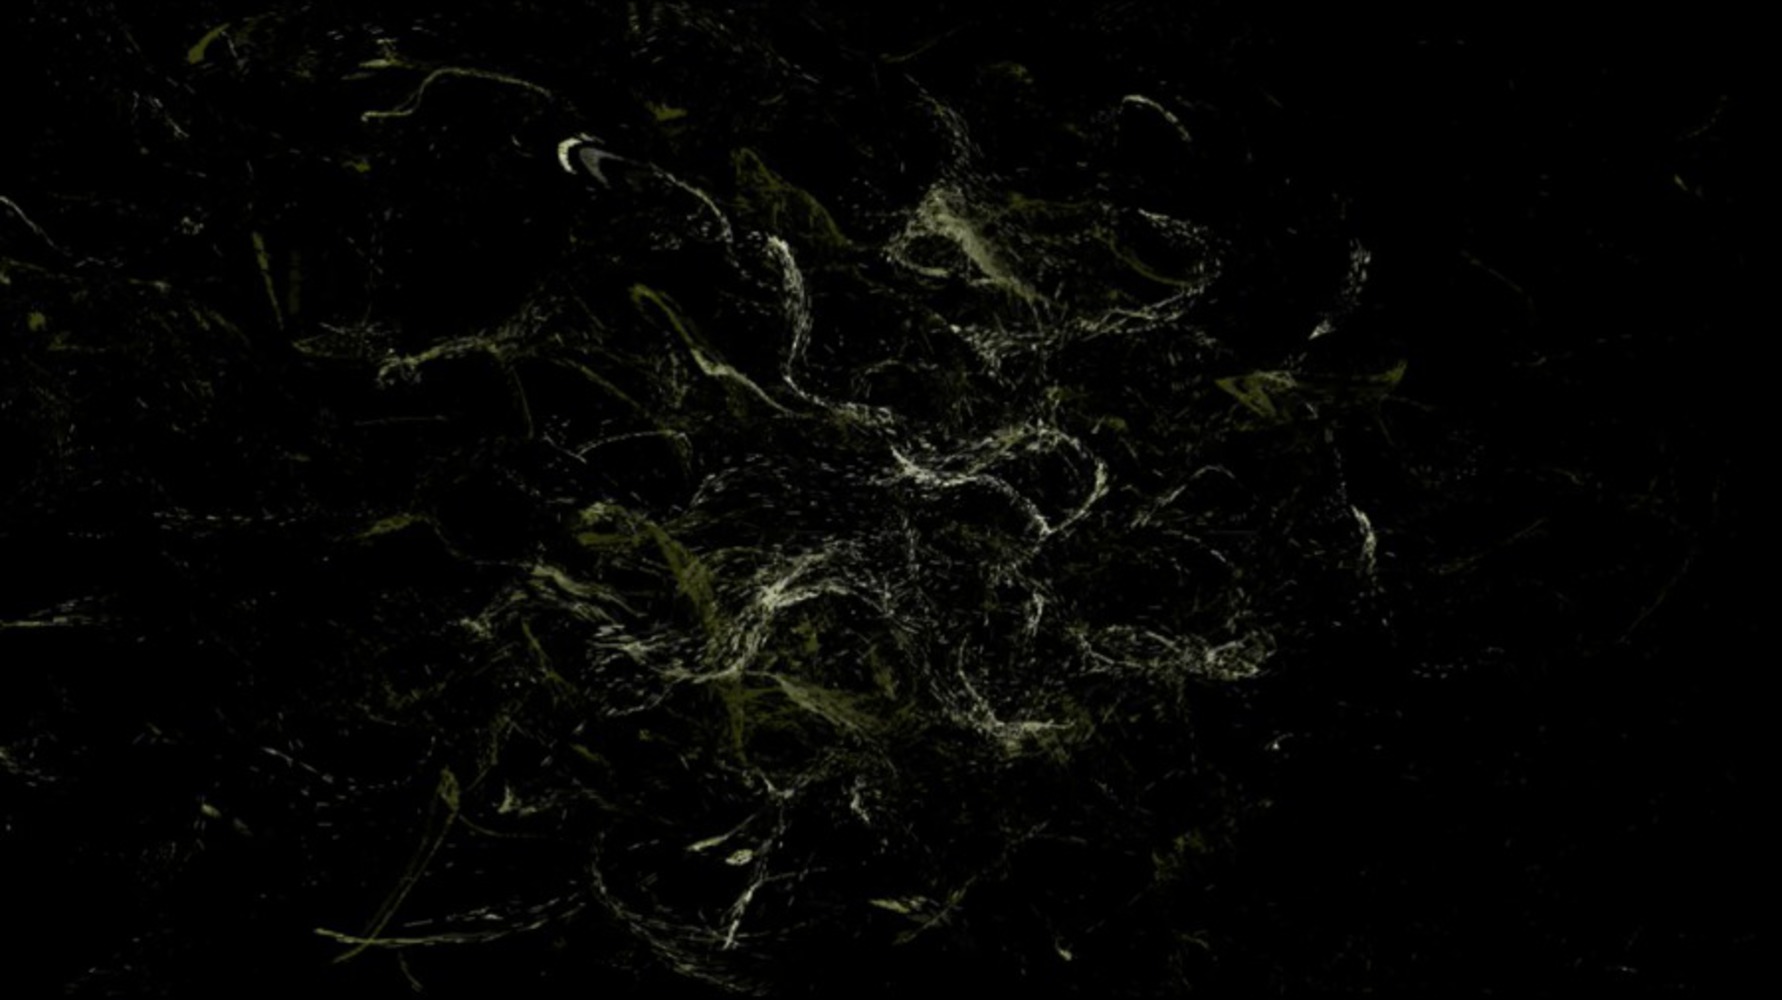
More development was made in the second iteration to expand the particles across the canvas in a more engaging motion. After this point, we decided to toggle the turbulence period, color, birth rate of particles and wind speed with the data inputs.
The following are examples of different graphics that were created based on the combination of different parameters.