Currency Rates

Made by Nazli

The goal of this project is to distort data in such a way that even if the data is correct, people will misinterpret it.

Created: November 2nd, 2015

0

Product

I created a graph of the currency rates between US Dollars and Turkish Lira between the dates of 11/19/2015 - 11/2/2015. I used two different websites for the information. I inputted the data into Microsoft Excel 2013 and created a "Scatter with Straight Lines and Markers" chart type. This chart shows the dates and how much Turkish Lira is equal to 1 US Dollars at those dates. My lie in this graph is the numbers: The numbers have been correct at some point of the day they are on, but it was only for a short while, it is not the average of the day. All the days except the last one's values are rounded up and the last day's value is rounded down. This makes it seem like there has been a huge drop. It is true that there was a big drop at these dates, but it wasn't as big as it seems now. 


0
Screenshot from the first site I used
Media 1.thumb
0
Screenshot of the second site I used
Media 2.thumb
0

Intention

As an international student from Turkey, the currency rate between US Dollars and Turkish Lira is very important to me since all of my family's income is in Turkish Lira but all of my spending are in US Dollars including tuition and housing. So the rate changes are something both me and my friends in Turkey check a lot; and I've talked with other international students in Carnegie Mellon too and found out that they check the currency rate for their country's currency as well. These graphs are important in our lives to see how the rates are changing. My intention was to make a graph that makes the drop seem bigger than how it actually is. 
0
My Product
Media chart.thumb
0

Context

The outcome relates to nearly everything. As an international student, it relates to all of my spending: everything that is related to school work, to everything I do for fun, to my most basic needs like food. This is the case with everybody that is living in a country with a different currency than their income currency. So this relates to the lives of many people. The precedent projects are the sites that I have looked at and got my information from. There are many sites like this and also the some channels of the television show information about these frequently. The news also show if there has been a big change. 
0

Process

When I learned this project, the first thing I've decided was that I wanted the set of data to be something I can relate to easily. I spend days thinking what data I use and how I could distort it, 
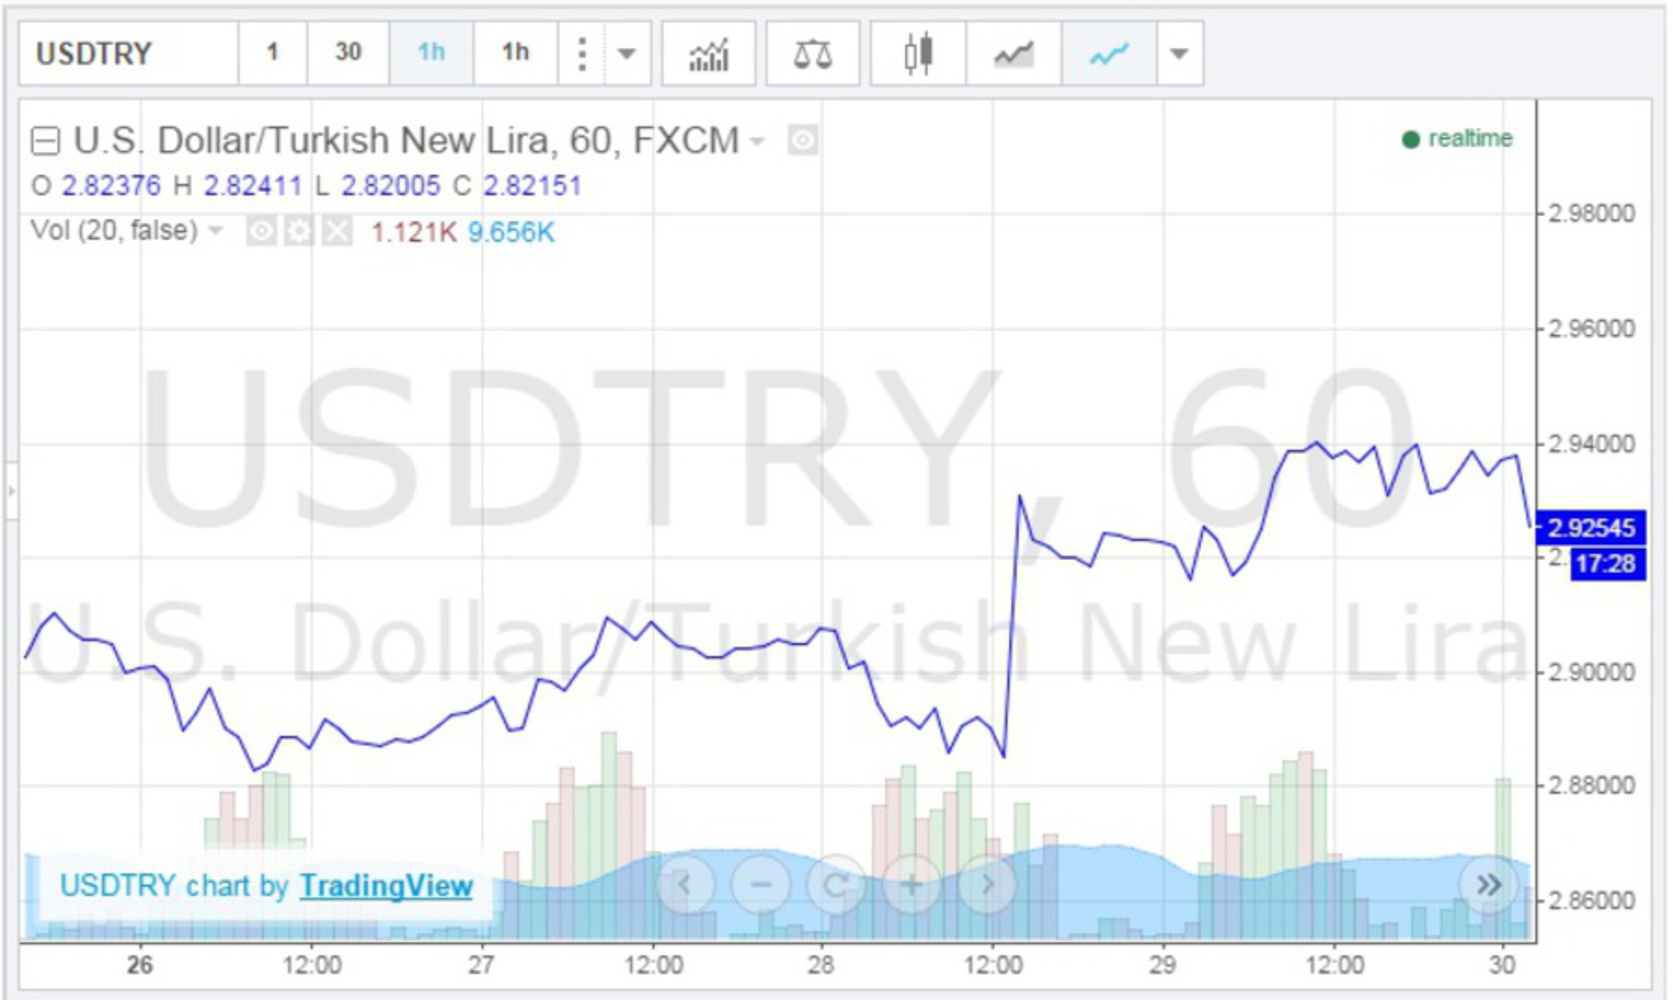
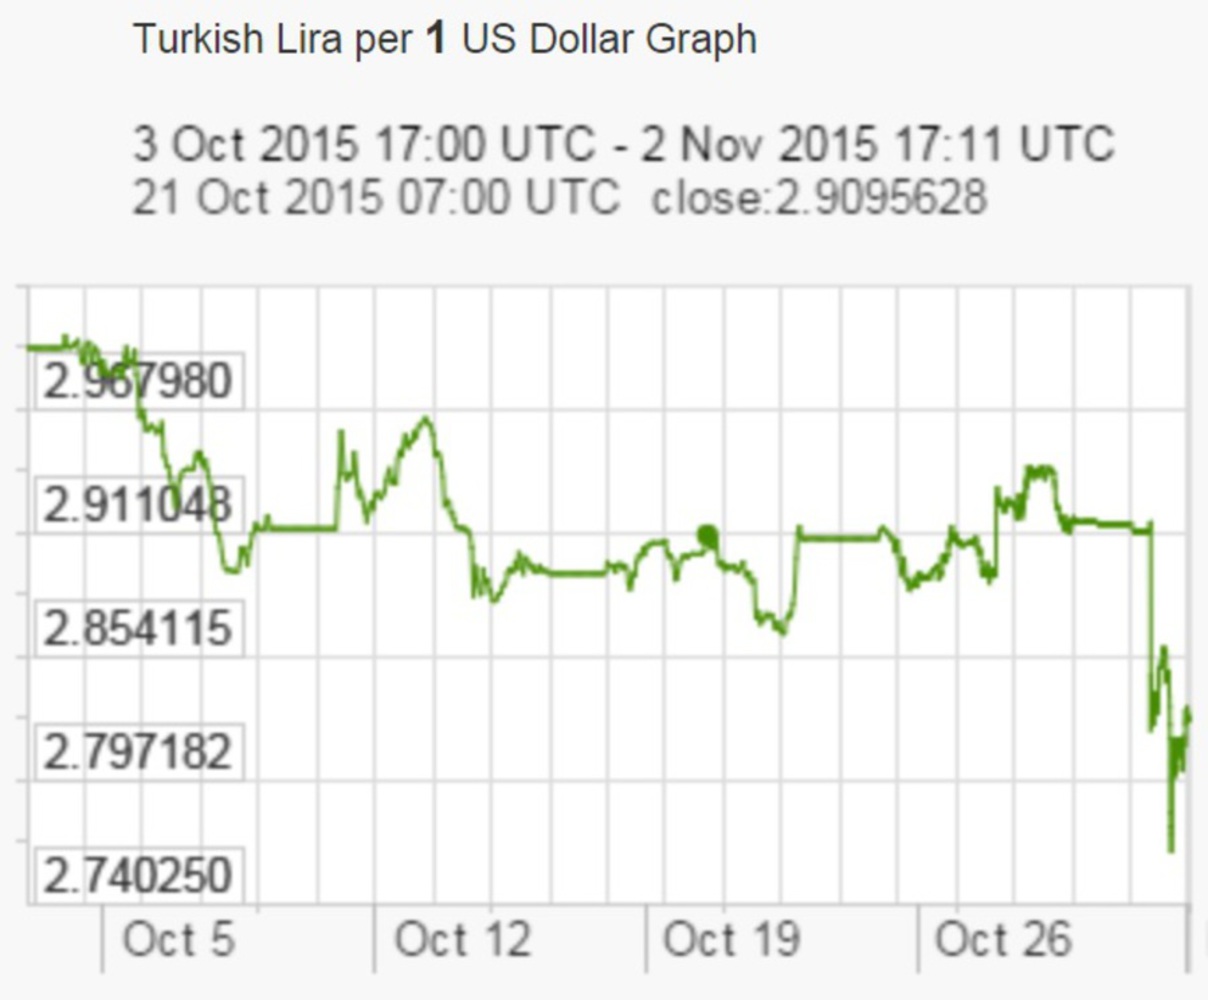
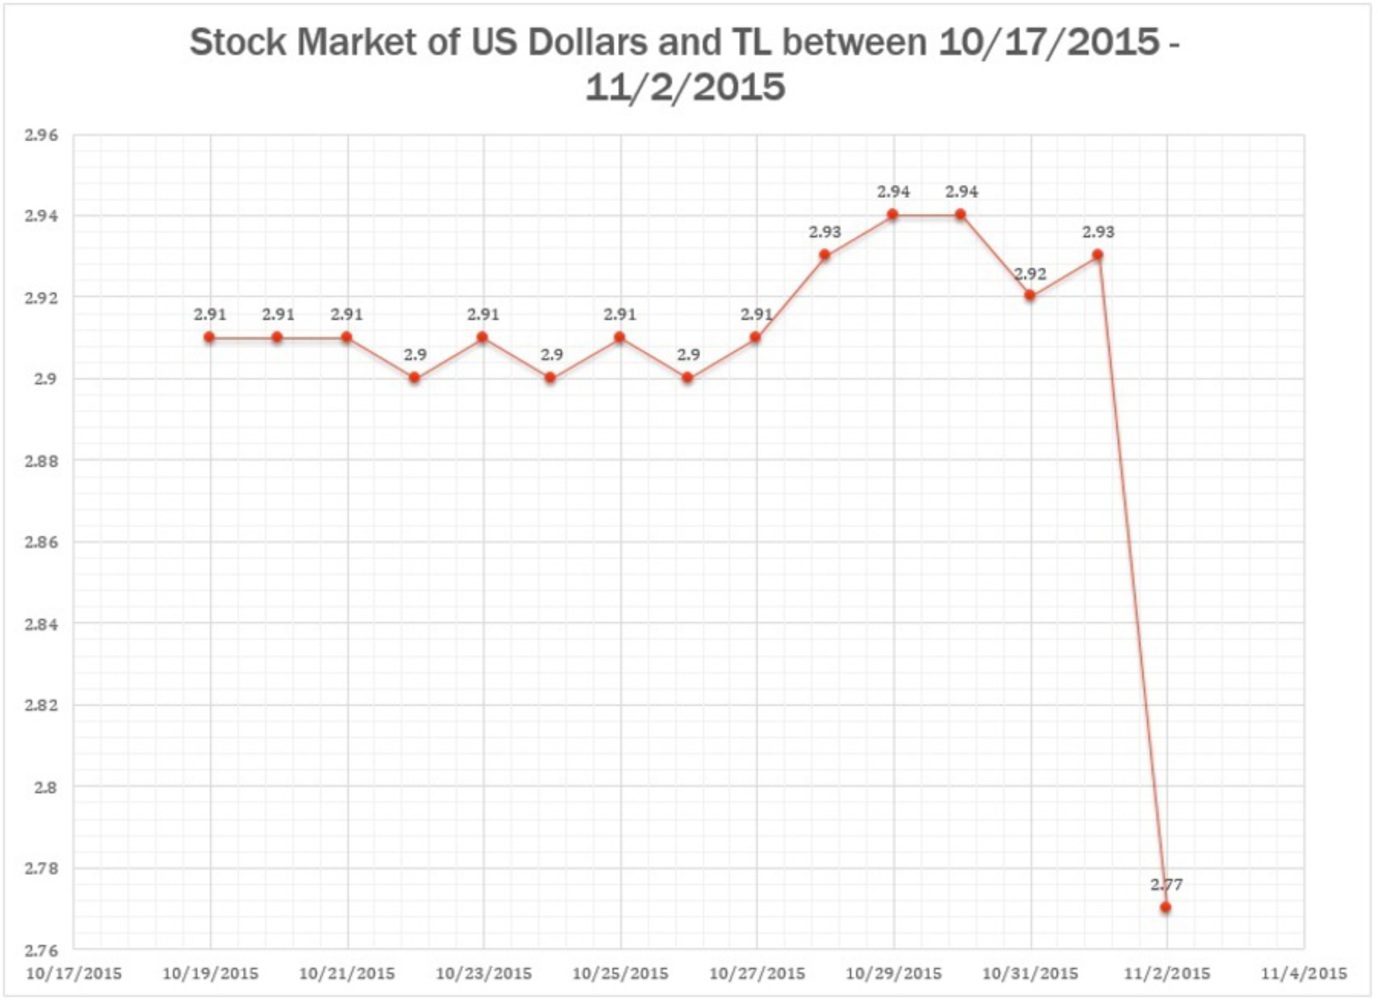
I looked at different kinds of charts to give me inspiration but I couldn't find anything. Then a drop happened in the currency rate and I called my mom to tell her. I checked on Google what it was now and saw a data graph right next to it. Then I decided this would be perfect. After choosing this, there weren't many challenges. I chose the same chart type as the both of the sites and Google did, as it was the most understandable chart to show this topic. The next thing was choosing what to lie about. Currency changes happen every second and the sites I got my information from had at least a couple of hours for every single day. I've decided to choose the rate with the highest value of US Dollars for the whole data except the very last one, and for the very last one, I chose the value that the Turkish Lira was highest. 
0

Reflection

I am actually very proud of this project. I feel like if this was published, it would create the effect I want it to. It fulfills my first wish about the project being actually related to my life, this is a very important thing in my life; and it also lies without actually lying. The data is correct, but make in a way to be a little misinterpreted. The only thing I would do differently is that I think the phrase "Stock Market" doesn't mean what I thought it means. I thought it meant the topic I'm working on, about changes in currency rates. I have only realized this in the last minutes before the deadline after I was done with the project and was talking to someone about it, so I won't make it in time to change it but that would be the only thing I would do differently if I redid the project. 
0

Attribution

"Turkish Lira | 1991-2015 | Data | Chart | Calendar | Forecast | News."Trading Economics. 02 Nov. 2015. Web. 02 Nov. 2015. 

"Graphs Converter Turkish Lira per 1 US Dollar Graph." Exchange Rates Graph (US Dollar, Turkish Lira). N.p., 02 Nov. 2015. Web. 02 Nov. 2015.

x
Share this Project


About

The goal of this project is to distort data in such a way that even if the data is correct, people will misinterpret it.