Housing Market Assessment of Hill District, Pittsburgh
Made by adobriya
Made by adobriya
A very basic and simplistic analysis of the housing market in Hill District, Pittsburgh. The project also looks into cause-effect relationships between various factors effecting this market.
Created: September 28th, 2017
Data Category Chosen : Real Estate
Having spent most of my time here in CMU working on real estate projects, this seemed liked an obvious choice and it also aligns with my career interests.
Data Set Chosen : Market Value Assessment data 2016 for Pittsburgh
This data available on WPRDC is very valuable as it gives us an insight into cause and effects of property assessment values across the city. It could be used to also decide where (neighborhood) to put your project in and the expected future value of that property. (https://data.wprdc.org/dataset/market-value-analysis-urban-redevelopment-authority)
Area Chosen : Hill District
The Hill district is a collection of five neighborhoods and presents a unique opportunity to compare neighborhoods with widely varying income levels and housing standards.
Visualization Type Used : Data Portraits - Author Lines (https://www.connectedaction.net/tag/author-lines/)
This type of data seemed to be better visualized by Data Portraits as 3 different dimensions could be easily represented and understood. This form could also portray characteristics in addition to the two dimensional comparisons on the map. The visualization seemed interesting and at the same time, easy to understand.
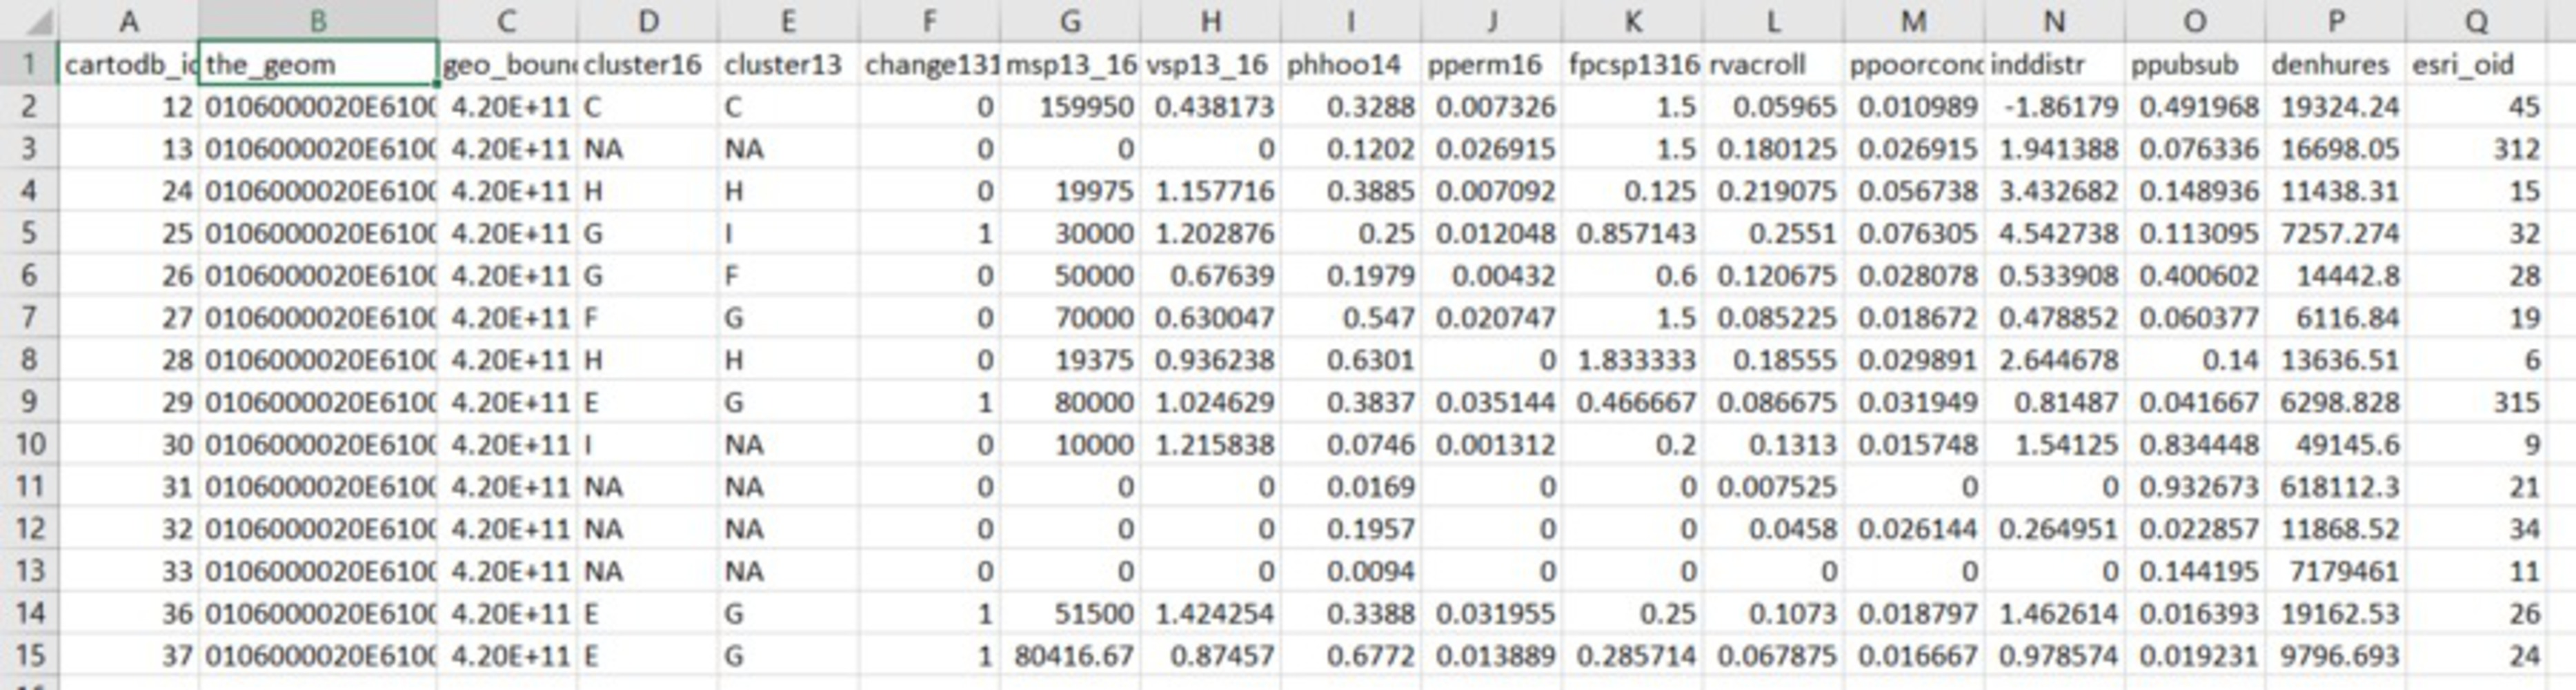
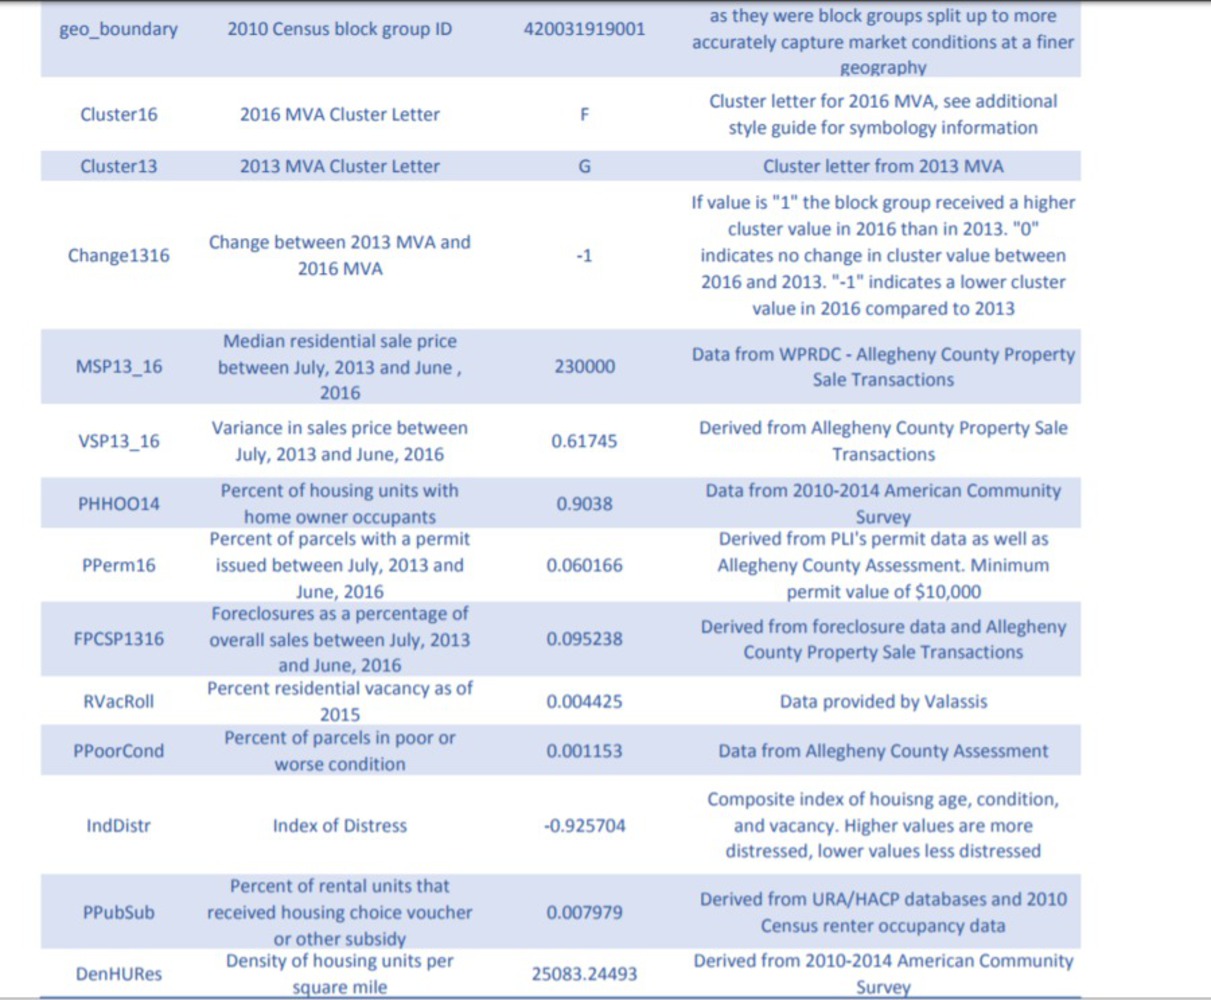
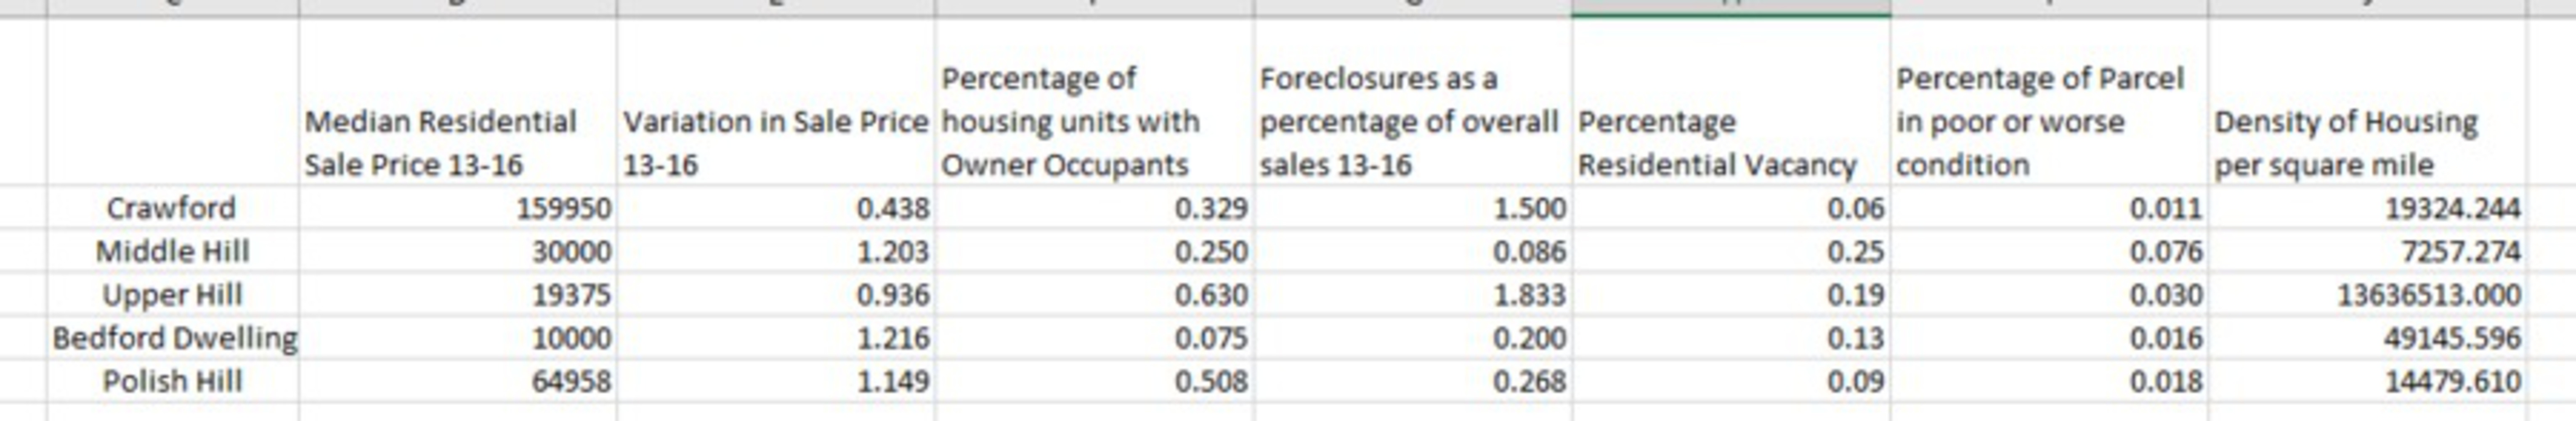
Below are three images which show the raw data-set, data dictionary and simplified data respectively:
The United States of America has roughly 132 Million housing units on a total land area of 3.5 Million square miles. This gives a housing density of 37.3 houses per square mile of land area.
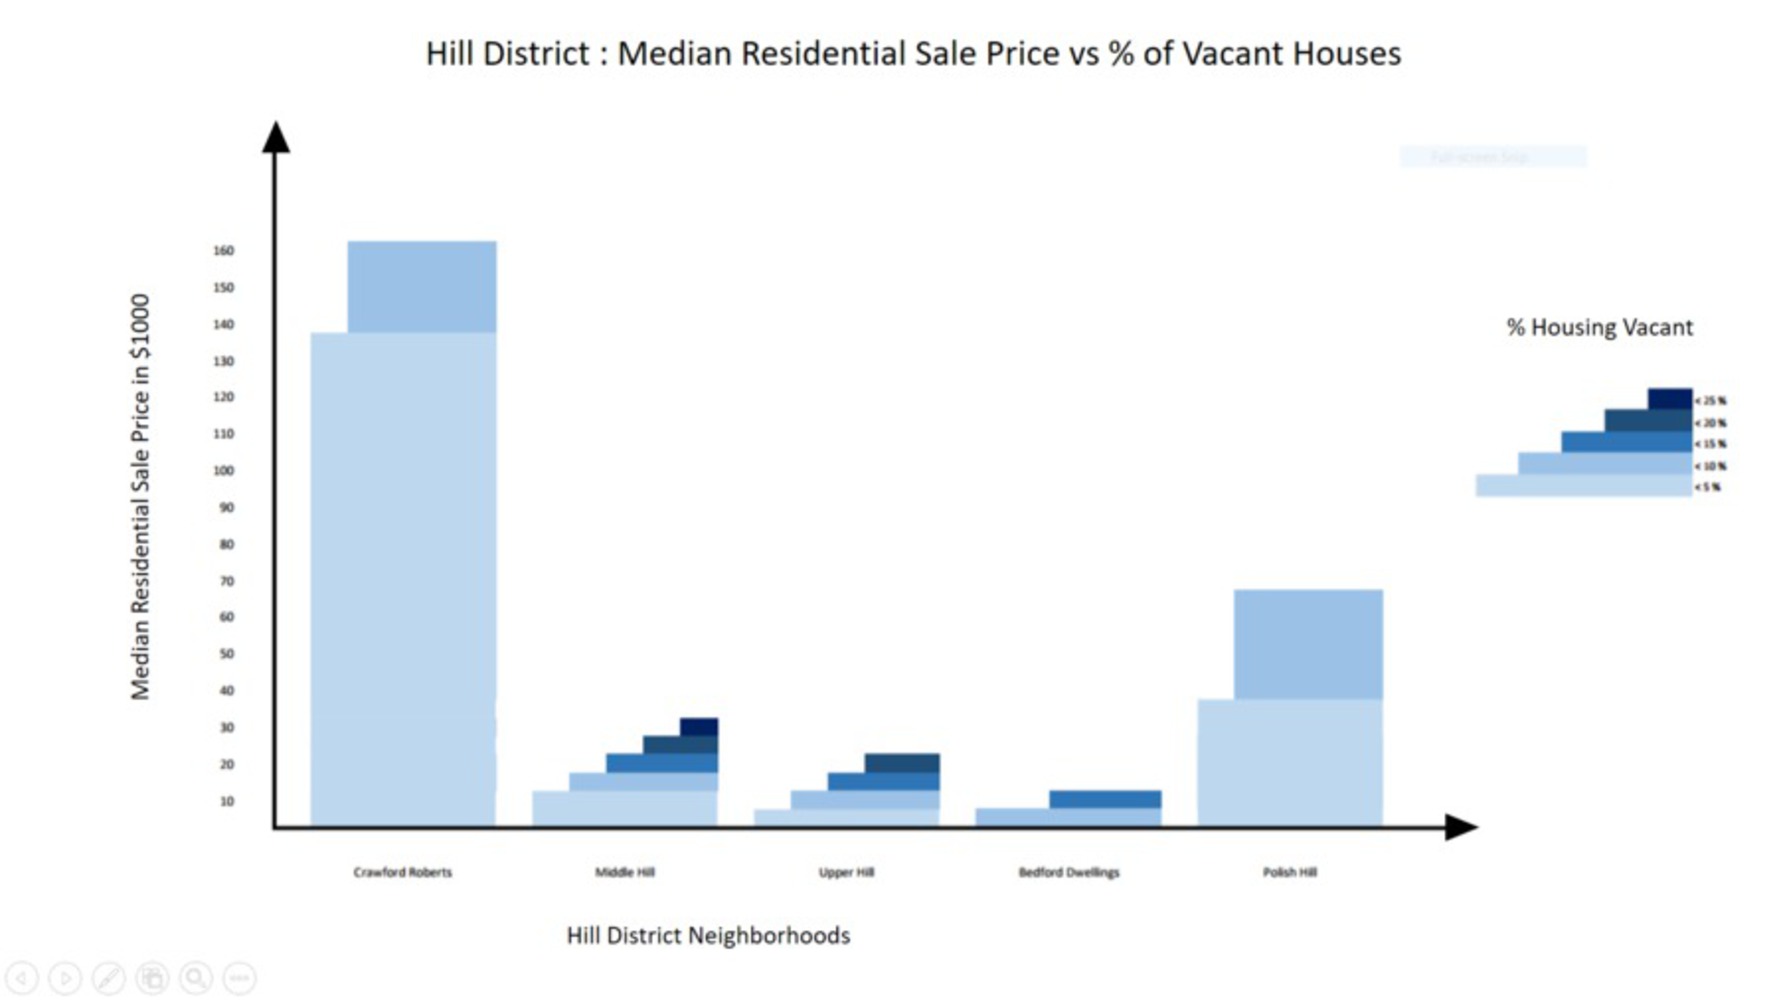
We compare this data with the Hill District, Pittsburgh which is taken to be comprised of 5 neighborhoods; Polish Hill, Upper Hill, Middle Hill, Bedford Dwellings & Crawford Roberts. The Hill district has a vacancy rate of 6%-25%, compared to the city rate of 7.7%. This brings out the fact that even with an above median number of houses per unit area, there is a high vacancy rate. This data suggests shortcomings in the housing sectors in the area.
Pennsylvania has a house density of 124 and Pittsburgh has a house density of 5,521 houses per square mile. The Hill district located has a house density of 7,250 to 19,320 making it a very densely populated residential area putting it at least 35% above city median. This gives us a brief idea about how important the housing data is for this part of the city and how big an impact a successful housing analysis would create.
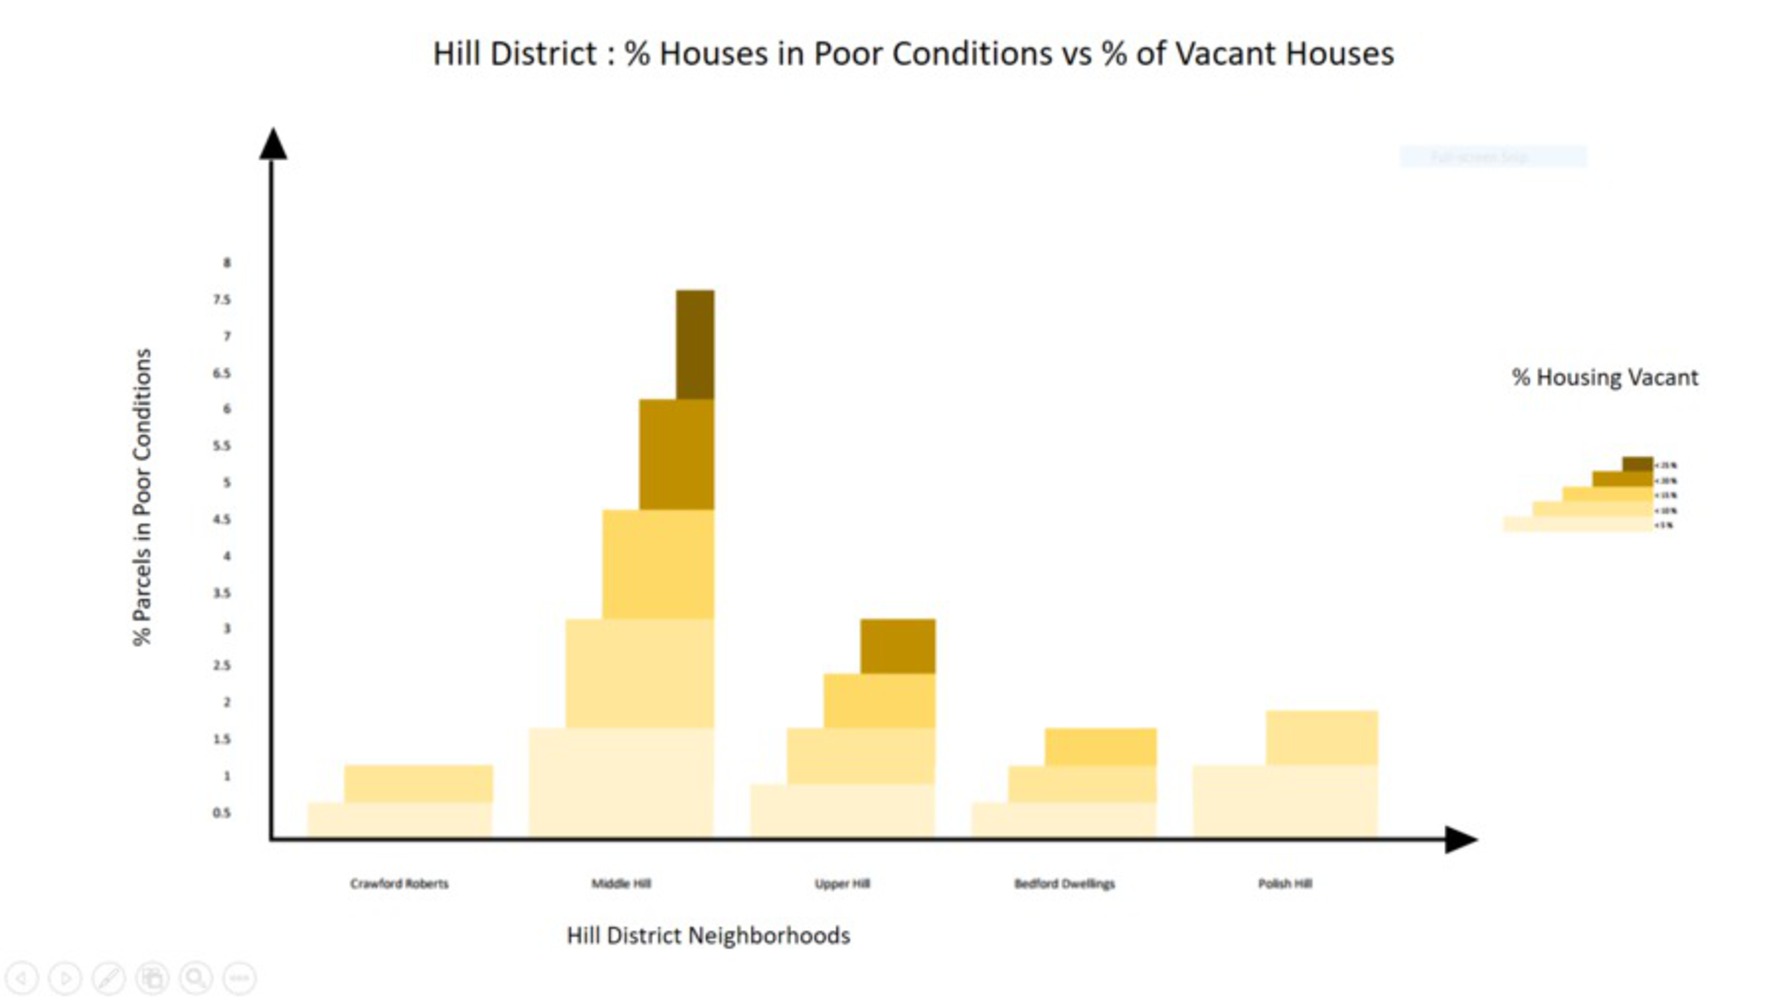
These can be attributed to the high concentration of houses with poor conditions (as defined by Allegheny County). The census data puts the percentage of housing in poor conditions at 5%. This translates to 500 houses per mile in poor conditions. That is a lot of housing and based on average household size could house at least an additional 1250 residents per square mile.
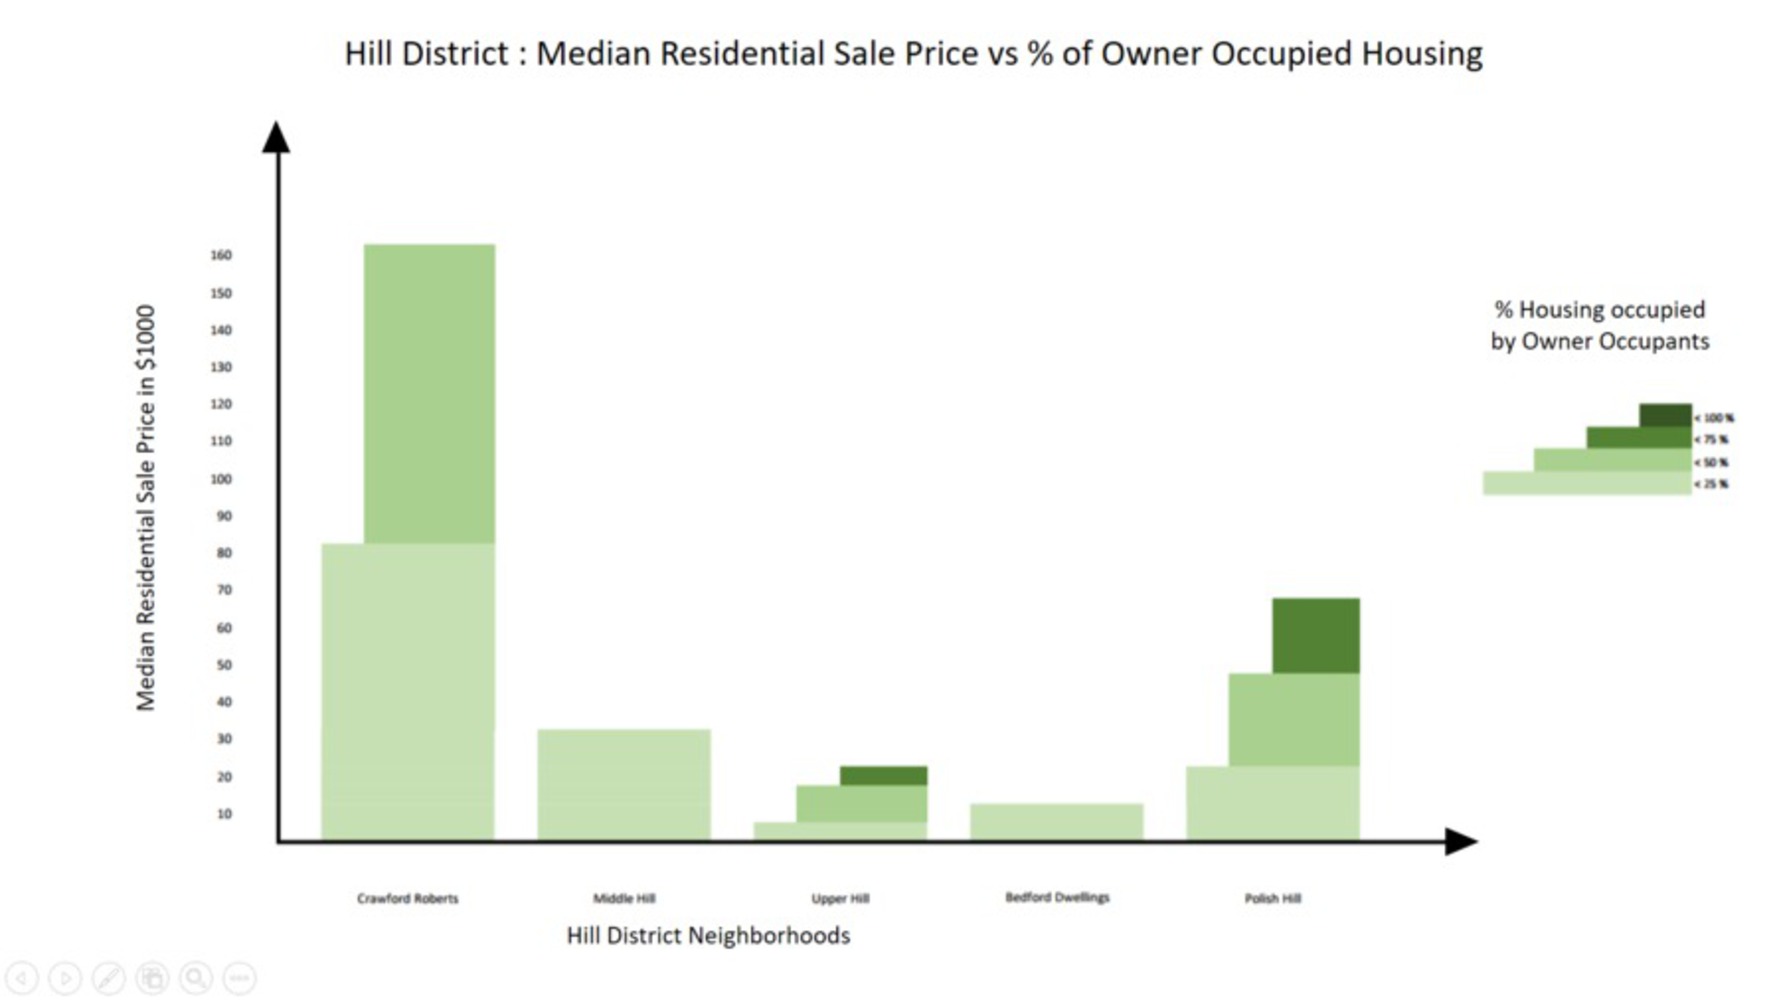
These problems in turn have an effect on the prices of houses in the area. As a result, the median residential sale price of a house in the area is $56,500 even as cost of new construction exceeds $100,000.
Expected Outcomes/Preconceptions :
Assumptions :
The next three pages show visualizations based on the expected outcomes as discussed in the previous section.
Other possible visualizations from the data set:
1. Comparison of sale price/ houses in poor conditions to foreclosures?
2. Comparison of condition of houses to % of houses receiving subsidies?
Additional reflections on the use of Caricatures:
The use of graphs and plots that we as Graduate students have been used to are based greatly upon accuracy of data. With the introduction of Caricatures, for the first time, I have been introduced to this form of data highlighting. For a simple data set with one or two dimension, I think it could be a very effective way of visualization and could be made easy to understand. However, complexity is where I would refrain from using caricatures. With more than two dimensions to display, a caricature may may end up as an exaggeration of a particular dimension missing the point that the author wanted to make and causing distraction.
City data used for simple visualizations such as population densities, housing densities, number of restaurants in an area etc, can very well be visualized using caricatures. However, any data needed to perform analysis on over-lapping systems and data layers should use other forms of representations to be more accurate and simple.
A very basic and simplistic analysis of the housing market in Hill District, Pittsburgh. The project also looks into cause-effect relationships between various factors effecting this market.