Justice Frimpong - Lying With Data
Made by jfrimpon
Made by jfrimpon
Lie about my social activity over the years using my Facebook Activity Log
Created: October 31st, 2015
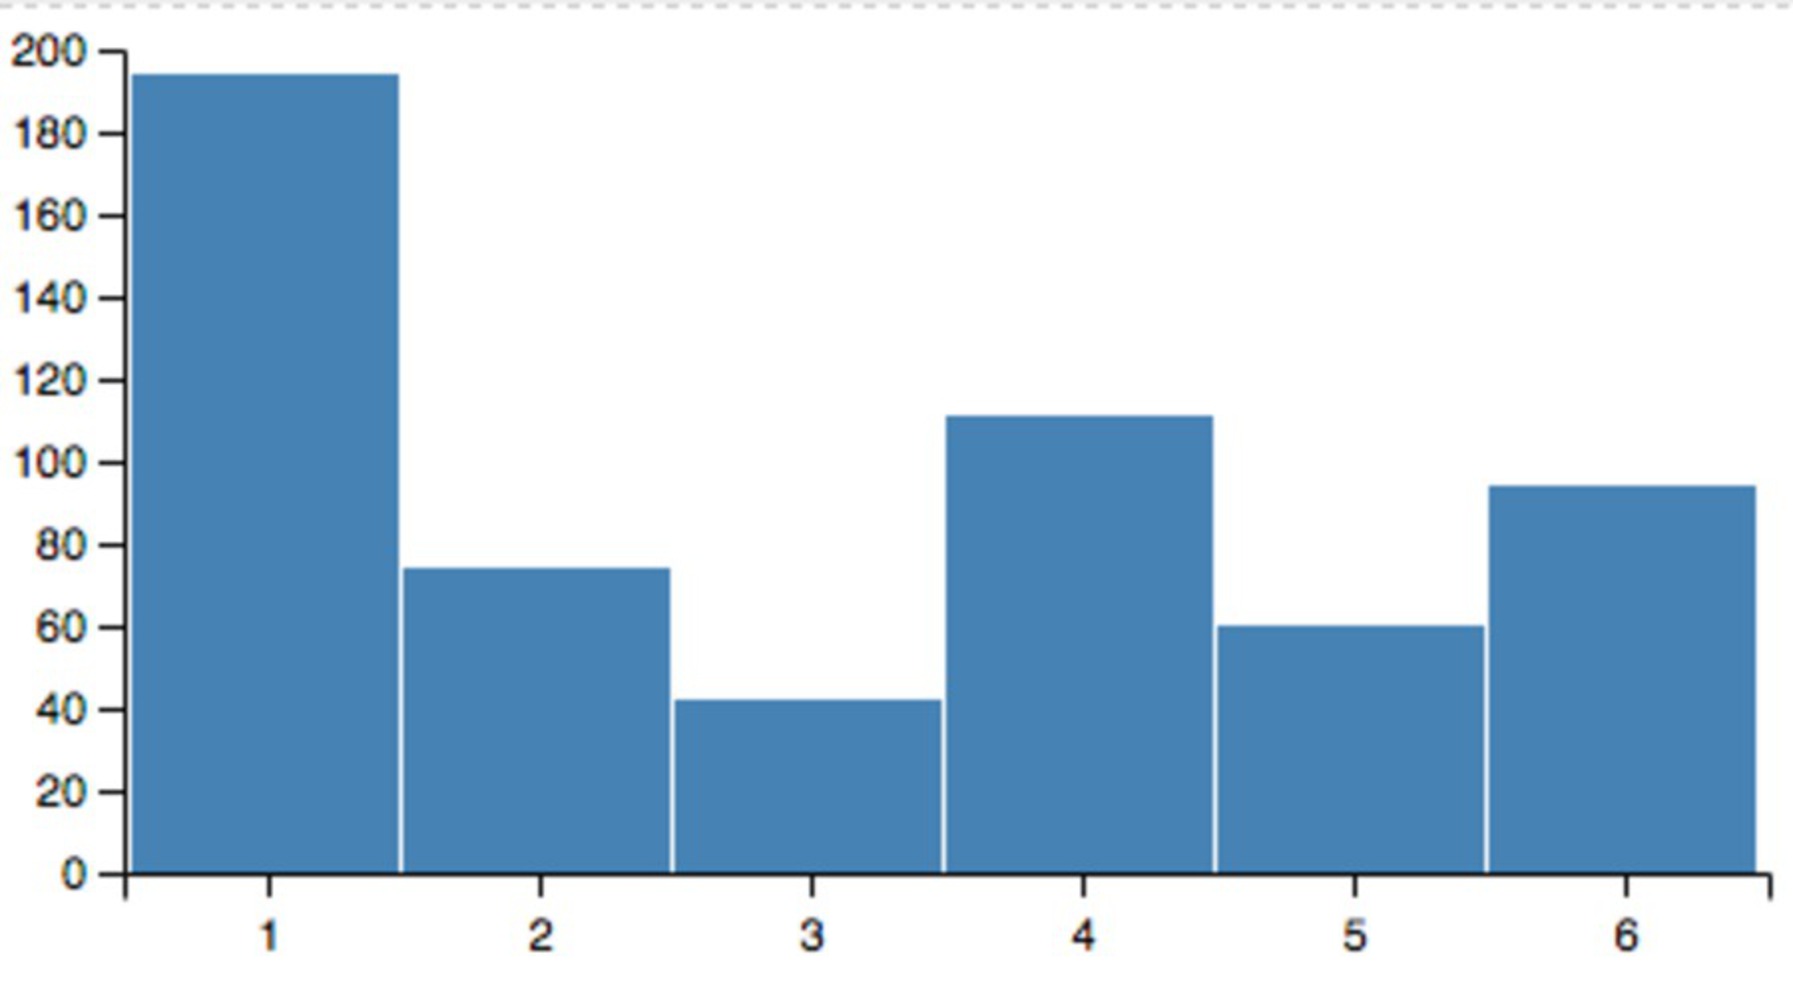
I wanted to use real data but I wanted to make it personal data because I personally found that mining through datasets of random things did not interest. So I came up with the idea to analyze 'how social I've been' over the years. To do that, I wanted to use my Facebook friends I've added. Thus, because I created my Facebook account in the beginning of November in 2009, the data spans 6 years. The Years start from start of November of Year X until end of October of Year X+1
Year 1 - Freshman, High School
Year 2 - Sophomore, High School
Year 3 - Junior, High School
Year 4 - Senior, High School
Year 5 - Freshman, College
Year 6 - Sophomore, College
My product was this 3D Donut Chart.
Facebook lets you download your information as an archive, and this information includes your friends list so at first I used this. So I downloaded my archive, but after opening the friends list they stored, I saw that it didn't include data with when I became Facebook friends with the person. So I had to go into my activity log, go to friends, and then scroll down the years so the entire page (from 2009 - 2015) loaded and included all my added friends along with time stamps. Then, I selected all and copied it into Sublime. From there, I separated each of the 6 years into their own text files, and then did a CTRL+F to find the string "became friends" and recorded the count for each of the years.
Then, after a long time of playing with other data visualization tools, I found one that I evetually settled with on amcharts.com. I added in my own data from one of their samples in Javascript and then exported the image.
For me, if I meet a person that I think is cool or nice a couple times, then I'll add them as a friend on Facebook because like why not. I wanted to run with this idea because I wanted to be able to measure how my 'social activity' has changed over the years, and then I wanted to try and see if I could skew the data in a visual manner to show that as I've become older, I've become less and less engaged in social activity, or at least less and less engaged in meeting new people (such that one of us wants to add the other one).
I was inspired by Nick Fenton's personal annual reports because the data he created about his daily life was incredibly interesting when visualized. I had never thought what everyday-life data would look like if it was recorded for a long period of time and then visualized.
Another inspiration was manyeye's (from the video screening we were assigned last week) data visualization tools for every day people. At one point in the video, the presenters pulled up a tree of someone's wedding, and they were able to sort it by the labels the person added in. So, I wanted to find something that was already recorded about me and I thought "Facebook" and the rest was history.
One last inspiration were those questions that news stations use for their arguably unusual data, or random data statistics that 'UberFacts' posts on twitter. While the data I used is accurate and true, it doesn't exactly say too much about how social I've been in these years. Of course there is a relationship, but it's not the entire story.
After I figured out what I wanted to do, I had a hard time finding the write visualization tool. I initially thought about using bar graphs so my first thought was excel.

I personally feel that this was one of the harder projects for me because I wanted to use a dataset that was personal to me, and finding that took a while. And even after that, it took an even longer time of finding a data visualization tool that had a right balance of distortion and art. I learned that it is much harder than it seems to create artistic data visualizations. And I also learned that Facebook doesn't add your activity log to the list of items in your profile archive you can download.
Reference any sources or materials used in the documentation or composition.
http://www.amcharts.com/demos/3d-donut-chart
https://twitter.com/UberFacts/status/660468071744737281
Lie about my social activity over the years using my Facebook Activity Log